Abstract - The objective of this study is to evaluate the profitability and the effects of direct and
indirect taxes on rice production in Brazil compared to other member countries of Mercosur. This article uses the Policy Analysis Matrix (PAM) to evaluate the economic efficiency of the production systems of the four Mercosur countries: Brazil, Argentina, Paraguay and Uruguay, measuring prices and private and social costs. The results have shown that in 2010, rice production in Argentina and Uruguay had positive social and private profitability, while in Brazil and Paraguay there were negative private results. Secondly, a simulation of an alternative scenario for Brazil was performed, considering a reduction in the direct and indirect tax burden to a similar percentage between the countries compared. Under the simulation of this new scenario, the production of rice in Brazil did not remain in deficit, but it had very low profitability. Other variables that were not the focus of this study, such as productivity development, technologies and exchange rates, also significantly affect the profitability of rice production in Brazil.
Keywords: comparative advantages, international trade, Mercosur, public policies, taxes.
Matriz de Análise de Políticas (MAP) aplicada à produção de arroz no Mercosul
Resumo – O objetivo deste estudo é avaliar a lucratividade e os efeitos da carga tributária diretae indireta na produção de arroz no Brasil frente aos demais países integrantes do Mercosul. Com esse intuito, o presente artigo utiliza a Matriz de Análise de Políticas (MAP) para avaliar a eficiên-cia econômica dos sistemas de produção dos quatro países: Brasil, Argentina, Paraguai e Uruguai, mensurando preços e custos privados e sociais. Os resultados apontam que, na situação vigente em 2010, a cultura de arroz na Argentina e no Uruguai apresenta lucratividades privadas e sociais posi-tivas, enquanto no Brasil e no Paraguai se observam resultados privados negativos. Num momento, procede-se a uma simulação de um cenário alternativo para o Brasil, onde a carga tributária direta e indireta é reduzida em um percentual de semelhança entre os países comparados. Sob a simulação
Rice production in
Mercosur seen through
a Policy Analysis
Matrix (PAM)
1
Ângela Rozane Leal de Souza2 Jean Philippe Palma Révillion3
1 Original recebido em 14/1/2013 e aprovado em 4/2/2013.
2 Assistant Professor, Federal University of Rio Grande do Sul (UFRGS), Faculty of Economics (FCE/DCCA) and Ph.D. student in the Graduate Program in
Agribusiness, Center for Studies and Research in Agribusiness (CEPAN/UFRGS), Av . Joao Pessoa, 52 - Room 11 – DCCA, CEP 90.040-000, Porto Alegre - RS - Brazil. E-mail: angela.rsl@gmail.com and angela.souza@ufrgs
3 Ph.D. in Agribusiness, Associate Professor, Federal University of Rio Grande do Sul (UFRGS), Graduate Program in Agribusiness, Center for Studies and
deste novo cenário, a produção de arroz no Brasil não permanece deficitária, mas apresenta renta-bilidade bastante reduzida. Outras variáveis, que não foram o foco específico deste estudo, como a evolução da produtividade, tecnologias e taxas cambiais, também interferem significativamente na lucratividade da orizicultura brasileira.
Palavras-chave: vantagens comparativas, comércio internacional, Mercosul, políticas públicas, im-postos.
Introduction
Rice is one of the most important crops in the world in terms of economic value. Regard-ed as the most important food crop in several developing countries, it is one of the most con-sumed cereals in the world and the basic food of almost half the present world population. Ac-cording to FAO estimates, by 2050, this popula-tion will double. Brazil is part of this scenario as the world’s largest rice producer, after the Asian continent (FAO, 2011).
In Mercosur, Brazil is the greatest producer and consumer of this cereal, and produced 13.61 million tons of paddy rice in 2010/2011 (CONAB, 2011a). Argentina, Uruguay and Paraguay to-gether produced about 2.7 million tons of rice in 2009 (FAO, 2011). However, the tax burden on rice production in Uruguay, Argentina and Paraguay is around 15 percent, while in Brazil it is almost 25 percent. This hinders the competi-tiveness of the Brazilian product and significantly affects rice producers’ profitability (EMBRAPA ARROZ E FEIJÃO, 2011; FIESP, 2010; IBPT, 2011). Even with the creation of the regional economic block (Mercosur), a uniform tax policy has not been established among its members.
It is important to highlight that Uruguay and Argentina together account for about 90 percent of Brazilian rice importations. Those two countries, however, have advantages in rice pro-duction due to differences concerning produc-tion and tax costs, more competitive financing interest rates, and geographical proximity to Bra-zil (IBGE, 2010). The economic and competitive importance of rice to Mercosur and Brazil has motivated the present analysis.
In this setting, the following issue is ad-dressed: what are the effects of both direct and
indirect tax burdens on the profitability of Brazil-ian rice production in comparison to other coun-tries in Mercosur?
Aiming at assessing this situation, this study is based on theoretical macroeconomic concepts related to public policies and compara-tive advantages applied to international trade, using the Policy Analysis Matrix (PAM) as analy-sis model. Grounded on this scenario, this study aims at determining the economic efficiency of rice production in Brazil by considering this mar-ket and its present conditions, and also taking into account the tax burden put on this produc-tion in Mercosur.
The Common Market of the
South and Rice Market
The institution of the Common Market of the South (Mercosur), a process of economic in-tegration of Argentina, Brazil, Paraguay and Uru-guay, has trade freedom and bilateral opening of its member states as its goal, considering their geographical proximity and the comparative ad-vantages existing among the countries.
The objective of this common market is to allow the free circulation of goods, services, workers and capital. However, as a consequence of the state members’ peculiarities, the integra-tion has faced some obstacles that are charac-teristic of economical and political integration (MERCOSUR, 2011).
In the present situation, the regional inte-gration of Mercosur has assumed intra-sector fea-tures, and the perspectives of competitiveness of agro-alimentary systems should be highlighted. Issues concerning competitiveness of these sys-tems comprehend several factors, such as
tech-nological variables, product and service quality requirements, logistics and market spheres, in which prices, costs and the tax burden in effect in each state member should be taken into ac-count (FONDO MONETARIO INTERNACIO-NAL, 2006; MERCOSUR, 2011).
In the world rice market, the main pro-duction regions are in the Asian continent, rep-resenting 90 percent of the world production, according to data from 2009 that were recently released by FAO (2011). However, in the last three years, Mercosur has drawn the attention of the global rice market because of a 19-percent increase in production, which broadened its par-ticipation in the world market. Brazil occupies the 9th position in the world ranking.
The increasing Brazilian exportations of rice to the African continent are a tendency pointed out by IRGA (2011b). Africa is regarded as an ex-portation channel that has evolved from 2006. This market started purchasing broken rice, but from 2007 it has changed its profile, with a grow-ing interest in larger amounts of higher quality rice. In the foreign trade, the influence of the exchange rate on both rice exportations and im-portations must be considered. With the valo-rization of the Brazilian currency, exportations have decreased, since prices have become less competitive in the world market. On the other hand, this has encouraged exportations, due to the product affordability in relation to the exter-nal market.
In 2010/2011 rice crop, Mercosur faced a production surplus. Total production increased around 22 percent (total production of 17.3 mil-lion tons in Mercosur); with the consumption of 13.4 million tons, the surplus reached 3.9 mil-lion tons, the highest figure since Mercosur was created (IRGA, 2011a). In Uruguay, for instance, the production has been increasingly directed to destinations outside Mercosur, particularly Andean countries and Middle East countries, where the demand for imports is active. Taking only Mercosur countries, the main exporters are Argentina and Uruguay, which conjointly export
937.9 thousand tons to Brazil and other countries that do not participate in the block (IBGE, 2010; USDA, 2011).
Tax burden in Brazil and Mercosur
The Brazilian tax burden increased ap-proximately 10 percent from 1990 to 2010, reaching 35.04 percent of the Gross Domestic Product (GDP) in 2010. In real terms of GDP, there was economic growth in the country, but the percentage of the tax burden on GDP was also eminent; in the last 10 years only, this per-centage has increased 5 percent (BRASIL, 2010; IBPT, 2011; OECD, 2011).
It is true that the Brazilian taxation of goods and services overburdens both production and consumption; besides, in the Brazilian taxation system, taxes on the added value coexist, and this distorts the production costs. Adding to this situation, there is a cascade effect (incidence of a tax on the value of another tax). For example, the Excise Tax (IPI) integrates the calculations of the tax on operations related to the Value-Added Tax on Sales and Services (ICMS).
The prices of goods and services are affect-ed by this tax increase, which is transferraffect-ed to the production links (BRASIL, 2010; FIESP, 2010). In Brazil, tax incidence is both direct and indirect. Direct taxes are the ones that affect individuals and businesses, while indirect taxes are levied on goods and services. In this way, a tax is either direct or indirect according to its incidence, i.e. its tax basis (ATKINSON, 1977). Percentages in Brazil are comparable to the ones found in coun-tries such as Canada and Germany, where the return of taxes to the contributors in the form of services and other benefits is clearly higher.
Differently from Brazil, Argentina, Para-guay and UruPara-guay have adopted similar tax systems, which are applied to consumption, ac-cording to the technique of added value (IVA), and their tax incidence is lower than Brazil’s.
IVA is a tax levied on non-cumulative bill-ing and specified in invoices, thus enablbill-ing
con-sumers to know the value of the tax that is part of the price paid for goods or services. This tax system was adopted in the European Union (EU) due to the benefit it would bring to the circula-tion of products, goods and services among the state members. In Mercosur, the countries that have adopted IVA are Paraguay, with the single incidence of 12 percent; Uruguay, with a reduced tax rate of 14 percent (first necessity products) and a general tax rate of 23 percent; and Argen-tina, with a reduced tax rate of 10.5 percent, a general tax rate of 21 percent and a maximum tax rate of 27 percent (MARTINS, 2004; MERCO-SUR, 2011). Therefore, one of the debates about the process of integration in Mercosur involves the harmonization of the tax regulations. In this integration, even if the system and tax rates are not identical, the systems could be compared, as they would follow the same principles.
Rice production and
taxes in Mercosur
The taxation of rice occurs along the five phases of the production chain. At the produc-tion stage, still in the rural area, farmers are taxed when they buy the inputs needed for planting and harvesting. The harvest is the sec-ond stage, which includes processing. The third stage comprises the packing process. Trade with wholesalers characterizes the fourth stage of the production cycle. The fifth stage is retailing, when the product reaches the end consumer.
In rice production, taxes are part of all the production processes and represent, as a whole, a significant percentage that heightens the prod-uct cost (Table 1).
In Table 1, it is possible to notice that both direct and indirect tax burden on rice produc-Table 1. Summary of tax burden on rice production costs in Brazil, 2008-2009.
Abbreviations % Notes
IR and CSLL 1.94 Considering 25% on the net profit before IR and CSLL
IPI 1.05 Considering 4%, pesticides 5%
Cofins 2.89 Considering 3%, fuel 8.28%, seeds 0%
PIS 0.63 Considering 0.65%, fuel 1.78%, seeds 0%
IOF 0.01 Considering 0.0041 % ad
INSS 1.94 Considering 20%
FGTS 0.77 Considering 8%
Cide 0.73 Considering 4.76%
Taxes CDO 1.37 Tariff differentiated by implementation/activity
Funrural 3.97 According to rice production cost – IRGA
Environmetal license 0.13 According to rice production cost – IRGA
ISSQN 1.39 Considering 5%
Total 24.48
Source: Based on IRGA (2011b).
Notes: IR – Income Tax; CSLL – Social Contribution on Net Income; IPI – Excise Tax; COFINS – Tax for Social Security Financing; PIS – Employees’ Profit Participation Program; IOF – Tax on Financial Transactions; INSS – Social Security Contribution; FGTS – Government Severance Indemnity Fund for Employees; CIDE – Contribution of Intervention in the Economic Domain; ICMS – Value-Added Tax on Sales and Services; CDO – Fee for Cooperation and Protection of Rice Production; FUNRURAL – Rural Workers’ Assistance Fund; ISSQN – Services Tax.
tion costs is almost 25 percent in Brazil. How-ever, in Argentina, Paraguay and Uruguay, total percentages are lower: 16, 12 and 14 percent, respectively (ASOCIACIÓN CULTIVADORES DE ARROZ, 2011b; IRGA, 2011b). The differentiation of tax on production cost among the state mem-bers of Mercosur is clear.
By observing the high tax burden, it is pos-sible to see that the Brazilian positioning in rela-tion to this issue is the opposite of that pointed out by Rakotoarisoa (2011). The author highlights that the reduction of taxes on rice production and exportation in developing countries both encourages the adoption of new technologies and increases productivity.
Rice prices and subsidies
in Brazil and abroad
The minimum price policy is an agree-ment between the governagree-ment and producers in which the former binds itself to buy, at the latter’s request, the whole production at the price set in such agreement, i.e. the producers obtain a sales right that they can or cannot exercise. As there is no financial commitment on the producers’ side to obtain such right, the value involved is char-acterized as an implicit subsidy conceded by the government.
The minimal price entails the establish-ment of a minimal payestablish-ment for the product. For a minimal price to be effective, it has to be high-er than the market equilibrium price. Howevhigh-er, according to the Federation of Agriculture of Rio Grande do Sul, the minimal price set by the Bra-zilian government does not cover the production costs (FARSUL, 2011). On the other hand, the Brazilian government has provided subsidies and subventions to harvest flow by means of auctions of Public Option Contract, Product Flow Award (PEP), Equalizing Price Paid to Producer (PEPRO) and Direct Acquisition by Producers (AGF), be-sides destining part of the harvest for the animal food industry, with subsidies (IRGA, 2011a).
Yet, concerning the world rice market, for example, the level of subsidies on the produc-tion is much higher in the United States, Euro-pean Union and Japan in terms of monetary representativeness. While subsidies reach an average annual total of U$ 56,000 by rural unit in the United States, U$ 27,000 in Europe, and U$ 20,000 in Japan, they are around U$1,100 by rural unit in Brazil (CASAMATTA; RAUSSER; SI-MON, 2011; CONAB, 2011b; RAKOTOARISOA, 2011).
Common External Tariff
The four state members of Mercosur have adopted the Common External Tariff (CET), hav-ing importation rights on each of the goods on the list called Mercosur Common Nomencla-ture. According to the established guidelines, CET should encourage competitiveness, and its tariff levels should help avoid the formation of oligopolies or market reserves. CET should meet the following criteria: (a) small number of tax rates; (b) low dispersion; (c) the greatest possible homogeneity of tax rates for effective promotion (exportations) and effective protection (importa-tions); (d) defined aggregation levels for tax rates (MERCOSUR, 2011).
The Common External Tariff (CET), accord-ing to the Mercosur Common Nomenclature (MCN), is an importation tax rate that the state members have in common for specific com-modities. In the case of paddy rice, it is 10 per-cent; for processed rice, it is 12 percent. This tax is imposed on rice imported from any country outside the block. Besides aiming at stimulating the trade interchange among the state members, CET attempts to protect the local product from subsidies at the origin and/or from exchange rates controlled by countries outside Mercosur, thus trying to heighten the cost of the product imported by the block.
Theoretical aspects of public
policies and comparative advantages
In the macroeconomic scenario, public policies are associated with specific institutional trajectories and have their own dynamics. Both the formulation of alternatives and decision-mak-ing represent an important stage of the creation of public policies. According to Simon’s model (SIMON, 1957), decision-making by political managers involves the choice of the best solution by considering possibilities and restrictions, such as financial resources, information, etc. In gener-al, two activities can be highlighted in this phase: (1) formulation is the conversion of a problem into alternatives, taking into account the ways of action and intervention, as well as the strategies that support them (technical studies, conflicts, forecasts, construction of scenarios, persuasion, etc.); (2) the legitimation work, which consists of confronting a solution with criteria or rules, in-scribing a solution into a particular frame. Thus, considering the actors (government agents and target audiences) involved in the formulation of public policies, the evaluations are carried out by taking into consideration the effects attributed to the government action. The evaluation is usually performed in relation to reference situations, val-ues, norms and perceptions, and different evalu-ators are likely to diverge as to the actual effects of a public action (LINDBLOM, 1965).
The international trade theory stemmed from the need for understanding the processes of international exchanges. David Ricardo de-veloped a theory of generalizations that can be applied to any country. The theory developed by Ricardo (1817) has provided an explanation for the movement of goods in international trade considering either the supply or the production costs existing in those countries. Countries that export certain products will specialize in the production of goods whose cost is comparative-ly lower than that of the same goods in other exporting countries. From this perspective, the difference of prices in effect in different coun-tries stimulates external trade, by directing the products to those where prices are higher. The
difference in prices, in turn, is explained by the comparative advantage, which enables some countries, due to a range of circumstances, to produce a number of exportable products at lower costs.
The analytical model:
preliminary considerations
The analytical approach of this study is based on the Policy Analysis Matrix (PAM) as developed by Monke and Pearson (1989). PAM consists of an accounting and economic system that analyzes revenues and costs at both pri-vate prices and social prices by means of two accounting identities: profitability, given by the difference between revenues and costs; and the measure of divergences or distortions of poli-cies and failures in the market. This accounting tool allows a detailed description of intra- and inter-sector interdependences of economic rela-tionships, besides providing an evaluation of the effects of implementation of economic policies in agriculture.
PAM has been used in several works to evaluate the economic profitability and the ef-fects of agriculture policies. For example, Nel-son and Panggabean (1991) used it to analyze the effects of public policies on sugar production in Indonesia; Pearson et al. (1995) applied it to evaluate the agriculture policy in Kenya; Adesina and Coulibaly (1998) analyzed the impacts of political changes on the competitiveness of corn production under the management of alternative technology in the Republic of Cameroon; Fang and Beghin (2000) evaluated the self-sufficien-cy of food market and comparative advantages of the main crops in China; Yao (1997) carried out a study in Thailand using the Policy Analysis Matrix to asses rice production in comparison to soy and bean production. Yao (1997) examined the effects of price variations and externalities on the comparative advantages of rice produc-tion in relaproduc-tion to competing crops, by simulating scenarios and evaluating the alterations derived from these new factors.
In the proposed model, prices are evalu-ated from the difference that could be in effect in the absence of distortions. Profits are defined as the difference between total revenues and total costs. Each matrix contains two cost columns for costs: one for tradable inputs and the other for domestic factors; the domestic factors comprise costs of direct and indirect taxes.
The first line of PAM (Figure 1) infers the measure of private profitability. The private terms refer to received revenues (A) and incurred cost (B and C) in the country. Therefore, they reflect the prices in the domestic market (A) and evi-dence the production system competitiveness in the period for a given technology employed, product prices, input costs and domestic fac-tors, including policy transfers (such as taxes and subsidies). Positive financial results show that the production system is competitive in terms of profitability, given the existing conditions, so that the agents have stimuli to carry the activity on.
The second line of the matrix shows the social valuations calculated to assess the prof-itability of the agricultural production system, where the concept of comparative advantage is applied as a measure of social profitability, thus indicating efficiency in the allocation of nation-al resources. The concept of efficiency, in this model, is taken as utilization of the resources that provide higher levels of production and rev-enues, reflecting the social opportunity cost.
The social prices related to revenues (E), tradable inputs (F) and social valuations are the ones used in the world market. The estimate of social prices of revenues uses world prices, i.e.
world prices are multiplied by the average pro-ductivity of each country.
It is thought that world prices of social costs related to domestic factors (G) are given by the estimate of the net income forgone because the factor was not employed in an alternative other than in investments in the activity (land, capital and work).
The production activity implies expenses with labor (wages and social charges), cost of de-preciation of machinery and equipment, leasing of production factors, and financial resources, among others. In the estimate of social costs, the amount that could be usefully received in an-other activity or application of the available re-sources is considered as social opportunity cost. The third identity (I, J, K, L) refers to the dif-ferences between private prices and social prices for revenues, costs and profits attributed to the effects of policies and product market.
The present study analyzes, firstly, rice production in Brazil in relation to the other state members of Mercosur by using data related to the year 2010. Secondly, this study simulates a scenario for Brazil, with a 10-percent reduction in the tax burden. This percentage was chosen for the Brazilian tax burden to become similar to the average tax on rice production adopted by the other countries in Mercosur.
Indicators of PAM used in this study
a) Private Cost Ratio (PCR = C/(A-B)) – It indicates the level of competitiveness as
Items Revenues Costs
Tradable Inputs Domestic Factors Profit
Private prices A B V D
Social prices E F G H
Effect of divergences and policy efficiency I J K L
Figure 1. Policy Analysis Matrix (PAM).
to the maintenance of domestic factors (land, capital and work). An indicator less than 1 is considered as a non-com-petitive system whose producers receive less than the normal return, thereby it is possible to infer that the activity cannot succeed without governmental interfer-ence;
b) Domestic Resource Cost (DRC = G/ (E-F)) – It indicates the value added to world prices. A DRC less than 1 indi-cates that domestic factors provide net revenues to the country. This indicator allows us to infer whether world prices are enough or not to pay for the domes-tic production factors;
c) Nominal Protection Coefficient (NPC = A/E) – NPC less than 1 indicates that the value received by the chain corresponds to a value that is lower than the product market prices;
d) Effective Protection Coefficient (EPC = (A-B)/(E-F)) – It is the ratio of value added measured in private prices to value add-ed in world prices, indicating the levels of protection of the production factors and business capacity. This instrument indicates the extension of incentives and obstacles imposed by official poli-cies on the production systems. EPC higher than 1 means that private profits are higher in the presence of interven-tion policies in the markets of tradable inputs and products;
e) Profitability Coefficient (PC = (D/H)) – It measures the effect of incentives of all policies. It is the ratio of private profits to social profits. A value lower than 1 means that the production is implicitly taxed, and the profit is reduced;
f) Subsidy Ratio to Producers (SRP = (L/E)) – It measures the net transfer to the sys-tem as a proportion of total social rev-enues, evidencing strongly subsidized
policies. Indicators lower than one show a reduced subsidy level.
Operation of PAM model
applied to rice production
In this study, revenues and costs estimated refer to the year 2010. In order to estimate private Brazilian revenues (A), weighted average of pric-es of paddy rice in 2010 (50-kilo bag) provided by Emater-RS (2011) was multiplied by the aver-age yield of Brazilian 2009/2010 crop provided by FAO (2011). For Argentina, Paraguay and Uru-guay, prices were provided by Asociación Culti-vadores de Arroz (2011a) and Brasil (2011). The yield of these three countries is also based on data provided by FAO (2011).
Values of rice production costs in Brazil (post-harvest expenses, financial expenses, de-preciations and other costs) are based on data provided by Conab (2011a). The weighted aver-age of the production costs of irrigated rice and dry rice in 2010 was estimated according to planted area, production and yield (Table 2).
The total value of private costs for Brazil (Table 2) corresponds to U$ 435.74 of tradable inputs and to U$ 1,077.49 of domestic factors, as shown in Table 4. Private costs of production in Argentina, Uruguay and Paraguay related to the year 2010 were obtained in a study by Aso-ciación Cultivadores de Arroz (2011b), Paraguay (2011) and SIIA (2010).
For measuring social revenues (E), this study has considered the weighted average val-ues of paddy rice established by the Chicago Board of Trade in 2010 (CME GROUP, 2011) versus the average rice production in Brazil, Ar-gentina, Uruguay and Paraguay concerning the 2009/2010 crop, according to FAO (2011).
With the current expansion of the inter-nationalization of Latin-American rice, as Brazil has extended its exportation destinations over the market, an instrument of protection against oscillations has become necessary, besides a ref-erence or benchmark that is able to determine
Table 2. Estimated production cost of dry and irrigated rice in 2010/2011 crop in Brazil.
Estimated cost of production Weighted average
2010 -2011 Crop
Dry rice Irrigated rice
Discrimination participation Average
(%) Discrimination Average participation (%) Private costs (US$/ hectare) I- Crop expenses I- Crop expenses
1- Aerial spraying 0.00 1- Aerial spraying 2.87 37.07
2- Machine operation 4.81 2- Machine operation 19.88 263.31
3- Services and machine rental 0.00 3- Services and machine rental 0.32 4.19
4- Operations with the use of
animals 0.00 4 - Temporary labor 5.14 66.53
5- Labor 1.72 5- Permanent labor 1.48 22.69
6- Seeds 6.76 6 - Seeds 6.59 101.38
7- Fertilizers 26.64 7- Fertilizers 10.21 181.1
8-Fungicides and herbicides 17.00 8- Fungicides and herbicides 9.19 153.26
9- Administrative overhead 2.85 9- Administrative overhead 2.78 41.79
Total of crop expenses (A) 59.78 Total of crop expenses (A) 58.47 871.32
II - Financial expenses II- Expenses after crop
1- Agricultural insurance 0.00 1- Production insurance 1.17 15.13
2- Technical assistance 1.20 2- Technical assistance 1.17 17.55
3- External transportation 2.57 3- External transportation 3.61 51.86
4- Storage 5.70 4- Storage 4.22 66.2
5- CESSR 2.28 6- Environmental licence 0.05 5.2
Total of post-harvest
expenses (B) 11.74 7- CDO (Fee for Cooperation and Protection of Rice Production) 1.14 38.55
Total of post-harvest expenses (B) 11.36 194.48
III - Financial expenses III- Financial expenses 4.41
1- Interests 2.18 1- Interests 3.33 47.51
Total of financial expenses
(C ) 2.18 Total of financial expenses (C ) 3.33 51.93 Variable cost (A+B+C=D) 73.71 Variable cost (A+B+C=D) 73.16 1,117.73
Estimated cost of production Weighted average
2010 -2011 Crop
Dry rice Irrigated rice
Discrimination participation Average
(%) Discrimination Average participation (%) Private costs (US$/ hectare) IV - Depreciations IV - Depreciations 1- Depreciation of
improvements/installations 2.46 1- Depreciation of improvements/installations 0.31 6.7
2- Implement depreciation 1.30 2- Implement depreciation 3.49 49.64
3- Machinery depreciation 2.21 3- Machinery depreciation 6.95 94.38
4- Animal depreciation 2.21
Total of depreciation (E) 8.17 Total of depreciation (E) 10.76 150.71
V- Other fixed costs V- Other fixed costs
1- Periodical maintenance of
machines/implementations 1.23 1- Periodical maintenance of machines/implementations 3.74 50.93
2- Social charges 1.02 2- Social charges 0.88 13.39
3- Fixed capital insurance 0.19 3- Fixed capital insurance 0.52 7.16
Total of other fixed costs (F) 2.43 Total of other fixed costs (F) 5.15 71.48
Fixed cost (E+F=G) 10.60 Fixed cost (E+F=G) 15.90 222.19
Operating cost (D+G=H) 84.31 Operating cost (D+G=H) 89.06 1,339.92
VI - Revenue factors VI - Revenue factors
1- Revenue expected on fixed
capital 1.49 1- Revenue expected on fixed capital 4.46 60.73
2- Land 14.20 2- Land - leasing 6.48 112.58
Total of revenue factors (I) 15.69 Total of revenue factors (I) 10.94 173.31
Total cost (H+I=J) 100.00 100.00 1,513.23
Source: Based on data provided by CONAB (2011a).
Table 2. Continuation.
prices in the block and relate them to the prices of other references, such as the Chicago Board of Trade (LUZ, 2011). Based on this rationale, the quote in Chicago Board of Trade was used as a parameter of world prices in this study.
For estimating social costs of tradable in-puts (F) in Brazil, the world prices were consid-ered versus the amount of seeds, fertilizers and chemicals needed for rice growth, according to data provided by CONAB (2011c) and IRGA (2011b), as Table 3 illustrates.
The domestic factors (G) measured at so-cial values were estimated by considering the opportunity costs of the application of the neces-sary structure, evaluated through the total value of resources available in the activity (land, capi-tal and work).
In this study, we have used data provided by CEPAL (2011a, 2011c) related to investments in structure needed for rice production per hect-are of planted hect-area in the state members of Mer-cosur, multiplied by the 2010 inflation rate. For Brazil, the National Consumer Price Index (INPC) was used, as it is estimated by an official govern-mental agency (IBGE, 2010). The consumer price indexes from the other Mercosur countries were made available by the Economic Commission for Latin America (CEPAL, 2011b).
Results and discussion
From the analysis of results estimated for Mercosur countries, as obtained through the use Table 3. Estimation of tradable inputs at social prices in 2010.
Inputs Unit Quantity Unit Price (US$ ) Cost (US$/hectare)
Calcium carbonate t 1,00 28.12 28.12
Rice seed kg 75,00 0.99 74.25
Fungicide 1 (seed treatment) kg 0,14 111.75 15.65
Fungicide 2 (seed treatment) l 0,14 27.21 3.81
Insecticide 1 (seed treatment) l 1,40 26.63 37.29
Fertilizer (maintenance) t 0,40 407.64 163.06 Fertilizer (coverage) t 0,10 378.11 37.81 Herbicide 1 l 3,00 12.79 38.39 Herbicide 2 l 0,80 8.86 7.09 Insecticide 1 l 0,05 23.62 1.18 Insecticide 2 l 0,06 66.01 3.96 Insecticide 3 l 0,50 12.74 6.37 Fungicide 3 l 0,80 29.00 23.20
Total estimated at international prices 440.18
Source: Based on data provided by CONAB (2011b), IRGA (2011) and CEPAL (2011b).
of the Policy Analysis Matrix (PAM), it has been identified that the private result (U$ profit per hectare) was negative for Brazil and Paraguay, thus evidencing the comparative advantage of rice production in Argentina and Uruguay (Table 4).
In Paraguay, rice production is not as sig-nificant (219,800 tons) as in Brazil (12,651,800 tons), and productivity is lower than in Brazil (4.25 ton/ha). Argentina and Uruguay produce 1,334,160 tons and 1,287,200 tons, respectively, and Brazil is the major importer of their produc-tion. In the latter two countries, the average yield is 6.88 tons/hectare and 7.63 tons/ha, respective-ly, according to data of FAO (2011) related to the year 2009; hence, such productivity is far higher than the Brazilian average of 4.41 tons/ha. This difference in productivity significantly influences revenues obtained by these countries. Besides, lower prices were observed in Argentina and Paraguay. In Uruguay, an advantage in domestic costs can be noticed.
Table 4. Policy analysis matrix estimated for rice production in Mercosur. 2010 – present.
Countries Items Revenues (US$/ hectare)
Costs (US$/hectare)
Profit (US$/hectare) Tradable
inputs Domestic factors
Brazil
Private prices in Brazil 1,371.36 435.73 1,077.49 -141.86
Social prices in Brazil 1,864.85 440.18 1,056.35 368.32
Effect of divergences and policy
efficiency in Brazil -493.49 -4.44 21.14 -510.19
Argentina
Private prices in Argentina 2,030.84 397.94 928.53 704.37
Social prices in Argentina 2,914.32 481.51 642.28 1,790.53
Effect of divergences and policy
efficiency in Argentina -883.48 -83.57 286.25 -1,086.16
Paraguay
Private prices in Paraguay 1,232.92 419.87 979.69 -166.64
Social prices in Paraguay 1,799.78 396.18 754.36 649.24
Effect of divergences and policy
efficiency in Paraguay -566.86 23.69 225.32 -815.88
Uruguay
Private prices in Uruguay 2,212.73 379.24 1,154.98 678.51
Social prices in Uruguay 3,230.08 494.99 916.31 1,818.78
Effect of divergences and policy
efficiency in Uruguay -1,017.35 -115.75 238.67 -1,140.27
Lower costs and high productivity of these countries (mainly Uruguay and Argentina) en-able them to offer more competitive prices, thus increasing their exportations to Brazil. This is facilitated by the reduction of entrance tax rates in Brazil due to agreements established by Mercosur. The negative effect of this fact on the Brazilian market is that Brazilian products face competition with products from countries with lower internal tax burdens. The positive effect, however, is that consumers and the processing industry benefit from that, as the offer is broad-ened and prices are lowered.
In the same way, costs lower than the pro-duction factors in Argentina and Uruguay were found in a study carried out by IRGA (2011a). For example, by comparing Brazilian rental costs to Argentinean and Uruguayan ones, it was found that these values are 50 percent lower in Argen-tina and 66 percent lower in Uruguay.
Accord-ing to that study, these advantages and the cost reduction in some important inputs for rice pro-duction have attracted several Brazilian produc-ers to Argentinean and Uruguayan lands.
In this context, the difference of tax bur-den on Argentinean and Uruguayan rice has been one of the factors impacting on costs, thus rendering rice produced in those countries more economically competitive than rice produced in Brazil.
By analyzing Table 4, we can see that, in Brazil, private revenues were lower than social revenues, evidencing that public policies are negatively affecting rice production.
In Brazil, the values of tradable inputs (seeds, fertilizers and chemicals) per hectare of rice (Table 4) are slightly higher than the values practiced in the country. In Argentina and Uru-guay, the difference between social and private
prices was bigger, as prices practiced in those countries are lower than the ones practiced in the world.
In the present scenario, with free trade be-tween markets, it is necessary to consider com-parative advantages, so that the prices of goods, established through the confrontation of supply and demand, can direct the volume and the struc-ture of a range of rice trade flows. In this sense, it is worth remembering Ricardo’s theory, which as early as 1817 put forward the idea that, even if a country did not have absolute advantage in a certain product in the international trade flow, this would be advantageous for countries whose trade partners had different production– this is the case of Brazil, the largest rice producer in Mercosur. However, rethinking public policies that fill the demands of different commercial, governmental and social actors requires a tax evaluation, since excessive taxation may compress the demand and inhibit the country’s production. This is in accor-dance to Rakotoarisoa’s findings (RAKOTOARI-SOA, 2011), which show that while developed countries have strongly subsidized the production and exportation of a number of commodities, including rice, developing countries have exces-sively taxed their producers.
The tax issue is totally related to the public policies evidenced in this study, and the Brazilian tax burden has increased after the 1990’s (OECD, 2011). This is in accordance with Lindblom’s the-ory (LINDBLOM, 1965), which establishes that policies, as well as rules that determine decisions
along the stages of creation and implementation, have a great influence on the generation of con-flicts between the public and the private, since decisions related to public tax policies undergo pressures from several social actors, as it is the case of the tax incurring on rice production in Brazil. The public agent, when required to for-mulate a public policy, evaluates social values, objectives, alternatives and theoretical knowl-edge related to the problem to be solved, in a structuring and rating effort to choose the alter-native that maximizes the results expected.
a) Social and private indicators of competitiveness
The comparison between private and so-cial indicators with the use of PAM is shown in Table 5.
As to the Private Cost Ratio (PCR), the in-dicators found were higher than 1 in Brazil and Paraguay, evidencing that the return rate of do-mestic factors for rice production in these coun-tries is lower than the normal return expected, i.e. under the conditions prevailing in 2010, the activity is not economically profitable, in op-position to the situation found in Argentina and Paraguay.
The Domestic Resource Cost (DRC) is ana-lyzed in a way similar to private profitability, i.e. minimizing DRC is the same as maximizing the social profits. All the DRC estimated were less than 1, indicating production efficiency. Argen-tina and Uruguay presented high production ef-Table 5. PAM indicators for rice production in Mercosur - current cenario (2010).
Brazil Argentina Paraguay Uruguay
Private Cost Ratio - PCR 0.00 0.57 1.2 0.63
Domestic Resource Cost - DRC 0.74 0.26 0.54 0.34
Nominal Protection Coefficient - NPC 0.74 0.7 0.69 0.69
Effective Protection Coefficient - EPC 0.66 0.67 0.58 0.67
Profitability Coefficient - PC -0.39 0.39 -0.26 0.37
ficiency, with positive effects to those countries due to the obtainment of higher net revenues.
Regarding Nominal Protection Coefficients (NPC), they have shown that rice production in the year considered underwent implicit taxa-tions resulting from political actaxa-tions, given that prices are below the international prices in all of the countries. Indicators close to 0.70 point out that the prices received by producers were lower than the ones found in the world market.
Concerning the Effective Protection Co-efficients (EPC), we must explain that they are limited as incentive indicators, as they do not include the effects of policies that influence the domestic prices. This omission means that the results of EPC are interpreted as partial measures of the effects of incentives of policies on the prices of products and tradable inputs. In order to overcome such limitation, the Profitability Co-efficient (PC) is used as a global measure of the net transfers resulting from political intervention. EPC (Table 5) are less than 1, which means that the interventions in the rice production industry by means of public policies are reduced, that is, they indicate non-protection.
The Profitability Coefficient (PC) widens the understanding of EPC, including transfers associated with the policies that affect the utili-zation of domestic factors. An index well lower than 1 (-0.39 for Brazil and -0.26 for Paraguay) means that rice production in these two coun-tries had high net taxation and the private profit decreased. As an effect of this policy, there is
a transfer of revenues from the producers to society.
The indicator Subsidy Ratio to Producers (SRP) allows for comparisons of the subsidy poli-cies related to rice production in the countries stud-ied. The indexes of SRP seen in Table 5 indicate reduced levels of subsidies in all of the countries, particularly in Brazil, which presented an index of -0.27, evidencing disincentives to production.
From social and private indicators, it was possible to compare rice production in the four state members of Mercosur. The results showing greater profitability in Argentina and Uruguay are in accordance with the results found in stud-ies carried out by CONAB (2011c) and IRGA (2011b).
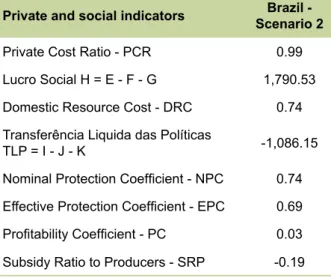
b) Analysis of sensitivity in a simulated scenario with a 10-percent reduction in the Brazilian tax burden
Tables 6 and 7 illustrate the effects of a variation in the direct and indirect tax burden with a 10-percent reduction in Brazil. It is pos-sible to see that, with such a reduction, the prof-itability of Brazilian rice production is practically inexistent, given the prices in effect in the Brazil-ian market in 2010. In this way, profit increase through higher prices and/or yield, as well as the reduction of other production costs, should occur for the private profits in Brazil to become more satisfactory for producers.
The indicator that had the greatest varia-tion in this scenario (Table 7) was precisely the profitability coefficient (PC), which was negative Table 6. Scenario 2 - Simulating the Policy Analysis Matrix estimated for rice production in Brazil with a 10-per-cent reduction in the tax burden.
Countries Items Revenues (US$/
hectare)
Costs (US$/hectare) Profit (US$/ hectare) Tradable
inputs Domestic factors
Brazil – Scenario 2
Private costs with 10-percent tax reduction 1,371.36 392.16 969.74 9.46
Social prices 1,864.85 440.18 1,056.35 368.32
in the situation analyzed (-0.39) and went up to 0.03 in the simulated scenario. This shows a pos-itive result, but it is still very low.
DRC and NPC did not change in this sce-nario, while SRP and EPC had significant varia-tions. SRP presented a reduced level even with the reduction of the percentage of taxes simu-lated in the scenario proposed.
Besides the reduction of taxation of both in-puts and products, other political actions should be taken in order to improve the competitiveness of Brazilian rice, such as higher investments in re-search and development aiming at increasing the crop yield in Brazil, and a more effective trade policy. It is also worth highlighting that both the macroeconomic scenario and the exchange poli-cy have a deep influence on this market.
The Brazilian domestic demand did not absorb the whole 2011 crop (IBGE, 2010), and part of it was destined to the foreign market. Broadening of Brazilian exportations to the Af-rican market, as pointed out in references used in this study (IRGA, 2011b), would have a posi-tive effect on trade of the present and future rice crops, as it would favor the flow of the produc-tion surplus.
Therefore, increased importation of rice from Mercosur countries will cause a production surplus in Brazil and, consequently, it will reduce prices in the Brazilian market.
Conclusion
The profitability of Brazilian rice produc-tion in comparison to other Mercosur countries is rather influenced by the direct and indirect tax burden. In this sense, Brazil is in a disad-vantageous position, since its tax system is more complex and its tax burden is higher than the other Mercosur members’. In order to have an equal tax incidence on the costs of rice produc-tion, there should be a reduction of the taxes that could impact on rice production in Brazil, as the production is much more competitive in Argen-tina and Uruguay. It is also worth emphasizing that a heavy indirect tax burden on Brazilian ag-riculture and cattle raising has important effects on the allocative efficiency of rice produced in Brazil.
The main effect of this tax policy is the gen-eration of distortions in the Brazilian rice produc-tion chain. According to data found in this study concerning the tax burden on rice production in Brazil, such a burden represents almost 25 per-cent of the production cost. Hence, for Brazil it is more advantageous to import rice from Mer-cosur countries, and this causes excess supply.
Estimates simulated with the alternative scenario (Scenario 2) have shown that the effects of high taxation on rice production in Brazil have negatively affected the country competitiveness in relation to the other Mercosur state members. It has also become evident that rice prices, pro-ductivity and quality are essential in this mar-ket. We suggest that studies addressing effects related to these issues are carried out, once the commodities trade is fundamental to developing countries that depend on exportations to balance both the supply and the demand for agricultural products.
Table 7. Scenario 2 – Analysis of sensitivity of PAM indicators for rice production in Brazil with simulation of a 10-percent tax reduction.
Private and social indicators Scenario 2Brazil -
Private Cost Ratio - PCR 0.99
Lucro Social H = E - F - G 1,790.53
Domestic Resource Cost - DRC 0.74
Transferência Liquida das Políticas
TLP = I - J - K -1,086.15
Nominal Protection Coefficient - NPC 0.74
Effective Protection Coefficient - EPC 0.69
Profitability Coefficient - PC 0.03
In this sense, regarding issues related to the harmonization of tax systems of the state mem-bers, there is a need for more studies to assess the validity of the adoption of Value-Added Tax.
It is a fact that political decision-making is institutionally complex, and decision-makers are strongly influenced by the pressure from inter-est groups in their countries. Furthermore, the way that economy will respond to changes in-duced by new policies depends on the intensity of reforms as well as of the market structure and functioning.
References
ADESINA, A. A.; COULIBALY, O. N. Policy and competitiveness of agroforestry-based technologies for maize production in Cameroon: an application of Policy Analysis Matrix. Agricultural Economics, v. 19, n. 1/2, p. 1-13, Sept. 1998.
ASOCIACIÓN CULTIVADORES DE ARROZ. Datos
estadísticos. 2011a. Disponível em: <http://www.aca.
com.uy/>. Acesso em: 3 ago 2011.
ASOCIACIÓN CULTIVADORES DE ARROZ. Los ingresos
y los costos de la producción de arroz en el Mercosur.
2011b. Disponível em: <http://www.aca.com.uy/>. Acesso em: 4 ago. 2011.
ATKINSON, A. B. Optimal taxation and the direct versus indirect tax controversy. Canadian Journal of Economics, v. 10, n. 4, p. 590-606, nov. 1977.
BRASIL. Ministério da Fazenda. Secretaria de Política Econômica. Evolução da carga tributária bruta
1990-2009. 2010. Disponível em: <http://www.fazenda.gov.
br/spe/publicacoes/conjuntura/bancodeslides/CTB%20 2009%20Final.pdf>. Acesso em: 10 ago. 2011. BRASIL. Ministério do Desenvolvimento, Indústria e Comércio Exterior. AliceWeb: Sistema de Análise das Informações de Comércio Exterior. 2011. Disponível em: <http://aliceweb2.mdic.gov.br/>. Acesso em: 9 set. 2011. CASAMATTA , G.; RAUSSER, G.; SIMON, L. Optimal taxation with joint production of agriculture and rural amenities. Resource and Energy Economics, v. 33, n. 3, p. 544-553, Sept. 2011.
CEPAL. Comisión Económica para América Latina.
Anuario Estadístico de América Latina y el Caribe 2010.
2011a. Disponível em: <http://www.eclac.cl/cgi-bin/ getProd.asp?xml=/publicaciones/xml/6/42166/P42166. xml&xsl=/deype/tpl/p9f.xsl>. Acesso em: 19 ago. 2011.
CEPAL. Comisión Económica para América Latina.
Estadísticas e indicadores económicos 2010. 2011b.
Disponível em: <http://www.eclac.cl/>. Acesso em: 13 ago. 2011.
CEPAL. Comisión Económica para América Latina.
Estudio económico de América Latina y el Caribe 2009-2010. 2011c. Disponível em: <http://www.eclac.org/>.
Acesso em: 21 ago. 2011.
CME GROUP. Rice historical volatility. 2011. Disponível em: < http://www.cmegroup.com/>. Acesso em: 12 ago. 2011.
CONAB. Companhia Nacional de Abastecimento. Custo
estimado da produção de arroz 2009/2010. 2011a.
Disponível em: <http://www.conab.gov.br/>. Acesso em: 2 ago. 2011.
CONAB. Companhia Nacional de Abastecimento.
Estudos de prospecção de mercado agrícola 2010/2011.
2011b. Disponível em: <http://www.conab.gov.br/>. Acesso em: 24 ago. 2011.
CONAB. Companhia Nacional de Abastecimento. Índices e insumos agrícolas. 2011c. Disponível em: <http://www. conab.gov.br/conteudos. php?a=550&t=>. Acesso em: 7 ago. 2011.
EMATER-RS. Empresa de Assistência Técnica e Extensão Rural do Rio Grande do Sul. Informativo conjuntural: análise dos preços semanais recebidos pelos produtores no Brasil, nos anos de 2005-2010. Porto Alegre, 2011. EMBRAPA ARROZ E FEIJÃO. Embrapa Arroz e Feijão
[home page]. 2011. Disponível em: <http://www.cnpaf.
embrapa.br>. Acesso em: 21 ago. 2011. FANG, C.; BEGHIN, J. C. Food self-sufficiency,
comparative advantage, and agricultural trade: a policy
analysis matrix for Chinese agriculture. Ames: Iowa State University, 2000. (Working Paper 99-WP 223).
FAO. Food and Agriculture Organzation. Faostat: value of agricultural production. 2011. Disponível em: <http:// faostat.fao.org/site/339/default.aspx >. Acesso em: 12 ago. 2011.
FARSUL. Federação da Agricultura do Estado do Rio Grande do Sul. Relatório da cadeia produtiva do arroz
do RS. 2011. Disponível em: <http://www.farsul.org.br>.
Acesso em: 7 ago. 2011.
FIESP. Federação das Indústrias do Estado de São Paulo.
A carga tributária no Brasil: repercursões na indústria de
transformação. São Paulo, 2010. (Decomtec. Panorama da carga tributária).
FONDO MONETARIO INTERNACIONAL. Perspectivas
económicas: las Américas. Washington, D.C., 2006.
Disponível em: <http://www.imf.org/external/pubs/ft/ REO/2006/esl/02/wreo_s.pdf> . Acesso em: 28 Ago. 2011.
IBGE. Instituto Brasileiro de Geografia e Estatística. Banco
de dados. 2010. Disponível em: <http://www.ibge.gov.
br/>. Acesso em: 24 ago. 2011.
IBPT. Instituto Brasileiro de Planejamento Tributário.
Carga tributária brasileira. 2011. Disponível em: <http://
www.ibpt.com.br/img/uploads/novelty/estudo/60/ CargaTributariaBrasileiraCresce5EmUmaDecada.pdf >. Acesso em: 26 ago. 2011.
IRGA. Instituto Rio Grandense do Arroz. Informações
sobre o mercado do arroz. 2011a. Disponível em: <http://
www.irga.rs.gov.br/index.php?principal=1&secao=999& id=121>. Acesso em: 5 maio 2011.
IRGA. Instituto Rio Grandense do Arroz. O mercado
mundial, o comércio de arroz no Mercosul e na carga tributária da cadeia do arroz. 2011b. Disponível em:
<http://www.irga.rs.gov.br/>. Acesso em: 10 ago. 2011. LINDBLOM, C. E. The intelligence of democracy: decision making through mutual adjustment. New York: Free Press, 1965. 352 p.
LUZ, A. Internacionalização do arroz latino-americano. Planeta Arroz, v. 10, n. 37, p. 26-27, fev. 2011.
MARTINS, I. G. da S. A integração do Mercosul através do imposto do valor agregado. Revista Fórum de
Direito Tributário, Belo Horizonte, v. 2, n. 11, set.
2004. Disponível em: <http://bdjur.stj.jus.br/dspace/ handle/2011/42147>. Acesso em: 7 out. 2011.
MERCOSUR. Mercado Común del Sur. Indicadores del
Mercosur. 2011. Disponível em: <http://www.mercosur.
int/>. Acesso em: 28 jul. 2011.
MONKE, E. A.; PEARSON, S. R. The Policy Analysis
Matrix for agricultural development. New York: Cornell
University, 1989. 279 p.
NELSON, G. C.; PANGGABEAN, M. The costs of Indonesian sugar policy: a Policy Analysis Matrix approach. American Journal of Agricultural Economics, v.73, n. 3, p.703-712, Aug. 1991.
OECD. Organisation for Economic Co-Operation and Development. Stat extracts. 2011. Disponível em: <http:// stats.oecd.org/>. Acesso em: 9 set. 2011.
PARAGUAY. Ministerio de Agricultura y Ganadería. Dirección de Censos y Estadísticas Agropecuarias. Sintesís
Estadística. 2011. Disponível em: <http://www.mag.
gov.py/index-censo.php?pag=sintesis-estadistica.html>. Acesso em: 9 ago. 2011.
PEARSON, S.; MONKE, E.; ARGWINGS-KODHEK, G.; AVILLEZ, F.; MUKUMBU, M.; PAGIOLA, S.; SELLEN, D.; WINTER-NELSON, A. Agricultural policy in Kenya: applications of the Policy Analysis Matrix. Ithaca: Cornell University, 1995. 300 p.
RAKOTOARISOA, M. A. The impact of agricultural policy distortions on the productivity gap: evidence from rice production. Food Policy, v. 36, n.2, p. 147-157, Apr. 2011.
RICARDO, D. On the principles of political economy
and taxation. 3rd ed. London: John Murray, 1817.
Disponível em: <http://www.econlib.org/library/Ricardo/ ricP.html>. Acesso em: 9 jul. 2011.
SIIA. Sistema Integrado de Información Agropecuaria.
Producción Agrícola, Argentina. 2010. Disponível em:
<http://www.siia.gov.ar/>. Acesso em: 7 ago. 2011.
SIMON, H. A. Administrative behavior. 2nd ed. New
York: Free, 1957. Disponível em: <http://findebookee. com/h/herbert-simon-administrative-behavior>. Acesso em: 21 Jul. 2011.
USDA. United States Department of Agriculture.
Economic Research Service. 2011. Disponível em:
<http://www.ers.usda.gov/>. Acesso em: 26 Aug. 2011. YAO, S. J. Rice production in Thailand seen through a Policy Analysis Matrix. Food Policy, v. 22, n. 6, p. 547-560, Dec. 1997.