Genetic variability in Pseudoplatystoma reticulatum from a breeding
program in Brazil
1Variabilidade genética de Pseudoplatystoma reticulatum de um programa de
melhoramento genético no Brasil
Daniele Menezes Albuquerque2*, Carlos Antonio Lopes de Oliveira3, Maria Del Pilar Rodriguez Rodriguez4, and
Ricardo Pereira Ribeiro3
ABSTRACT - The aim of this study was to characterise genetic variability in five groups of Pseudoplatystoma reticulatum:
Mato Grosso I (MT-I), Mato Grosso II (MT-II), Mato Grosso III (MT-III), Mato Grosso do Sul I (MS-I) and Mato Grosso do Sul II (MS-II), taken from a centre for genetic improvement. In order to determine the allelic frequency, observed heterozygosity (HO), inbreeding coefficients (FIS), Hardy-Weinberg equilibrium (HW-p) and genetic differentiation, eight polymorphic microsatellite loci (Pcor01, Pcor05, Pcor08, Pcor10, Ppu01, Ppu04, Ppu09 and Ppu10) were selected, in which a total of 62 alleles were observed in the individuals (n = 211). The MS-I population had the highest (Pcor08 allele 83: 0.5000) and lowest (Pcor10 allele 50: 0.1667) mean values for allele frequency. Higher (HO = 0.782; 0.782) and lower (FIS = 0.034; 0.061) values were found in groups MS-I and MT-III respectively. The HW-p showed that the five groups presented deviations for most of the loci under analysis. Finally, genetic differentiation pointed to the formation of two large genetic groups, one formed by the groups from Mato Grosso and the other by the groups from Mato Grosso do Sul. These measurements can help selection in a breeding program and maintain genetic variability.
Key words: Cachara. Inbreeding coefficient. Allelic Frequency. Population genetics. Microsatellites.
RESUMO - Objetivou-se caracterizar a variabilidade genética de cinco grupos de Pseudoplatystoma reticulatum Mato
Grosso I (MT-I), Mato Grosso II (MT-II), Mato Grosso III (MT-III), Mato Grosso do Sul I (MS-I) e Mato Grosso do Sul II (MS-II) pertencentes a um núcleo de melhoramento genético. Para determinação das medidas de frequências alélicas, heterozigosidade observada (HO), coeficientes de endogamia (FIS), teste do equilíbrio de Hardy-Weinberg (HW-p) e diferenciação genética foram selecionados oito loci polimórficos de microssatélites (Pcor01, Pcor05, Pcor08, Pcor10,
Ppu01, Ppu04, Ppu09, pu10) nos quais observaram-se um total de 62 alelos nos indivíduos (n=211). A População MS-I
apresentou o maior (Pcor08 alelo 83:0,5000) e menor (Pcor10 alelo 50: 0,1667) valor de frequência alélica média. Maiores (HO= 0,782; 0,782) e menores (FIS= 0,034; 0,061) foram verificados nos grupos MS-I e MT-III respectivamente e o HW-p exibiu que os cinco grupos apresentaram desvios para a maioria dos loci analisados. Por último, diferenciação genética apontou a formação de dois grandes grupos genéticos, um conformado pelos grupos provenientes do Mato grosso e outro pelos grupos do Mato grosso do Sul. Essas medidas podem auxiliar na seleção do programa de melhoramento, permitindo a manutenção da variabilidade genética.
Palavras-chave: Cachara. Coeficiente de endogamia. Frequência alélica. Genética de populações. Microssatélites.
DOI: 10.5935/1806-6690.20200007 *Author for correspondence
Received for publication 04/02/2016; approved on 05/08/2019
1Parte da Tese de Doutorado do primeiro autor apresentada ao programa de Pós-Graduação em Zootecnia da Universidade Estadual de Maringá/UEM 2Faculdade de Ciências Agrárias/FCA, Universidade Federal da Grande Dourados/UFGD, Rodovia Dourados - Itahum, km 12, Dourados-MS, Brasil,
[email protected] (ORCID ID 0000-0002-6952-9901)
3Departamento de Zootecnia/DZO, Universidade Estadual de Maringá/UEM, Maringá-PR, Brasil, [email protected] (ORCID ID
0000-0003-2504-3261), [email protected] (ORCID ID 0000-0001-7752-3692)
4Departamento de Zootecnia/DZO, Universidade Federal dos Vales do Jequitinhonha e Mucuri/UFVJM, Diamantina-MG, Brasil, [email protected]
INTRODUCTION
Aquaculture is the agricultural food chain with the greatest global presence among production sectors of animal origin, totalling 722,560 tons in Brazil in 2019. However, one area of research that requires further advance and consolidation in order to meet domestic demand is the area of genetic improvement of aquaculture production.
As a result, in 2008, the Aquabrasil Program (A Technological Base for the Sustainable Development of Aquaculture in Brazil), coordinated by Embrapa in partnership with the State University of Maringá, began unprecedented genetic improvement of the native species Pseudplatystoma reticulatum, in order to promote technological advancement and boost aquaculture production, and consolidate and foster the regional and export markets (ALBUQUERQUE; PEREIRA; RODRIGUEZ-RODRIGUEZ, 2019).
Pseudoplatystoma reticulatum, known locally as surubim cachara, is a catfish native to the Paraná-Paraguay
basin and the central Amazon region (CREPALDI et al., 2006). Its feeding preference is carnivorous, and it comes at the top of the food chain in various aquatic habitats of South America’s most important river basins (REID, 1983).
The aquaculture breeding project included wild pairs of P. reticulatum collected over four years (2008 to 2011) from breeding stations on three properties in the state of Mato Grosso and two in the state of Mato Grosso do Sul, with the aim of forming approximately 72 families through artificially induced spawning. The families from the five properties were housed on another property linked to the Aquabrasil research project, located in the municipality of Sorriso, in Mato Grosso, in the district of Primavera do Norte.
A microchip (Passive Integrated Transponder -PIT tag) was implanted in each individual, facilitating identification when obtaining zootechnical information of commercial interest, as well as making possible random rather than directed mating.
Conserving the genetic variability of the groups that make up the cachara breeding program is of paramount importance to avoid high levels of inbreeding during the formation of succeeding generations and to allow genetic gains as selections are made. Microsatellite molecular markers are a commonly used tool for monitoring the genetic variability of populations (GUICHOUX et al., 2011), as they allow the values of such parameters as the inbreeding coefficient, heterozygosity, allelic frequency and deviations in the Hardy-Weinberg equilibrium to be estimated, among other analyses which help to increase
efficiency in defining strategies for the selection of new crosses in breeding programs.
The aim of the present study is to estimate the genetic variability of five groups of P. reticulatum from the satellite centre of the aquaculture breeding program in Brazil.
MATERIAL AND METHODS
A total of 211 caudal-fin samples, each approximately 0.5 cm2, were collected and stored in
absolute alcohol for further analysis at the Laboratory for Molecular Biology of the State University of Maringá. To identify the origin of each sample, five groups were formed: Mato Grosso I (MT-I), Mato Grosso II (MT-II), Mato Grosso III (MT-III), Mato Grosso do Sul I (MS-I) and Mato Grosso do Sul II (MS-II).
The methodology described by Lopera-Barrero
et al. (2008) was used to extract the DNA, where to
each fin sample were added 550 µL of lysis buffer (50 mM Tris-HCl, 50 mM EDTA, 100 mM NaCl, 1% SDS) and 10 µL proteinase K (200 µg mL-1). The samples were then
incubated in a double boiler at 50 °C for 12 h. The DNA was precipitated with 600 µl of 5M NaCl solution and centrifuged for 10 min at 12,000 rpm. The supernatant with DNA was transferred to new microtubes, precipitated with 700 µL absolute ethyl alcohol and incubated for 1 h at -20 °C. Following centrifugation, the DNA was washed with 700 µL 70% ethyl alcohol and resuspended in TE buffer - 10 mM Tris pH 8.0 and 1 mM EDTA (80 µL for the fin), sequentially treated with 7 µL RNase (30 µg mL-1) in a double boiler at 37 °C for 1 h
and stored in a freezer at -20 °C.
DNA quantification was carried using the Shimadzu UV 1601-E.U. spectrophotometer (wavelength 260 nm), and the samples diluted to a concentration of 10 ng µL-1. DNA integrity was verified
by horizontal electrophoresis using 1% agarose gel at 70 V for 120 min.
Image capture employed the L-PIX (LOCCUS Biotechnology) photographic system. Different DNA annealing temperatures were tested for the primers (Loci
Ppu01, Ppu02, Ppu04, Ppu09, Ppu10, Ppu15, Pcor01, Pcor05, Pcor08, Pcor10) described by Revaldaves et al.
(2005) and Saulo-Machado et al. (2011) for P. corruscans (Pcor) and P. punctifer (Ppu) respectively. The DNA was amplified to a total reaction volume of 11 µL using 8.1 µL Platinum® PCR SuperMix (Life Technologies,
Invitrogen, Carlsbad, CA, USA), 0.9 µL of a solution containing the forward and reverse primers, and 2.0 µL of target DNA.
PCR was carried out under the following conditions: 2 min denaturation at 95 °C, 30 cycles of 2 min at 95 °C, 30 s at specific annealing temperatures for each primer (Table 1), 30 s at 72 °C and a final extension at 72 °C for 10 min. The DNA samples were then submersed in 10% polycrylamide gel (acrimylamide: bisacrylamide - 29:1) and 6 M urea, and placed in a 1X TBE (90 mM Tris-Borate, 2 mM EDTA) buffer solution at 180 V (250 mA) for between 5 and 12 h, depending on the fragment size of the primer alleles.
The microsatellite alleles were visualised using the methodology adapted by Bassam, Caetano-Anollés and Gresshoff (1991). The gel was submersed in three solutions: fixative solution (10% ethanol, 0.5% acetic acid) for 15 min, impregnation solution (6mM silver nitrate) for 30 min, and finally developer solution 0.75 M NaOh 0.22% and formaldehyde 40%. The gel images were captured with the SONY DSC HX200 digital camera. Allele size was calculated using the 100 bp and 50 bp molecular-weight marker (DNA ladder - Invitrogen®).
The number of alleles, observed heterozygosity (Ho), expected heterozygosity (He), Shannon index and Hardy-Weinberg equilibrium (HW-p) were calculated using the PopGene 1.31 software (YEH; BOYLE; XIYAN, 1999).
The allelic frequency and inbreeding coefficient (FIS) for each locus was calculated using the GenePop 1.2 software (RAYMOND; ROUSSET, 1995). Linkage disequilibrium, genetic differentiation and analysis of molecular variance (AMOVA) were determined with the Harlequin 3.1 software (EXCOFFIER; SCHNEIDER, 2005) using the Markov chain method. To demonstrate the presence of null alleles, the Micro-checker 2.2.3 software was used (VAN OOSTERTER et al., 2004).
RESULTS AND DISCUSSION
Of the 11 primers tested in the five groups under study, eight (Pcor01, Pcor05, Pcor08, Pcor10, Ppu01,
Ppu04, Ppu09 and Ppu10) were polymorphic, and three
did not amplify (Ppu02, Ppu13 and Ppu15) or were monomorphic. This might be due to genetic differentiation between the species; for even when primers are from related species (heterologous primers), as in the case of
P. corruscans and P. punctifer used in the analysis of P. reticulatum, and show some degree of conservation,
differences can be found in the molecular weights of the alleles or in the non-amplification of some loci (ABREU
et al., 2009).
Comparing various studies, such as that of Saulo-Machado et al. (2011) for P. punctifer in the Amazon
basin, different sizes are found for the alleles of the Ppu01,
Ppu04, Ppu09 and Ppu10 primers. In addition, the Ppu02, Ppu13 and Ppu15 primers presented as polymorphic, with
from 7 to 18 alleles, and did not amplify for the five groups of P. reticulatum. However, Abreu et al. (2009), studying two groups of wild P. reticulatum, and using P. corruscans heterologous primers, found a different number of alleles in the Pcor01, Pcor05, Pcor08 and Pcor10 primers to those seen in this research.
Low values for allelic frequency were found in the Pcor01 loci for the MT-II population, with 0.0926 and 0.0741 respectively for sizes 110 and 160 bp. In the MT-I population, a low allelic frequency was seen in the
Pcor05 primers for 85 bp; Pcor08 for 87, 97, 109 and
118 bp; Ppu04 for 155, 175, 195, 215 and 235 bp; Ppu09 for 170, 220, 250 and 260 bp; and Ppu10 for 120 and 150 bp (Table 1).
It can be seen that the MT-II population had a low allelic frequency only for the Ppu09 and Ppu10 loci, seen in the 110 bp fragment at a minimum frequency of 0.02.
There was an alteration in all the loci in relation to the most frequent allele in the groups, where more than two altered alleles per loci can be seen (Table 1). The allelic frequency in the MS-I population ranged from 0.0179 to 0.500 respectively for Ppu09/266 and Pcor08 in fragment 83. In the MT-III population, a low frequency was seen in Pcor01/110/150/85 and 90, Pcor05/110; Pcor08/85 /87/90/92/106/109/118; Pcor10/62/70; Ppu01/95/155; Ppu04/120/155/160/205/215/255; Pu09/170/260; and Ppu10/94/110/120/140 and 160.
Analysing the data shown in Table 1, null alleles were seen in the Pcor05 loci in all groups, Pcor10 in MT-II, MT-III and MS-MT-II, Ppu04 in groups MT-III and MS-MT-II, and Ppu10 in MT-III only. The occurrence of null alleles is mainly due to the lack of a sequence for primer annealing, which in turn may be due to point mutations (DUFRESNE
et al., 2014) and, as reported by Kordicheva et al. (2010),
the presence of null alleles resulting from genotyping errors is a very common phenomenon when analysing microsatellite molecular markers.
Only null alleles were seen in the Pcor05 loci from a total of 16 samples from the MT-I population under analysis. The observed heterozygosity ranged from 0.267 for Pcor08 to 1.00 for the Ppu04 loci, which had a total mean value of 0.684 (Table 2).
A significant difference was found in the Hardy-Weinberg equilibrium for this population only in Pcor05 and Pcor10, where the respective FIS values of 0.6601 and 0.354 revealed a heterozygote deficiency. Positive results for FIS may indicate a possible heterozygote deficiency, which in turn is attributed to the breeding program.
Loci Ta (°C) Group Frequent alleles Allelic frequency Exclusive alleles Pcor01 55 MT-I 160 0.1875* -MT-II 125 0.3519* -MS-I 125 0.4583* -MT-III 140 0.4355* -MS-II 125 0.3929* -Pcor05 56 MT-I 100 0.3333* -MT-II 100 0.4524* -MS-I 95 0.3333* -MT-III 100 0.4052* -MS-II 95 0.2891* -Pcor08 56 MT-I 94 0.2667* -MT-II 83 0.2857* -MS-I 83 0.5000* -MT-III 94 0.193* -MS-II 83 0.175* -Pcor10 58 MT-I 50 0.4286* -MT-II 50 0.3500* -MS-I 50/55 0.1667/0.4444 -MT-III 50 0.3667* 62 MS-II 60 0.3452* 40 Ppu01 58 MT-I 105 0.4062* -MT-II 120 0.4167* -MS-I 105 0.3621* -MT-III 120 0.3729* 155 MS-II 105 0.2958* -Ppu04 50 MT-I 180 0.2857* -MT-II 175 0.2333* -MS-I 165 0.2857* 295 MT-III 180 0.275* 120-201 MS-II 165 0.1887* 153 Ppu09 59 MT-I 210/230 0.1923*/0.1923* 250 MT-II 230 0.25* -MS-I 220 0.25* 266 MT-III 210 0.2300* -MS-II 230 0.3017* -Ppu10 60 MT-I 100 0.300* -MT-II 100 0.2600* -MS-I 130/140 0.1852*/0.1852* -MT-III 100 0.2951* -MS-II 100 0.2574*
-Table 1 - Allelic frequency and annealing temperatures (ºC) in cachara (Pseudoplatystoma reticulatum) from the aquaculture breeding
project
Group Loci
Pcor01 Pcor05 Pcor08 Pcor10 Ppu01 Ppu04 Ppu09 Ppu10 Meana
MT-I (n = 16) NA 5 6 9 4 4 8 9 6 6.375 NE 4.163 4.639 6.250 2.970 3.436 5.765 7.192 4.639 4.882 AN no yes no no no no no no -Ho 0.813 0.267 0.667 0.429 0.875 1 0.692 0.733 0.684 He 0.784 0.812 0.869 0.714 0.732 0.890 0.895 0.812 0.813 FIS -0.069 0.660 0.206 0.354 -0.234 -0.21 0.196 0.065 0.121 HW-p 0.051ns 0.000** 0.000** 0.0195* 0.401ns 0.952ns 0.271ns 0.391ns -MT-II (n = 27) NA 5 5 10 4 4 6 8 7 6.125 NE 3.898 3.291 5.378 3.509 3.398 5.556 5.661 5.411 4.513 AN no yes no yes no no no no -Ho 0.704 0.429 0.714 0.3 0.708 0.667 0.864 0.760 0.643 He 0.758 0.713 0.834 0.753 0.721 0.849 0.843 0.832 0.788 FIS 0.054 0.384 0.123 0.580 -0.004 0.187 -0.049 0.068 0.168 HW-p 0.885ns 0.000** 0.310ns 0.000** 0.408ns 0.298ns 0.411ns 0.202ns -MS-I (n = 30) NA 4 7 8 4 4 10 8 8 6.625 NE 3.032 4.861 3.419 3.177 3.649 6.438 5.723 6.813 4.639 AN no yes no no no no no no -Ho 0.708 0.542 0.857 0.444 0.862 0.762 0.960 0.741 0.735 He 0.684 0.811 0.725 0.726 0.739 0.865 0.840 0.869 0.782 FIS -0.057 0.318 -0.212 0.351 -0.188 0.098 -0.169 0.132 0.034 HW-p 0.006** 0.000** 0.111ns 0.227ns 0.495ns 0.126ns 0.282ns 0.004** -MT-III (n = 65) NA 5 6 10 5 5 10 8 9 7.25 NE 3.360 3.907 7.944 3.352 3.375 5.203 6.596 5.851 4.948
AN no yes no yes no yes no yes
-Ho 0.871 0.586 0.860 0.500 0.780 0.675 0.860 0.689 0.728 He 0.708 0.751 0.882 0.714 0.710 0.818 0.857 0.836 0.784 FIS -0.240 0.212 0.017 0.287 -0.108 0.164 -0.014 0.170 0.061 HW-p 0.076ns 0.030* 0.002** 0.049* 0.767ns 0.000** 0.092ns 0.000** -MS-II (n = 73) NA 5 7 11 5 4 11 7 8 7.25 NE 3.115 5.029 7.775 3.781 3.810 7.879 4.962 5.853 5.276
AN no yes no yes no yes no no
-Ho 0.700 0.438 0.817 0.333 0.817 0.755 0.845 0.750 0.682
He 0.684 0.808 0.879 0.744 0.743 0.881 0.805 0.835 0.797
FIS -0.031 0.454 0.063 0.547 -0.108 0.136 -0.058 0.096 0.137
HW-p 0.629ns 0.000** 0.073ns 0.000** 0.267ns 0.001** 0.007** 0.002**
-Table 2 - Summarised data for the five groups of Pseudoplatystoma reticulatum from the aquaculture breeding project
ns: Not significant; *: Significant (P<0.05); **: Significant (P<0.01); N: Number of individuals analysed; NA: Number of alleles; NE: Effective number of alleles; NA: Null Alleles; Ho: Observed heterozygosity; He: Expected heterozygosity; FIS: Inbreeding coefficient; HW-p: Hardy-Weinberg equilibrium; MT-I: Mato Grosso I; MT-II: Mato Grosso II; MT-III: Mato Grosso III; MS-I: Mato Grosso do Sul I; MS-II: Mato Grosso do Sul II
As the families that make up the groups of
Pseudoplatystoma reticulatum from the breeding
program originated in approximately 72 families taken from five distinct regions of the Midwest, the number of families in this generation may have interfered with the parameters of genetic variability. However, it should be noted that even in natural wild stock the genetic variability of Pseudoplatystoma reticulatum can be affected by various attributes, such as geographical barriers or different population structures, as mentioned by Abreu et al. (2009) who, studying two groups of
Pseudoplatystoma reticulatum in the Paraguay basin,
supported this hypothesis.
Considering the values obtained for genetic variability in the study in question, the method of selection used in this project, based on hierarchical mating, pedigree, animal heritability, selection and crossbreeding on the basis of the genetic values of the families in the program (RIBEIRO; LEGAT , 2008) was sufficient for the maintenance and continuity of the aquaculture breeding program.
However, inbreeding in captive stock is generally to be expected, and can be controlled in advance if animals are initially correctly selected as breeding stock (LOPERA-BARRERO et al., 2013) so that the problem does not damage breeding programs from the outset (HILSDORF; ORFÃO, 2011). If not, it can favour the bottleneck effect and the effective size of the population, as also pointed out by Lind et al. (2012), Lopera-Barrero
et al. (2010) and Ribeiro et al. (2016).
In animals from the MT-II population, a mean value of 0.643 was seen for observed heterozygosity, with a significant difference (P<0.01) in the Hardy-Weinberg equilibrium in the Pcor05 and Pcor10 loci; a heterozygote deficiency was only seen in these loci for a mean FIS value of 0.168 for all loci. Analysing the population from the MS-I property, a total of 30 samples were found with a mean number of alleles of 6.625, ranging from four to ten alleles (Table 3). No null alleles were found at most of the loci under analysis. There was a significant difference in the Hardy-Weinberg equilibrium in the Pcor01, Pcor05 and Ppu10 loci only, showing an excess of heterozygotes in Pcor01, with a value of -0.057.
The mean value for observed heterozygotes was 0.735, with a minimum variation of 0.444 and a maximum of 0.964 respectively for Pcor10 and Ppu09.
In the MT-III group, for a total of 65 samples, significant differences (P<0.05) were seen in the
Pcor05, Pcor08, Pcor10, Ppu04 and Ppu10 loci, with a
heterozygote deficiency revealed by positive values for
FIS that ranged from a minimum of 0.017 to a maximum of 0.287.
For a mean total of 7.25 alleles analysed in the MS-II population, an allelic deficiency with respective values of 0.4539, 0.5468, 0.1356 and 0.0955 was seen in the Pcor05, Pcor10, Ppu04 and Ppu10 loci. The deviation in the Hardy-Weinberg equilibrium (HW-p) in the five groups of the above experiment can be attributed to various factors, among which heterozygote deficiency is important, a result of the interaction of several factors, such as the high number of alleles per locus, the presence of null alleles, inbreeding and the Wahlund effect (POVH et al., 2010; RODRIGUEZ-RODRIGUEZ
et al., 2013).
From the results shown in Table 3, in which ten groups are defined and analysed against each other through an analysis of molecular variance (AMOVA), it can be seen that for the group comprising the five subgroups, there was greater variability within the groups than between the groups, with values for percent variance of 98.53% (FST = 0.0147), which yielded 1.47% at a significance level of P<0.000001.
Genetic differentiation in fish is commonly seen, but with low values for FST, due possibly to the large abundance of such stock in natural environments that generally have high cosmopolitanism and a priori no barriers to gene flow, as explained by several authors (MELO et al., 2013; SANCHES et al., 2012).
For each combination of the groups under analysis, greater genetic variability was also seen within the groups than between groups, where the percent variance in values was greater than 96.02% (Table 3).
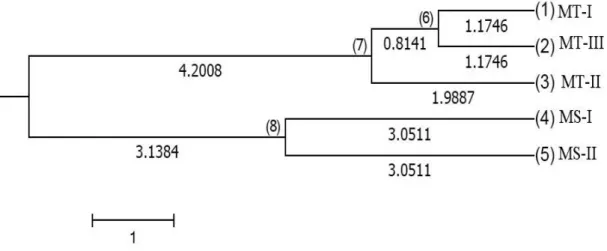
Based on Nei’s calculation (1973), the results obtained for identity and genetic distance infer that there is strong evidence of the existence of groups, within which the groups are genetically more related. As such, it is possible to envisage a subdivision of the animals in groups MT-I and MT-III, a subdivision of group MT-II only, and one subdivision including groups MS-I and MS-II. Genetic identity for the groups in the MT-I/MT-III subdivision was 0.9768, with a small genetic distance of 0.0235. At the same time, the genetic groups of the MS-I/MS-II subdivision have a genetic identity of 0.9408 and a moderate genetic distance of 0.0610. The greatest divergence for all groups, of 0.1936, was seen between the animals from the MT-III and MS-I population.
These results can also be corroborated from the values for genetic distance (Table 3) and confirmed by the group dendogram (Figure 1). A minimum genetic distance of 0.0235 was found in group II (MT-I x MS-I) and a maximum of 0.1936 in group VIII (MS-I x MT-III).
Table 3 - Analysis of molecular variance (AMOVA), genetic distance (GD) and FST of individuals from the five groups of the aquaculture breeding project
Source of variation Degree of freedom Sum of squares Variance component Percent variance FST GD All groups
Between groups 4 24.883 0.04727 1.46992*
0.0147
Within groups 417 1056.739 3.16858 98.53008
Total 421 1081.623 3.21585 100
Group I: MT-I x MT-II
Between groups 1 0.642 0.00642 1.65
0.01646 0.0437
Within groups 84 32.23 0.38369 98.35
Total 85 32.872 0.39012 100
Group II: MT-I x MS-I
Between groups 1 0.339 -0.00032 -0.09
-0.0009 0.1315
Within groups 90 31.6994 0.35215 100.09
Total 91 32.033 0.35183 100
Group III: MT-I x MT-III
Between groups 1 0.299 -0.00071 -0.21
-0.0021 0.0235
Within groups 160 53.695 0.33559 100.21
Total 161 53.994 0.33488 100
Group IV: MT-I x MS-II
Between groups 1 1.24 0.01064 1.54
0.01536 0.0819
Within groups 176 120.007 0.68186 98.46
Total 177 121.247 0.6925 100
Group V: MT-II x MS-I
Between groups 1 7.211 0.09037 2.79352*
0.02794 0.1575
Within groups 112 267.773 3.14456 97.20648
Total 113 274.984 3.23493 100
Group VI: MT-II x MT-III
Between groups 1 0.833 0.00648 1.88*
0.01879 0.0359
Within groups 182 61.613 0.33853 98.12
Total 183 62.446 0.34501 100
Group VII: MT-II x MS-II
Between groups 1 0.659 -0.00008 -0.01
-0.0001 0.0866
Within groups 198 131.636 0.66483 100.01
Total 199 132.295 0.66475 100
Group VIII: MS-I x MT-III
Between groups 1 11.604 0.12989 3.97451*
0.03975 0.1936
Within groups 188 465.505 3.13819 96.02549
Total 189 477.505 3.26808 100
Group IX: MS-I x MS-II
Between groups 1 0.743 0.00462 1.31
0.01306 0.061
Within groups 204 71.282 0.34942 98.69
Figure 1 - Dendogram of the five groups under analysis from the aquaculture breeding project
Group X: MT-III x MS-II
Between groups 1 1.031 0.00519 1.6*
0.01605 0.0917
Within groups 274 87.114 0.31793 98.4
Total 275 88.145 0.32312 100
Continuation Table 3
FST: fixation index; AMOVA: Analysis of Molecular Variance; *: Significant (P<0.05); MT-I: Mato Grosso I; MT-II: Mato Grosso II; MT-III: Mato
Grosso III; MS-I: Mato Grosso do Sul I; MS-II: Mato Grosso do Sul II
It is extremely important to characterise and maintain genetic variability between the groups in the breeding program. Animals that make up the parental generation of these five groups were captured from different sub-basins of the River Paraguay, and a genetic analysis was first carried out to ensure the necessary genetic variability and divergence to initiate the
Pseudoplatystoma reticulatum breeding program. The
results from the differentiation and genetic distance of the five groups prove that they are subdivided into two main groups, which in turn consist of two and three subgroups (Figure 1).
These results can support and indicate strategies for animal selection in the genetic improvement program. In order to conserve the number of families over the generations and maintain genetic variability, thereby avoiding inbreeding, these data can aid in carrying out crosses between families of the same subgroup (MT-I, II and II) and (MS-I and II), or even in crosses between the two subgroups, as described in Figure 1.
Animals inserted in the same genetic group should be considered when forming a restricted genetic base and in selection analysis, so that future crosses between related animals can maintain genetic
variability and generate an increase in the characteristics of zootechnical interest for the next generations of genetically superior animals, as highlighted in several studies (BRIÑEZ; CARABALLO; SALAZAR, 2011; MACHADO-SCHIAFFINO et al., 2007; PONZONI et al., 2010, 2011).
With the data obtained, selections can be made to preserve the genetic variability of Pseudoplatystoma
reticulatum from the families of the genetic groups
in the breeding program, with the possible strategy of mating between individuals of the two subgroups or between the groups under analysis. Finally, it is considered that microsatellite molecular markers can play a role in decision-making when monitoring the genetic variability of groups in breeding programs, helping to maintain low levels of inbreeding, and is considered a viable tool of molecular biology for aquaculture.
CONCLUSIONS
1. The five groups under study are distinct, and form two genetic groups composed of three and two subgroups respectively;
LOPERA-BARRERO, N. M. et al. Comparación de protocolos de extracción de ADN com muestras de aleta y larva de peces: extracción modificada con sal (NaCl). Ciencia e Investigación
Agraria, v. 35, n. 1, p. 15-24, 2008.
LOPERA-BARRERO, N. M. et al. Diversidad genética de
Piaractus mesopotamicus utilizado em programas de repoblación.
Archivos de Zootecnia, v. 59, p. 51-62, 2010.
LOPERA-BARRERO, N. M. et al. Genetic diversity of
Prochilodus lineatus stocks using in the stocking program of
Tietê River, Brazil. Revista MVZ Córdoba, v. 18, n. 13, p. 3759-3766, 2013.
MACHADO-SCHIAFFINO, G.; DOPICO, E.; GACIA-VAZQUEZ, E. Genetic variation losses in Atlantic salmon stocks created for supportive breeding. Aquaculture, v. 624, p. 59-65, 2007.
MELO, B. F. et al. The roles of marginal lagoons in the maintenance of genetic diversity in the Brazilian migratory fishes
Prochilodus argentus and P. costatus. Neotropical Ichthyology,
v. 11, n. 3, p. 625-636, 2013.
NEI, M. Analysis of gene diversity in subdivided populations.
Proceedings of the National Academy of Science, v. 70, n. 12,
p. 3321-3323, 1973.
PONZONI, R. W. et al. Genetic improvement of Nile tilapia (Oreochromis niloticus) with special reference to the work conducted by the WorldFish Center with the GIFT strain.
Aquaculture, v. 3, n. 1, p. 27-41, 2011.
PONZONI, R. W. et al. Inbreeding and effective population size in the Malaysian nucleus of the GIFT strain of Nile tilapia (Oreochromis niloticus). Aquaculture, v. 302, p. 42-48, 2010.
POVH, J. A. et al. Microsatellite analysis of the parental contribution of Piaractus mesopotamicus to the production of offspring in the semi-natural system of reproduction. Brazilian
Archives of Biology and Technology, v. 53, n. 2, p. 389-396,
2010.
RAYMOND, M.; ROUSSET, F. Genepop version 1.2: population genetics software for exact tests and ecumenicism. Journal of
Heredity, v. 86, p. 248-249, 1995.
REID, S. La biologia de los bagres rayados Pseudoplatystoma
fasciatum y P.tigrinus en la cuenca del Rio Apure, Venezuela.
Revista Unellez de Ciencia y Tecnología, v. 1, p. 13-41,
1983.
REVALDAVES, E. et al. Isolation and characterization of microsatellite loi in Pseudoplatystoma corruscans (Siluriformes, Pimelodidae) and cross-species amplification. Molecular Ecology Notes, v. 5, n. 3, p. 463-465, 2005.
RIBEIRO, R. P. et al. Caracterização genética de estoques de Tambaqui do Estado de Rondônia (Brasil): implicações na produção e na conservação. Semina, v. 37, n. 4, p. 2375-2385, 2016.
RIBEIRO, R. P.; LEGAT, A. P. Delineamento de programas
de melhoramento genético de espécies aquícolas no Brasil.
2. Based on the data obtained, selections can be made with a view to conserving the genetic variability of Pseudoplatystoma reticulatum in the genetic
improvement program of aquaculture species.
ACKNOWLEDGMENTS
Emiko Kawakami de Resende of Embrapa Pantanal, Corumbá-MS, Brazil, for her collaboration in the research.
REFERENCES
ABREU, M. M. et al. Genetic variability of two populations of
Pseudoplatystoma reticulatum from the Upper Paraguai River
Basin. Genetic and Molecular Biology, v. 32, n. 4, p. 868-873, 2009.
ALBUQUERQUE, D. M.; PEREIRA, R. P.; RODRIGUEZ-RODRIGUEZ, M. P. Avanços no programa de melhoramento genético do cachara no Brasil. Ciência Animal, v. 29, n. 1, p. 109-120, 2019.
BASSAM, B. J.; CAETANO-ANOLLÉS, G.; GRESSHOFF, P. M. Fast and sensitive silver staining of DNA in polyacrylamide gels. Analytical Biochemistry, v. 196, p. 80-83, 1991.
BRIÑEZ, R. B.; CARABALLO, O. X.; SALAZAR, V. M. Genetic diversity of six populations of red hybrid tilapia, using microsatellites genetic markers. Revista MVZ Córdoba, v. 16, p. 2491-2498, 2011.
CREPALDI, D. V. et al. O surubim na aquacultura do Brasil.
Revista Brasileira de Reprodução Animal, v. 30, n. 3/4, p.
150-158, 2006.
DUFRESNE, F. et al. Recent progress and challenges in population genetics of poyploid organism: an overview of current state-of-the-art molecular and statistical tools. Molecular
Ecology, v. 23, p. 40-69, 2014.
EXCOFFIER, L. G.; SCHNEIDER, S. Arlequin version 3.0: an integrated software package for population genetics data analysis.
Evolutionary Bioinformatics Online, v. 1, p. 47-50, 2005.
GUICHOUX, E. et al. Current trends in microsatellite genotyping. Molecular Ecology Resources, v. 11, p. 291-611, 2011.
HILSDORF, A. W. S.; ORFÃO, L. H. Aspectos gerais do melhoramento genético em peixes no Brasil. Revista Brasileira
de Zootecnia, v. 40, p. 317-324, 2011.
KORDICHEVA, S. Y. et al. A search for null alleles at the microsatellite locus of chum salmon (Oncorhynchus keta Walbaum). Russian Journal of Genetics, v. 46, n. 8, p. 1019-1022, 2010.
LIND, C. E. et al. Selective breeding in fish and conservation of genetic resources for aquaculture. Reproduction in Domestic
Teresina: Embrapa Norte, 2008. 25 p. (Embrapa Meio-Norte. Documentos, 184).
RODRIGUEZ-RODRIGUEZ, M. P. et al. Caracterização genética de gerações de tilápia Gift por meio de marcadores moleculares microssatélites. Pesquisa Agropecuária Brasileira, v. 48, n. 10, p. 1385-1393, 2013.
SANCHES, A. et al. Genetic population structure of two migratory freshwater fish species (Brycon orthotaenia and
Prochilodus argentus) from the São Francisco River in Brazil
and it’s significance for conservation. Latin American Journal
of Aquatic Research, v. 40, n. 1, p. 177-186, 2012.
SAULO-MACHADO, A. C. et al. Polymorphic microsatellite DNA markers for the Amazonian catfish Pseudoplatystoma
punctifer (Siluriformes: Pimelodidae). Conservation Genetic
Resources, v. 3, p. 307-310, 2011.
VAN OOSTERHOUT, C. et al. Micro-Checker: software for identifying and correcting genotyping errors in microsatellite data. Molecular Ecology Notes, v. 4, p. 535-538, 2004. YEH, F. C.; BOYLE, T. Y. Z.; XIYAN, J. M. PopGene version
131: Microsoft Window-based freeware for population genetic
analysis. Alberta: University of Alberta: Center for International Forestry Research, 1999. 29 p.