Genetic variability of two populations of
Pseudoplatystoma reticulatum
from
the Upper Paraguay River Basin
Marcia Matos de Abreu
1, Luiz Henrique Garcia Pereira
3, Vilma Barretto Vila
2, Fausto Foresti
3and Claudio Oliveira
31
Departamento de Ciências Ambientais, Universidade do Estado de Mato Grosso, Cáceres, MT, Brazil.
2
Departamento de Ciências Biológicas, Universidade do Estado de Mato Grosso, Cáceres, MT, Brazil.
3
Departamento de Morfologia, Instituto de Biociências, Universidade Estadual Paulista
‘Júlio de Mesquita Filho’, Botucatu, SP, Brazil.
Abstract
Catfishes of the genusPseudoplatystoma are very important species due to both their high commercial value and their ecological role as voracious predators. They undertake lengthy migratory movements during their life-cycle, this including reproductive migration which occurs from October to December in the rainy season. In the present study, seven microsatellite loci were analyzed to access genetic variability in two samples ofP. reticulatum from the Upper Paraguay Basin. The loci were highly polymorphic (mean = 7.28). According to all analysis, the two samples ofP. reticulatum revealed pronounced genetic differentiation. Fstvalue was 0.2290,Rstvalue 0.1067 and AMOVA 22.90% (Fst) and 10.67% (Rst), all being highly significant (p < 0.001). The division of the fishes into two groups was confirmed by microsatellite multi-locus Bayesian assignment testing. The results obtained present evidence of genetic structur-ing in aP. reticulatum population.
Key words:fish, population genetics, microsatellite, homing, population structure.
Received: October 14, 2008; Accepted: May 27, 2009.
Catfishes of the genusPseudoplatystomabelong to the family Pimelodidae, the 93 species of which occurring in the major river basins of South America (Ferraris, 2007). They are migratory species of high commercial value, be-sides playing an important ecological role in the basins where they occur, due to their predatory behavior (Satoet al., 1988; Miranda, 1997). The upriver migratory move-ment for reproduction usually occurs from October to De-cember (Resende, 2003). Almost all the stocks of these giant catfishes had declined in the last years (Barthem and Goulding, 2007). The loss of biodiversity in aquatic envi-ronments is one among the most serious problems faced by countries all over the world (Moyle and Leidy, 1992), com-promising the ecosystem functioning as a whole. The con-servation of these ecosystems is vital for various economical sectors in many countries (Ehrlich and Ehrlich, 1992). According to Allan and Flecker (1993), several fac-tors have been identified as causing the decline of fish di-versity in several aquatic ecosystems, such as the introduction of exotic species, industrialization, urbaniza-tion, destruction of forests and riparian vegetaurbaniza-tion,
pollu-tion by pesticides and gold mining camps, and the construc-tion of physical barriers for the generaconstruc-tion of electricity.
The Pantanal area is located at the Upper Paraguay River Basin, with a drainage basin extending from the bor-der between Brazil and Paraguay up to the limits of the Am-azon River Basin, and covering about 140,000 km2(Vila da Silva, 1995). In the Pantanal, fisheries constitute the second activity in economic importance. Furthermore, and apart from their ecological importance, fish resources are funda-mental for subsistence, amateur, professional and sports fisheries, and the transaction of native crafts (Catella, 2003).
Microsatellite markers have been extensively used in studies on the genetics of fish populations. These markers have a co-dominant inheritance pattern, a high degree of polymorphism, and allow for easy analysis through experi-ments involving the polymerase chain reaction (PCR) (Wright and Bentzen, 1994; Triantafyllidis et al., 2002; Salgueiroet al., 2003; Barrosoet al., 2005; Mãkinenet al., 2006). Studies using microsatellites have revealed pro-nounced genetic differences even among populations iso-lated by short geographic distances (Koskinenet al., 2002). In this study, we analyzed two natural populations of
Pseudoplatystoma reticulatum(“cachara”) collected in the Upper Paraguay River Basin, by using seven microsatellite
Send correspondence to Marcia Matos de Abreu. Instituto de Ciên-cias Naturais e Tecnológicas, Universidade de Estado do Mato Grosso, Av. Tancredo Neves 1095, Cavalhada II, 78.200-000 Cá-ceres, MT, Brazil. E-mail: [email protected].
loci originally developed forP. corruscansto access the ge-netic diversity of these samples. These data can be used as subsidies for setting up management policies for the devel-opment and conservation of these species.
A total of 52 adult specimens ofP. reticulatumwere caught by gill nets at two points on the Paraguay River Ba-sin. 31 specimens were collected from the Paraguay River (PRP) (16° 04’ 00" S 57° 41’ 00" W) and 21 from the Jauru River (PRJ) (15° 51’ 00" S 58° 27’ 00" W). Fin clips were the source of nuclear DNA. These were collected from freshly caught fish and immediately preserved in 95% etha-nol. After collection, the fishes were sold. For the extrac-tion of genomic DNA, about 0.1 mg of tissue was incubated in 200mL of 5% Chelex (Sigma®) at 65 °C overnight.
TheP. reticulatumsamples were screened for varia-tion at each of the seven microsatellite loci. Five of these loci have already been described by Revaldaves et al.
(2005) (Pcor01, Pcor05, Pcor08, Pcor10, and Pcor21), and two by Pereiraet al.(2009) (Pcor23 and Pcor28). PCR am-plification reactions were conducted in a thermocycler PTC-100 (MJ Research) with a final volume of 12.5mL,
consisting of about 10 ng of DNA, 0.25mM of each primer,
0.2 mM of dNTP, 1.2 mM of MgCl2, 0.2 U of Taq-Pht
DNA polymerase, 1X PCR buffer (50 mM KCl, 10 mM Tris-HCl, 0.1% Triton X-100, and 1.5 mM MgCl2) and
wa-ter. We used the following PCR profile for the lociPcor01, Pcor02, Pcor05, Pcor08, Pcor21, Pcor23andPcor28: ini-tial denaturation at 95 °C for 5 min, 30 cycles of 10 s at 95 °C, 15 s at an annealing temperature of 55 °C, 15 s at 72 °C and a final extension at 72 °C for 10 min. For the lo-cusPcor10, the PCR profile consisted of an initial denatur-ation at 95 °C for 5 min, 30 cycles of 30 s at 95 °C, 30 s at an annealing temperature of 48 °C, 30 s at 72 °C and a final ex-tension at 72 °C for 10 min. Amplified products were re-solved on 6% polyacrylamide gels stained with silver nitrate. Microsatellite alleles were identified by their size in base-pairs. Allele lengths were estimated by comparison with a 10 bp ladder (10 pb DNA Ladder - Invitrogen), using Kodak Digital Science 1D software.
Allelic count, expected and observed heterozygosity (HE,HO), inbreeding coefficient (FIS) and gene flow (Nm=
0.25(1-FST)/FST) were obtained with POPGEN 1.32 soft-ware (Yeh and Boyle, 1997). Allelic richness and Nei gene diversity were obtained with Fstat v2.9.3 software (Goudet, 2001). Deviation from Hardy-Weinberg equilibrium (HWE) was tested with the GENEPOP 3.3 package (Ray-mond and Rousset, 1995). MICRO-CHECKER 2.2.1 (van Oosterhoutet al., 2004) software was used to infer the most probable cause of HWE departures.
In order to investigate the genetic structure in samples ofP. reticulatum,FST(Weir and Cockerham, 1984) indices,
assuming the infinite allele model (IAM), andRST(Slatkin,
1995), which assumes the stepwise mutation model (SMM), were calculated for all loci using ARLEQUIN 3.11 (Excoffieret al., 2005). Their significance estimates were
based on 1,000 permutations. Analysis of molecular vari-ance (AMOVA) (Excoffieret al., 1992), incorporated in ARLEQUIN 3.11 (Excoffier et al., 2005), was used to check the partition of variance among and within popula-tions. These analyses were carried out with both distance indexes (FSTandRST), and their significance was tested with 1,000 permutations. Corrections of the significance level for multiple tests were performed following the Bonferroni procedure (Rice, 1989). The frequency of private alleles was obtained manually, observing the distribution of alleles in each locus for two analyzed populations.
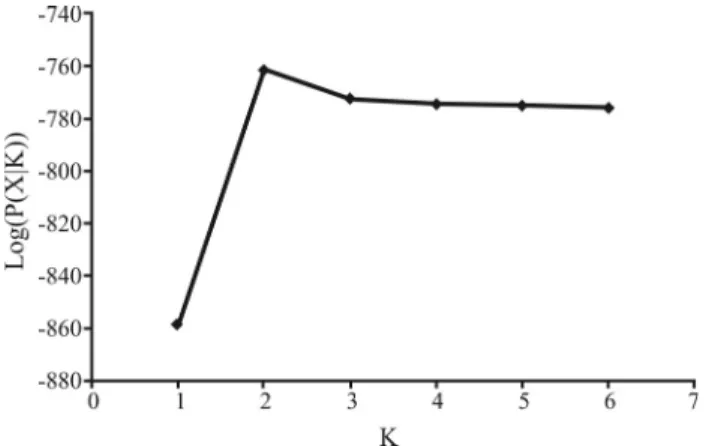
Bayesian clustering was also used to assess popula-tion relatedness by means of the STRUCTURE 2.2 (Prit-chardet al., 2000) program. The number of populations (K) was estimated by using the ‘no admixture’ ancestral model with correlated alleles, thereby allowing for maximal popu-lation resolution, withKranging from 1 to 6. Three inde-pendent runs of 500,000 Markov chain Monte Carlo (MCMC) generations and 100,000 generations of ‘burn-in’ were used for each value ofK. The true number of popula-tions is expected to be the value ofKthat maximizes the es-timated model log-likelihood, log (P(X|K)) (Falushet al., 2003).
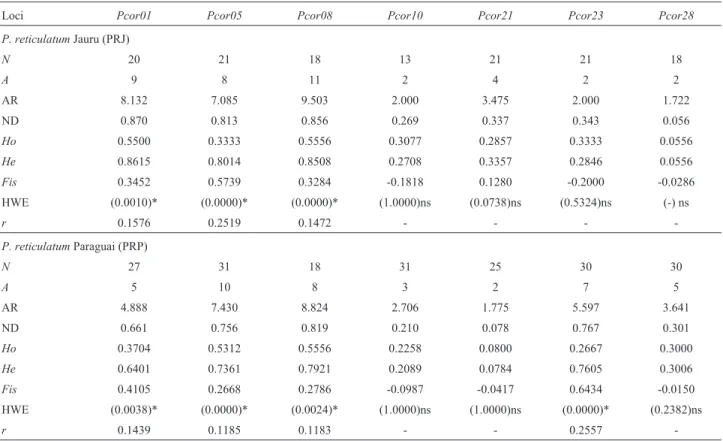
The number of alleles per polymorphic locus ranged from two (Pcor10, Pcor21, Pcor23 and Pcor28) to 11 (Pcor08), and allelic richness from 1.722 (Pcor28) to 9.503 (Pcor08) (Table 1). Nei gene diversity ranged from 0.056 (Pcor28) to 0.870 (Pcor01). A total of 51 alleles were de-tected, of which 26 were private (Table 2). The private al-leles showed frequencies ranging from 0.0167 (six alal-leles) to 0.3333 (one allele) (Table 2). Expected and observed heterozygosities ranged from 0.0556 (Pcor28 - PRJ) to 0.8615 (Pcor01 -PRJ) and from 0.0556 (Pcor28 -PRJ) to 0.5556 (Pcor08 -PRJ and PRP), respectively (Table 1). Significant departures from HWE (p < 0.025 adjusted ac-cording to Bonferroni correction) were detected at the pop-ulation level for seven loci (Table 1). The occurrence of genotyping errors due to null alleles, stuttering or large al-lele drop-out were checked with the MICRO-CHECKER program. Significant values were, however, not found due to stuttering or large allele drop-out. Estimates of the occur-rence of null alleles revealed positive values for all cases in which departure from HWE was identified. TheFISindex suggested the existence of heterozygote deficiency in eight out of 14 comparisons in the populations analyzed (Table 1).
Individual multi-locus genotypes were used to assign individuals to their respective population of origin. On con-sidering the correct assignment of all individuals, 98.3% were correctly assigned to the PRP population and 99.1% to the PRJ population.
Hierarchical AMOVA revealed that most total ge-netic variance was to be found within populations
FST= 77.10% andRST= 89.33%. The values for variability
between populations wereFST= 22.90% andRST= 10.67%.
These were highly significant (p < 0.0001), thus revealing the strong structure ofP. reticulatumpopulations.
Structure analysis without admixture inferred that the two populations were genetically distinct, withK= 2 popu-lations maximizing the estimated log likelihood in the model (Figures 1 and 2).
The value of gene flow parameterNmwas calculated from the mean FST value. The mean value obtained was
Nm= 0.8417, indicating that some gene exchange had oc-curred among the sampled populations.
The microsatellites displayed a high degree of poly-morphism (mean = 7.28), consistent with the mean number observed in other fish species (DeWoody and Avise, 2000).
Table 2- Private allele counts. Allele number and relative frequency (in parentheses) are listed for each locus analyzed.
Pcor01 Pcor05 Pcor08 Pcor10 Pcor21 Pcor23 Pcor28
Jauru 107 (0.1500) 133 (0.0476) 165 (0.0278) 104 (0.0238)
(PRJ) 109 (0.1250) 179 (0.0278) 114 (0.1190)
119 (0.0250) 120 (0.0476)
121 (0.0500)
Paraguai 151 (0.0185) 137 (0.0167) 147 (0.0263) 139 (0.0484) 116 (0.0400) 091 (0.3333) 100 (0.0167)
(PRP) 145 (0.0167) 095 (0.2333) 102 (0.0500)
153 (0.0333) 097 (0.0500) 106 (0.0167)
159 (0.0167) 101 (0.0167)
107 (0.0167)
Table 1- Summary of microsatellite data on each analyzed population ofPseudoplatystoma reticulatumanalyzed.N, Number of individuals;A, number
of alleles; AR, Allelic Richness; ND, Nei gene diversity;HO, observed heterozygosity;HE, expected heterozygosity;FIS, inbreeding coefficient; HWE
re-sult of Hardy-Weinberg probability test on deviation from expected Hardy-Weinberg proportions withp-value= 0.05 (adjustment Bonferroni correction
p = 0.025;k= 2), *, significant; ns, not significantandr, null allele frequency per loci.
Loci Pcor01 Pcor05 Pcor08 Pcor10 Pcor21 Pcor23 Pcor28
P. reticulatumJauru (PRJ)
N 20 21 18 13 21 21 18
A 9 8 11 2 4 2 2
AR 8.132 7.085 9.503 2.000 3.475 2.000 1.722
ND 0.870 0.813 0.856 0.269 0.337 0.343 0.056
Ho 0.5500 0.3333 0.5556 0.3077 0.2857 0.3333 0.0556
He 0.8615 0.8014 0.8508 0.2708 0.3357 0.2846 0.0556
Fis 0.3452 0.5739 0.3284 -0.1818 0.1280 -0.2000 -0.0286
HWE (0.0010)* (0.0000)* (0.0000)* (1.0000)ns (0.0738)ns (0.5324)ns (-) ns
r 0.1576 0.2519 0.1472 - - -
-P. reticulatumParaguai (PRP)
N 27 31 18 31 25 30 30
A 5 10 8 3 2 7 5
AR 4.888 7.430 8.824 2.706 1.775 5.597 3.641
ND 0.661 0.756 0.819 0.210 0.078 0.767 0.301
Ho 0.3704 0.5312 0.5556 0.2258 0.0800 0.2667 0.3000
He 0.6401 0.7361 0.7921 0.2089 0.0784 0.7605 0.3006
Fis 0.4105 0.2668 0.2786 -0.0987 -0.0417 0.6434 -0.0150
HWE (0.0038)* (0.0000)* (0.0024)* (1.0000)ns (1.0000)ns (0.0000)* (0.2382)ns
-However, Pereiraet al. (2009) found a mean number of 15.28 alleles in six populations ofP. corruscans.
A significant deviation of HWE (p < 0.05) was ob-served in seven loci within two samples analyzed (Table 1). HWE departure is, however, common with microsatellites (Alam and Islam, 2005; Carreras-Carbonell et al., 2006; Chevolotet al., 2006). Five potential causes may induce such a phenomenon in a given population: (i) the high num-ber of alleles per locus, (ii) technical artifacts, such as the occurrence of null alleles, stuttering or large allele drop-out, (iii) the Wahlund effect, (iv) the selection of spe-cific alleles, and (v) inbreeding (Hoarauet al., 2002; Pe-reiraet al, 2009).
Estimates of the occurrence of null alleles revealed positive values for all cases in which HWE departure was identified (Table 1). The occurrence of null alleles is a com-mon problem in the study of microsatellites, and may be ex-plained by the low efficiency of the primer hybridization used to amplify some loci, due to point mutation in one or more annealing sites of these primers (Callenet al., 1993; OConnell and Wright, 1997; Dakin and Avise, 2004), be-sides the possible differential amplification of alleles with different sizes (Wattieret al., 1998). The inbreeding coeffi-cientFIS was calculated for all loci. The results acquired displayed significant departure from HWE (Table 1), thereby showing heterozygote shortage. These data show
that inbreeding could be one possible cause for HWE de-parture. However, the cases that revealed HWE departure were those in which loci showed the largest number of al-leles (Table 1). We therefore believe that the null allele hy-pothesis is that which best explains HWE departure.
There was significant populational structuring be-tween the two samples ofP. reticulatumanalyzed, as dem-onstrated through the different tests employed in this study. TheFSTandRSTindex observed between populations ofP.
reticulatumshowed high (0.2290) and moderate (0.1067) values, respectively (p < 0.025), thus suggesting there is a strong genetic structure. The differences of values between indices were probably due to differences in the mutation models on which they were based. WhileFSTis based on IAM,RSTis based on SMM. TheRSTindex may be the best for microsatellite analysis, and it is expected thatRSTvalues
under a strict SMM pattern would be higher than those of
FST(Slatkin, 1995). However, as can be seen from our re-sults, FST values were higher than RST. This may be
ex-plained by the fact that probably not all microsatellite loci evolve strictly in accordance to a SMM model (Balloux and Lugon-Moulin, 2002). This presupposes that mutations oc-cur by the addition or subtraction of a single repetition unit in the microsatellite immediately anterior or posterior to a known and highly related mutation. Departure from this strict SMM pattern would result in the inferior performance of RST in relation to FST (Slatkin, 1995, Balloux et al., 2000). Departure from the SMM model observed in the present study may be related to the fact that in three of our eight loci repetitions were imperfect (Pcor01
-(TC)9GC(TC)9-; Pcor05 -(TC)8CC(TC)15- and Pcor10
-(GTCG)15(GT)9(CC-).
The results obtained through AMOVA analysis re-vealed the occurrence of significant differentiation between populations ofP. reticulatum on using both indices (FST andRST), thereby depicting the occurrence of strong genetic structuring. The values of molecular variation among popu-lations were 22.90% (FST) and 10.67% (RST), both with highly significantpvalues (p < 0.0001). Through structure analysis without admixture, it was shown that both popula-tions were genetically distinct, withK= 2 populations max-imizing the estimated log-likelihood in the model (Figures 1 and 2).
The genetic flow of all loci in the two populations was estimated asNm = 0.8417 migrants per generation. Ac-cording to Nei (1987),Nmvalues above 1 suggest that ge-netic flow constitutes a positive factor against gege-netic differentiation among populations (Spieth, 1974). Thus, our data showed that genetic flow between the two popula-tions analyzed did not exist or was very low, thereby rein-forcing the hypothesis of genetic structure. The results obtained in the assignment tests were extremely positive, as described in the literature for other fish groups (Triantafyllidiset al., 2002). In the present study involving seven microsatellites (FST= 0.2290), 98.3% and 99.1% of
Figure 1- Structure bar-plot representing assignments of genotypes to each population. Grays represent assignments assuming two populations, demonstrating the pattern of clustering within regional groups.
PRJ =Pseudoplatystoma reticulatumJauru River; PRP =P. reticulatum
Paraguai River.
Figure 2- Results of the Structure 2.2 analysis of estimated log likelihood
log (P(X|K)) for the modelvs.the number of populations,Kto populations
the individuals were correctly assigned to the location from which they were sampled (PRP and PRJ, respectively). These results are consistent with the values found by Pereiraet al.(2009) when analyzing sixP. corruscans pop-ulations (values ranging from 93.6% to 98.2%). Cornuetet al.(1999) showed by simulations that 100% correct assign-ments can be achieved through the Bayesian method with as few as 10 microsatellite loci and 10 individuals sampled per population, when populations are sufficiently diverged (FST~ 0.1).
Twenty-six private alleles were found in the two pop-ulations ofP. reticulatum analyzed. In five of these, fre-quency was higher than 10% (Table 2). The existence of private alleles places in evidence the absence of gene flow, or at least that it is at a minimum and frequently present in structured populations. Thus, these data reinforce the exis-tence of firm structuring in the P. reticulatumanalyzed. Furthermore, all the tests employed confirmed the strong structure in these populations. Thus, our work renders pre-liminary evidence of the genetic structure inP. reticulatum. As the results presented are consistent with those obtained forP. corruscans(Pereiraet al., 2009) and, on considering the similar behavior between these two species, we suggest thatP. reticulatumalso presents homing behavior.
The ability to identify and define biological popula-tions is crucial for taking informed decisions concerning conservation and management (Waples and Gaggiotti, 2006). Considering the ecological and economic impor-tance ofP. reticulatum, the present data constitute a partic-ularly important element when contemplating their management and conservation. It also places in evidence, the importance of preserving each population to further a positive outcome in the genetic conservation of these spe-cies.
Acknowledgments
Financial support for this study was provided by CNPq and FAPESP.
References
Alam MS and Islam MS (2005) Population genetic structure of
Catla catla (Hamilton) revealed by microsatellite DNA markers. Aquaculture 246:151-160.
Allan JD and Flecker AS (1993) Biodiversity conservation in run-ning waters: Identifying the major factors that threaten de-struction of riverine species and ecosystems. BioSciences 43:32-43.
Balloux F and Lugon-Moulin N (2002) The estimation of popula-tion differentiapopula-tion with microsatellite markers. Mol Ecol 11:155-165.
Balloux F, Brünner H, Lugon-Moulin N, Hausser J and Goudet J (2000) Microsatellites can be misleading: An empirical and simulation study. Evolution 54:1414-1422.
Barroso RM, Hilsdorf AWS, Moreira HLM, Cabello PH and Traub-Cseko YM (2005) Genetic diversity of wild and cul-tured populations of Brycon opalinus (Cuvier, 1819)
(Characiformes, Characidae, Bryconiae) using microsa-tellites. Aquaculture 247:51-65.
Barthem R and Goulding M (2007) Um Ecossistema Inesperado: A Amazônia Revelada Pela Pesca. Amazon Conservation Association, Lima, 240 pp.
Callen DF, Thompson AD, Shen Y, Phillipis HA, Richards RI, Mulley JC and Sutherland GR (1993) Incidence and origin of `null’ alleles in the (AC)nmicrosatellite markers. Am J Hum Genet 52:922-927.
Carreras-Carbonell J, Macpherson E and Pascual M (2006) Popu-lation structure within and between subspecies of the Medi-terranean triplefin fish Tripterygion delaisi revealed by highly polymorphic microsatellite loci. Mol Ecol 15:3527-3539.
Catella AC (2003) A Pesca no Pantanal Sul: Situação Atual e Perspectivas. Embrapa Pantanal, Corumbá, 43 pp.
Chevolot M, Ellis JR, Hoarau G, Rijnsdorp AD, Stam WT and Olsen JL (2006) Population structure of the thornback ray (Raja clavataL.) in British waters. J Sea Res 56:305-316. Cornuet JM, Piry S, Luikart G, Estoup A and Solignac M (1999)
New methods employing multilocus genotypes to select or exclude populations as origins of individuals. Genetics 153:1989-2000.
Dakin EE and Avise JC (2004) Microsatellite null alleles in par-entage analysis. Heredity 93:504-509.
DeWoody JA and Avise JC (2000) Microsatellite variation in ma-rine, freshwater and anadromous fishes compared with other animals. J Fish Biol 56:461-473.
Ehrlich P and Ehrlich A (1992) The value of biodiversity. Ambio 21:219-226.
Excoffier L, Smouse P and Quattro J (1992) Analysis of molecu-lar variance inferred from metric distances among DNA haplotypes: Application to human mitochondrial DNA re-striction data. Genetics 131:479-491.
Excoffier L, Laval G and Schneider S (2005) Arlequin v. 3.0: An integrated software package for population genetics data analysis. Evol Bioinform Online 1:47-50.
Falush D, Stephens M and Pritchard JK (2003) Inference of popu-lation structure using multilocus genotype data: Linked loci and correlated allele frequencies. Genetics 164:1567-1587. Ferraris CJ (2007) Checklist of catfishes, recent and fossil
(Osteichthyes, Siluriformes), and catalogue of siluriform primary types. Zootaxa 1418:1-628.
Hoarau G, Rijnsdorp AD, Van der Veer HW, Stam WT and Olsen JL (2002) Population structure of plaice (Pleuronectes platessa 1) in northern Europe: Microsatellites revealed large-scale spatial and temporal homogeneity. Mol Ecol 11:1165-1176.
Koskinen MT, Nilsson J, Veselov AJ, Potutkin AG, Ranta E and Primmer CR (2002) Microsatellite data resolve phylogeo-graphic patterns in European grayling,Thymallus thymallus, Salmonidae. Heredity 88:391-401.
Mäkinen HS, Cano JM and Meriläl J (2006) Genetic relationships among marine and freshwater populations of the European three-spined stickleback (Gasterosteus aculeatus) revealed by microsatellites. Mol Ecol 15:1519-1534.
Miranda MOT (1997) Surubim. Instituto Brasileiro de Meio Am-biente e dos Recursos Naturais Renováveis, Belo Horizonte, 156 pp.
Jain SK (eds) Conservation Biology: The Theory and Prac-tice of Nature Conservation, Preservation, and Manage-ment. 1st edition. Chapman and Hall, New York, pp 127-169.
Nei M (1987) Molecular Evolutionary Genetics. 1st edition. Co-lumbia University Press, New York, 512 pp.
O’Connell M and Wright JM (1997) Microsatellite DNA in fishes. Rev Fish Biol Fish 7:331-363.
Pereira LHG, Foresti F and Oliveria C (2009) Genetic structure of the migratory catfish Pseudoplatystoma corruscans
(Siluriformes, Pimelodidae) suggests homing behavior. Ecol Freshw Fish 18:215-225.
Pritchard JK, Stephens M and Donnelly P (2000) Inference of population structure using multilocus genotype data. Genet-ics 155:945-959.
Raymond M and Rousset F (1995) Genepop v. 1.2: Population ge-netics software for exact tests and ecumenicism. J Hered 86:248-249.
Resende EK (2003) Migratory fishes of the Paraguay - Paraná Ba-sin excluding the Upper Paraná BaBa-sin. In: Carolsfeld J, Harvey B, Ross C and Baer A (eds) Migratory Fishes of South America. Biology, Fisheries and Conservation Status. World Fisheries Trust, Victoria, pp 99-156.
Revaldaves E, Pereira LHG, Foresti F and Oliveira C (2005) Iso-lation and characterization of microsatellite loci in
Pseudoplatystoma corruscans(Siluriformes, Pimelodidae) and cross-species amplification. Mol Ecol Notes 5:463-465. Rice WR (1989) Analyzing tables of statistical tests. Evolution
43:223-225.
Salgueiro P, Carvalho G, Collares-Pereira MJ and Coelho MM (2003) Microsatellite analysis of genetic population struc-ture of the endangered cyprinid Anaecypris hispanica in Portugal: Implications for conservation. Biol Conserv 109:47-56.
Sato Y, Cardoso EL and Sallum WB (1988) Reprodução induzida do surubim (Pseudoplatystoma coruscans) da bacia do rio São Francisco. Encontro Anual de Aqüicultura - Associação Mineira de Aqüicultura, Belo Horizonte, pp 6:20.
Slatkin M (1995) A measure of population subdivision based on microsatellite allele frequencies. Genetics 139:457-462. Spieth PT (1974) Gene flow and genetic differentiation. Genetics
78:961-965.
Triantafyllidis A, Krieg F, Cottin C, Abatzopoulos TJ, Triantafyllidis C and Guyomard R (2002) Genetic structure and phylogeography of European catfish (Silurus glandis) populations. Mol Ecol 11:1039-1055.
van Oosterhout C, Hutchinson WF, Wills DPM and Shipley P (2004) Micro-Checker: Software for identifying and cor-recting genotyping errors in microsatellite data. Mol Ecol Notes 4:535-538.
Vila da Silva JS (1995) Elementos fisiográficos para delimitação do ecossistema Pantanal: Discussão e proposta. In: Esteves FA (ed) Oecologia Brasiliensis, Estrutura, Funcionamento e Manejo de Ecossistemas Brasileiros. PPGEUFRJ, Rio de Ja-neiro, pp 439-458.
Waples RS and Gaggiotti O (2006) What is a population? An em-pirical evaluation of some genetic methods for identifying the number of gene pools and their degree of connectivity. Mol Ecol 15:1419-1439.
Wattier R, Engel CR, Saumitou-Laprade P and Valero M (1998) Short allele dominance as a source of heterozygote defi-ciency at microsatellite loci: Experimental evidence at the dinucleotide locus Gv1CT in Gracilaria gracilis
(Rhodophyta). Mol Ecol 7:1569-1573.
Weir BS and Cockerham CC (1984) EstimatingF-statistics for the analysis of population structure. Evolution 38:1358-1370. Wright JM and Bentzen P (1994) Microsatellites: Genetic
mark-ers for the future. In: Carvalho GR and Pitcher TJ (eds) Mo-lecular Genetics in Fisheries. Chapman & Hall TJ Press Ltd, Cornwall, pp 384-388.
Yeh FC and Boyle TJB (1997) Population genetic analysis of co-dominant and dominant markers and quantitative traits. Belg J Bot 29:157.
Internet Resources
Goudet J (2001) FSTAT - A program to estimate and test gene di-versities and fixation indices (ver. 2.9.3). [online] Available at http://www.unil.ch/izea/softwares/fstat.html.
Associate Editor: Louis Bernard Klaczko