Genetic variability in Brazilian wheat cultivars assessed
by microsatellite markers
Ivan Schuster
1,2, Elisa Serra Negra Vieira
1, Glacy Jaqueline da Silva
2, Francisco de Assis Franco
1and Volmir Sérgio Marchioro
11
Cooperativa Central de Pesquisa Agrícola, Cascavel, PR, Brazil.
2
Departamento de Ciências Biológicas, Universidade Paranaense, Cascavel, PR, Brazil.
Abstract
Wheat (Triticum aestivum) is one of the most important food staples in the south of Brazil. Understanding genetic variability among the assortment of Brazilian wheat is important for breeding. The aim of this work was to molecularly characterize the thirty-six wheat cultivars recommended for various regions of Brazil, and to assess mutual genetic distances, through the use of microsatellite markers. Twenty three polymorphic microsatellite markers (PMM) delin-eated all 36 of the samples, revealing a total of 74 simple sequence repeat (SSR) alleles,i.e. an average of 3.2 alleles per locus. Polymorphic information content (PIC value) calculated to assess the informativeness of each marker ranged from 0.20 to 0.79, with a mean of 0.49. Genetic distances among the 36 cultivars ranged from 0.10 (between cultivars Ocepar 18 and BRS 207) to 0.88 (between cultivars CD 101 and Fudancep 46), the mean distance being 0.48. Twelve groups were obtained by using the unweighted pair-group method with arithmetic means analysis (UPGMA), and thirteen through the Tocher method. Both methods produced similar clusters, with one to thirteen cultivars per group. The results indicate that these tools may be used to protect intellectual property and for breeding and selection programs.
Key words: Triticum aestivum,germplasm, cultivar characterization, cluster analysis, molecular markers. Received: August 13, 2008; Accepted: January 30, 2009.
Although Brazil is not as yet self-sufficient in wheat (Triticum aestivum) production and depends on
importa-tion to supply its domestic requirements, wheat has already become an important crop, especially in the south, in the states of Paraná and Rio Grande do Sul. As a winter crop, it is an income-option for farmers who grow soybean or corn in the summer. In 2007, Brazil produced 3.82 million tons of wheat on 1.82 million ha of land, 90% of which was in Rio Grande do Sul and Paraná (Conab, 2008).
Although several types of molecular markers have been employed to evaluate genetic diversity in wheat, such as random amplified polymorphic DNA (RAPD) (Joshi and Nguyen, 1993), restriction fragment-length polymor-phism (RFLP) (Siedleret al, 1994, Kim and Ward, 2000),
amplified fragment-length polymorphism (AFLP) (Barret and Kidwell, 1998, Burkhamer et al., 1998), sequence
tagged-site (STS) (Chenet al., 1994) and inter-simple
se-quence repeat (ISSR) (Devos and Galley, 1992; Nagaoka and Ogihara, 1997), microsatellite markers have been sug-gested as the most informative method for this type of anal-ysis (Röder et al., 1998a, 1998b). Since they are
multi-allelic, chromosome-specific and well distributed in the ge-nome, microsatellite markers have already been used with wheat for selecting specific genes (Penget al., 1999;
Bör-ner et al., 2000), for identifying quantitative trait loci
(QTLs) (Parker et al., 1998) and for molecular
marker-assisted selection (Korzunet al., 1998, Huanget al., 2000).
In species other than wheat, microsatellite markers have also been used to ascertain the genetic purity of seeds (Schusteret al., 2004), as well as a means of protecting
in-tellectual property (Bertini et al., 2006; Schuster et al.,
2006). However, in order to use microsatellite markers as cultivar-identification tools for the protection of intellec-tual-property, for example, it is necessary to know the allelic frequency of informative loci in order to calculate random identity-exclusion probability (Schuster et al.,
2006).
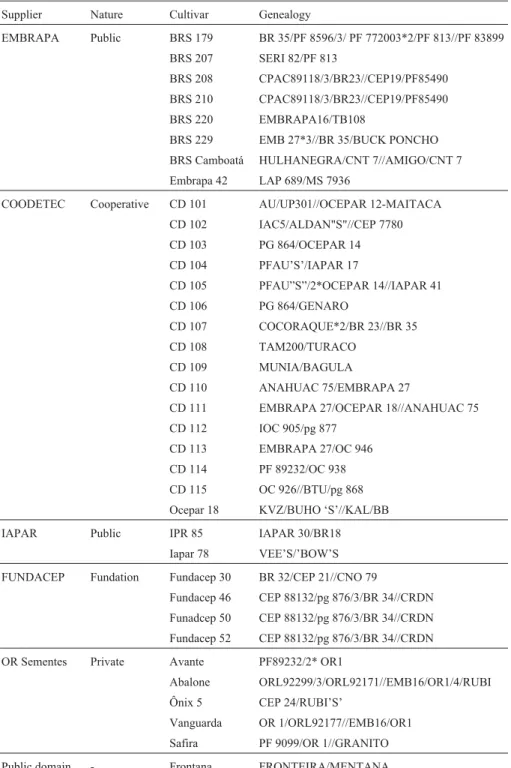
In this work, we evaluated genetic diversity within a representative compilation of the germplasm of Brazilian wheat, in order to assess allelic frequencies in an informa-tive set of microsatellite loci, thereby permitting a more ac-curate identification of varieties of Brazilian wheat. Thirty-six cultivars, developed at various research centers, both private and public, were used (Table 1).
DNA samples were extracted from a thirty-seed bulk of each cultivar, obtained from the Coodetec germplasm www.sbg.org.br
collection. DNA extraction from the seeds was undertaken according to the protocol described by McDonald et al.
(1994), but with certain adjustments. Thirty seeds from each cultivar were ground utilizing a MA 048 mill (Mar-coni), and 50 mg sub-samples of flour collected therefrom. DNA concentration was determined spectrophotometri-cally (Sambrooket al., 1989).
Microsatellite-loci amplification was performed by using DNA samples in a 20mL volume containing 12.5 mM
Tris-HCl (pH 8.3), 62.5 mM KCl, 2.5 mM MgCl2, 125mM
of each of the deoxynucleotides (dATP, dTTP, dGTP e dCTP), 0.4mM of each primer, one unit of Taq DNA poly-merase enzyme and 75 ng of DNA. Amplification was achieved with a 7-min initial step at 94 °C followed by thirty cycles of 1 min at 94 °C, 1 min at 55 °C, 2 min at 72 °C and finally a 7-min step at 72 °C after the 30thcycle.
Amplified fragments were separated and revealed on 7% polyacrylamide denaturing gels stained with silver-nitrate. Table 1- Genealogy and suppliers of wheat cultivars used in the genetic diversity study.
Supplier Nature Cultivar Genealogy
EMBRAPA Public BRS 179 BR 35/PF 8596/3/ PF 772003*2/PF 813//PF 83899
BRS 207 SERI 82/PF 813
BRS 208 CPAC89118/3/BR23//CEP19/PF85490
BRS 210 CPAC89118/3/BR23//CEP19/PF85490
BRS 220 EMBRAPA16/TB108
BRS 229 EMB 27*3//BR 35/BUCK PONCHO
BRS Camboatá HULHANEGRA/CNT 7//AMIGO/CNT 7
Embrapa 42 LAP 689/MS 7936
COODETEC Cooperative CD 101 AU/UP301//OCEPAR 12-MAITACA
CD 102 IAC5/ALDAN"S"//CEP 7780
CD 103 PG 864/OCEPAR 14
CD 104 PFAU’S’/IAPAR 17
CD 105 PFAU”S”/2*OCEPAR 14//IAPAR 41
CD 106 PG 864/GENARO
CD 107 COCORAQUE*2/BR 23//BR 35
CD 108 TAM200/TURACO
CD 109 MUNIA/BAGULA
CD 110 ANAHUAC 75/EMBRAPA 27
CD 111 EMBRAPA 27/OCEPAR 18//ANAHUAC 75
CD 112 IOC 905/pg 877
CD 113 EMBRAPA 27/OC 946
CD 114 PF 89232/OC 938
CD 115 OC 926//BTU/pg 868
Ocepar 18 KVZ/BUHO ‘S’//KAL/BB
IAPAR Public IPR 85 IAPAR 30/BR18
Iapar 78 VEE’S/’BOW’S
FUNDACEP Fundation Fundacep 30 BR 32/CEP 21//CNO 79
Fundacep 46 CEP 88132/pg 876/3/BR 34//CRDN
Funadcep 50 CEP 88132/pg 876/3/BR 34//CRDN
Fundacep 52 CEP 88132/pg 876/3/BR 34//CRDN
OR Sementes Private Avante PF89232/2* OR1
Abalone ORL92299/3/ORL92171//EMB16/OR1/4/RUBI
Ônix 5 CEP 24/RUBI’S’
Vanguarda OR 1/ORL92177//EMB16/OR1
Safira PF 9099/OR 1//GRANITO
The polymorphic information content (PIC) of each microsatellite locus was evaluated through allelic fre-quency:
PIC pij j n = -=
å
1 2 1wherepijrepresents the frequency from thejthallele to the
ithprimer (Andersonet al., 1993).
Genetic relationships among accessions were evalu-ated through a dissimilarity matrix, using the complement of a similarity index for co-dominant and multi-allelic data with the aid of GENES software (Cruz, 2006).
From dissimilarity assessments, cultivars were clus-tered by means of the Tocher optimization method, the hi-erarchical unweighted pair-group method with arithmetic means analysis (UPGMA), Ward’s method and complete and single linkage methods. A cophenetic correlation anal-ysis between the original dissimilarity matrix and the dis-similarity matrices obtained from dendograms was carried out to define the hierarchical clustering method which best represented the original data. Clustering analysis using hi-erarchical methods was undertaken with STATISTICA software (StatSoft Inc Tulsa, OK, USA) and Tocher opti-mization clustering analysis with GENES software (Cruz, 2006).
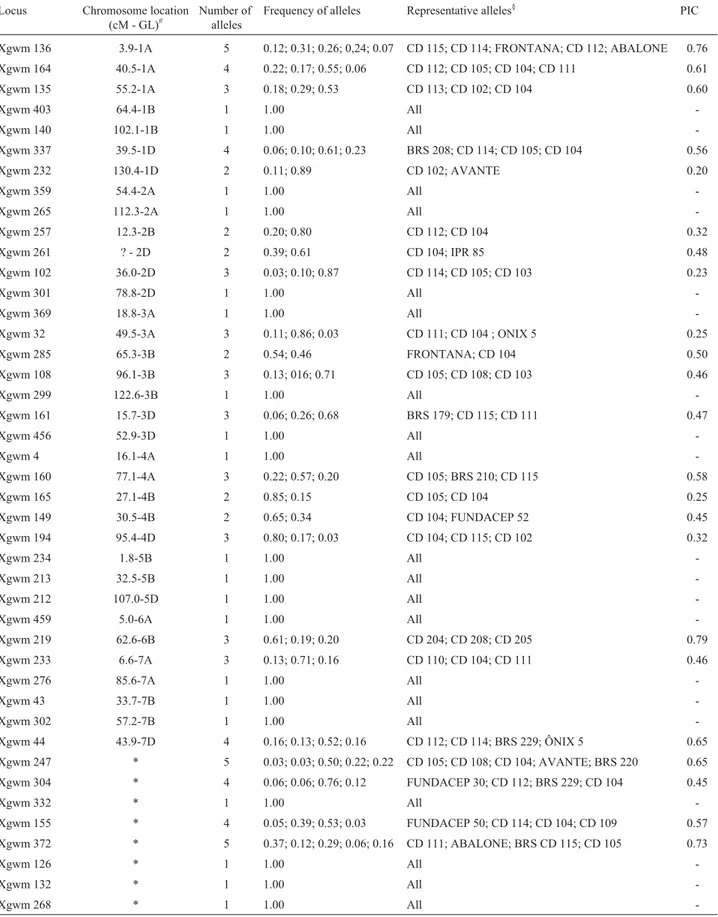
Besides eight unmapped loci (Table 2), 12 genome-A loci, 13 genome-B loci and 10 genome-D loci were evalu-ated. From these 43 loci, 23 presented polymorphisms among the 36 wheat cultivars analyzed (54%). In these 23 polymorphic loci, the numbers of alleles observed per locus ranged from two to five, making a total of 74 alleles, with a mean of 3.2 alleles per locus. PIC values calculated in order to estimate the informativeness of each polymorphic locus, varied from 0.20 to 0.79, with a mean of 0.49 (Table 2).
The variabilities obtained in A, B and D genomes were similar. In genome A, six out of the twelve loci evalu-ated were polymorphic (50%), with 21 alleles (3.5 alleles per locus), whereas, in genome B, seven out of thirteen loci were polymorphic (54%), with 18 alleles (2.6 alleles per lo-cus), and in genome D, six out of ten SSR loci were poly-morphic (60%), with s17 alleles (2.8 alleles per locus).
Among the eight unmapped SSR loci, four were poly-morphic (50%), with 18 alleles (4.5 alleles per locus). PIC values were 0.54; 0.49; 0.38 and 0.60 for A, B and D genomes, as well as the unmapped loci, respectively.
Genetic distances among the cultivars ranged from 0.10, between Ocepar 18 and BRS 207, to 0.88 between CD 101 and Fundacep 46, with a mean distance of 0.48. The highest frequencies of genetic distance occurring between 0.40 and 0.60 (Figure S1, in supplementary material).
Table 1 sets forth the genealogy of the 36 cultivars. A group of three cultivars (Fundacep 46, 50 and 52) and an-other pair of cultivars (BRS208 and 210) could not be dis-tinguished by genealogy. There were 74 different parents in the genealogy of these wheat cultivars, of which a few
par-ticipated in more than one genealogy. From the 630 parent-age coefficients (CP) possible between these 36 cultivars, only 24 were different from zero. Therefore, it was not pos-sible to correctly group these cultivars by genealogy alone.
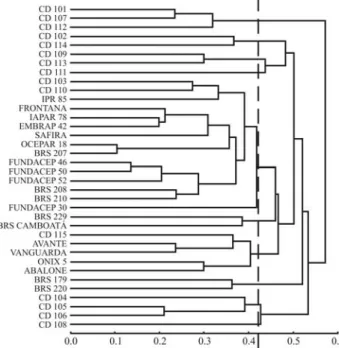
By using molecular markers, it was possible to distin-guish all thirty-six cultivars and group these by genetic sim-ilarity. We used four hierarchical methods. Cophenetic correlations obtained between the original dissimilarity matrix and matrices from dendograms were 67%, 42%, 46% and 53% for the UPGMA, Ward’s, complete-linkage and single-linkage methods, respectively. Due to its higher degree of cophenetic correlation, the UPGMA approach (Figure 1) was chosen for graphical representation of cultivar clusters.
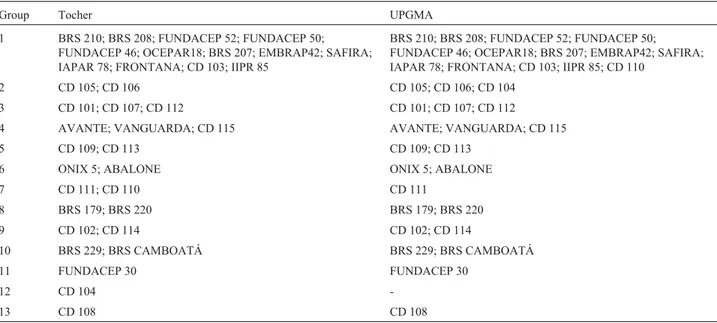
Furthermore, clusters obtained by UPGMA, when a cutoff is at a distance of 0.42, paralleled those obtained by the Tocher optimization method (Table 3). Only two of the 36 cultivars presented some clustering divergence between methods. Cultivar CD 110 was clustered in group 1 by UPGMA and in group 7 by Tocher. Cultivar CD 104, clus-tered in group 2 by UPGMA, remained isolated in group 12 by Tocher. The other 34 cultivars were clustered similarly by both methods, thus indicating a high degree of clustering consistency.
The 13 clusters formed revealed high genetic diver-sity among the wheat cultivars. Group 1, consisting of 13 cultivars by the Tocher method and 14 by the UPGMA, contained cultivars from all origins. The three Fundacep cultivars with the same genealogy (Fundacep 46, 50 and 52) were closely clustered. The two cultivars from Embrapa, with the same genealogy (BRS208 and 210),
Figure 1- Clustering assessment obtained by UPGMA based on
Table 2- Microsatellite markers used in assessment of genetic diversity of Brazilian wheat cultivars.
Locus Chromosome location
(cM - GL)# Number ofalleles Frequency of alleles Representative alleles
§ PIC
Xgwm 136 3.9-1A 5 0.12; 0.31; 0.26; 0,24; 0.07 CD 115; CD 114; FRONTANA; CD 112; ABALONE 0.76
Xgwm 164 40.5-1A 4 0.22; 0.17; 0.55; 0.06 CD 112; CD 105; CD 104; CD 111 0.61
Xgwm 135 55.2-1A 3 0.18; 0.29; 0.53 CD 113; CD 102; CD 104 0.60
Xgwm 403 64.4-1B 1 1.00 All
-Xgwm 140 102.1-1B 1 1.00 All
-Xgwm 337 39.5-1D 4 0.06; 0.10; 0.61; 0.23 BRS 208; CD 114; CD 105; CD 104 0.56
Xgwm 232 130.4-1D 2 0.11; 0.89 CD 102; AVANTE 0.20
Xgwm 359 54.4-2A 1 1.00 All
-Xgwm 265 112.3-2A 1 1.00 All
-Xgwm 257 12.3-2B 2 0.20; 0.80 CD 112; CD 104 0.32
Xgwm 261 ? - 2D 2 0.39; 0.61 CD 104; IPR 85 0.48
Xgwm 102 36.0-2D 3 0.03; 0.10; 0.87 CD 114; CD 105; CD 103 0.23
Xgwm 301 78.8-2D 1 1.00 All
-Xgwm 369 18.8-3A 1 1.00 All
-Xgwm 32 49.5-3A 3 0.11; 0.86; 0.03 CD 111; CD 104 ; ONIX 5 0.25
Xgwm 285 65.3-3B 2 0.54; 0.46 FRONTANA; CD 104 0.50
Xgwm 108 96.1-3B 3 0.13; 016; 0.71 CD 105; CD 108; CD 103 0.46
Xgwm 299 122.6-3B 1 1.00 All
-Xgwm 161 15.7-3D 3 0.06; 0.26; 0.68 BRS 179; CD 115; CD 111 0.47
Xgwm 456 52.9-3D 1 1.00 All
-Xgwm 4 16.1-4A 1 1.00 All
-Xgwm 160 77.1-4A 3 0.22; 0.57; 0.20 CD 105; BRS 210; CD 115 0.58
Xgwm 165 27.1-4B 2 0.85; 0.15 CD 105; CD 104 0.25
Xgwm 149 30.5-4B 2 0.65; 0.34 CD 104; FUNDACEP 52 0.45
Xgwm 194 95.4-4D 3 0.80; 0.17; 0.03 CD 104; CD 115; CD 102 0.32
Xgwm 234 1.8-5B 1 1.00 All
-Xgwm 213 32.5-5B 1 1.00 All
-Xgwm 212 107.0-5D 1 1.00 All
-Xgwm 459 5.0-6A 1 1.00 All
-Xgwm 219 62.6-6B 3 0.61; 0.19; 0.20 CD 204; CD 208; CD 205 0.79
Xgwm 233 6.6-7A 3 0.13; 0.71; 0.16 CD 110; CD 104; CD 111 0.46
Xgwm 276 85.6-7A 1 1.00 All
-Xgwm 43 33.7-7B 1 1.00 All
-Xgwm 302 57.2-7B 1 1.00 All
-Xgwm 44 43.9-7D 4 0.16; 0.13; 0.52; 0.16 CD 112; CD 114; BRS 229; ÔNIX 5 0.65
Xgwm 247 * 5 0.03; 0.03; 0.50; 0.22; 0.22 CD 105; CD 108; CD 104; AVANTE; BRS 220 0.65
Xgwm 304 * 4 0.06; 0.06; 0.76; 0.12 FUNDACEP 30; CD 112; BRS 229; CD 104 0.45
Xgwm 332 * 1 1.00 All
-Xgwm 155 * 4 0.05; 0.39; 0.53; 0.03 FUNDACEP 50; CD 114; CD 104; CD 109 0.57
Xgwm 372 * 5 0.37; 0.12; 0.29; 0.06; 0.16 CD 111; ABALONE; BRS CD 115; CD 105 0.73
Xgwm 126 * 1 1.00 All
-Xgwm 132 * 1 1.00 All
-Xgwm 268 * 1 1.00 All
were also clustered within this group (Figure 1). Of the 18 Coodetec germplasm cultivars, 14 were clustered either in groups containing exclusively Coodetec cultivars or were not clustered together with any other cultivar (groups 2, 3, 5, 7, 9, 12 and 13) at all. Even so, there was high genetic variability among these cultivars themselves, seeing that seven different groups were obtained.
Similarly, there was a tendency for OR cultivars to form unique groups. Group 6 contained OR seeds exclu-sively, and group 4 contained only one cultivar from an-other origin. Of the eight Embrapa cultivars evaluated, four were clustered in group 1 along with others, the remaining four forming two exclusive groups, 8 and 10.
Table 2 shows the frequencies of all alleles revealed in polyacrylamide gels. Since fragment size characteriza-tion is not completely reproducible in this system, a repre-sentative cultivar was placed for each allele, so as to enable recognizing alleles identical to those observed in this work when using these same cultivars in future studies. This is important, especially in cases where it is necessary to de-fine the genetic identity of a certain cultivar. On knowing allele frequency, identity and exclusion probabilities can then be calculated (Schusteret al., 2006).
Results obtained with polymorphic primers in this work were consistent with those reported by other authors. Akkaya and Buyukunal-Bal (2004) obtained PIC values ranging from 0.36 to 0.87, with a mean of 0.68, when evalu-ating 19 SSR highly polymorphic loci in 11 wheat cultivars. Ahmed (2002) observed from two to eight alleles per locus, with a mean of 3.6, in 13 wheat genotypes of diverse origin analyzed with 43 SSR markers. We observed a mean of 3.2 alleles per locus within a range from two to five, and for PIC values ranging from 0.20 to 0.79, a mean of 0.49.
The microsatellite profiles, characterized with 23 pairs of polymorphic markers, showed that the loci em-ployed delineated all the 36 cultivars. Thus, these markers can be used to define the genetic profile of each cultivar. These genetic profiles, or fingerprints, may be useful in the protection of cultivars, for ensuring genetic purity and for generating further information to underpin breeding pro-grams (Bertini et al., 2006). In addition and due to the allelic frequencies obtained in each locus, it is possible to acquire genetic identity and exclusion probabilities in cases involving the protection of intellectual-property (Schuster
et al., 2006).
To date, no evaluation of Brazilian wheat germplasm by using microsatellite markers has been undertaken. The markers applied here were found to be polymorphic, with a potential for germplasm characterization. With this in mind, these should be chosen according to their informa-tiveness and measured by PIC magnitude values.
The results obtained in this study revealed that there is significant genetic divergence among Brazilian wheat cultivars, so that breeding programs can exploit expressive genetic variability by using only adapted germplasm. This observation can be set forth based on molecular data as much as genealogy. However, genealogy cannot group cultivars by genetic similarity, whereas molecular data can do so. Also, our results revealed that cultivars may be grouped according to origin.
On evaluating 23 Brazilian wheat cultivars, Bertanet al.(2006) arrived at similar results. In order to separate
alu-minum-susceptible and -resistant cultivars, these authors obtained four large groups of cultivars, most of which were delineated according to the supplier. Vieiraet al.(2007), on
using AFLP markers to evaluate genetic diversity in an-Table 3- Grouping of 36 wheat cultivars assessed from genetic distances obtained by microsatellite marker data, using Tocher’s and the UPGMA meth-ods.
Group Tocher UPGMA
1 BRS 210; BRS 208; FUNDACEP 52; FUNDACEP 50;
FUNDACEP 46; OCEPAR18; BRS 207; EMBRAP42; SAFIRA; IAPAR 78; FRONTANA; CD 103; IIPR 85
BRS 210; BRS 208; FUNDACEP 52; FUNDACEP 50; FUNDACEP 46; OCEPAR18; BRS 207; EMBRAP42; SAFIRA; IAPAR 78; FRONTANA; CD 103; IIPR 85; CD 110
2 CD 105; CD 106 CD 105; CD 106; CD 104
3 CD 101; CD 107; CD 112 CD 101; CD 107; CD 112
4 AVANTE; VANGUARDA; CD 115 AVANTE; VANGUARDA; CD 115
5 CD 109; CD 113 CD 109; CD 113
6 ONIX 5; ABALONE ONIX 5; ABALONE
7 CD 111; CD 110 CD 111
8 BRS 179; BRS 220 BRS 179; BRS 220
9 CD 102; CD 114 CD 102; CD 114
10 BRS 229; BRS CAMBOATÁ BRS 229; BRS CAMBOATÁ
11 FUNDACEP 30 FUNDACEP 30
12 CD 104
other set of 19 Brazilian wheat cultivars, found that out of 11 cultivars from EMBRAPA, seven did not group closely with any cultivar in the same group, independent of the ori-gin.
Results obtained in this work show that a highly vari-able wheat germplasm has been adapted for use in Brazil. Therefore, it is possible to widely exploit this vast variabil-ity in segregating populations within breeding programs, by simply using only adapted cultivars. The results also provide information on the informativeness of those micro-satellite loci and allelic frequencies that may be applied in evaluating still further the wheat germplasm used in Brazil, as well as in protecting intellectual property.
Acknowledgments
Special thanks go to Coodetec and Unipar for finan-cial support.
References
Ahmed M (2002) Assessment of genomic diversity among wheat genotypes as determined by simple sequence repeats. Ge-nome 45:646-651.
Akkaya MS and Buyukunal-Bal EB (2004) Assessment of genetic variation of bread wheat varieties using microsatellite mark-ers. Euphytica 35:179-185.
Anderson JA, Churchill GA, Autrique JE, Tanksley SD and Sor-rells ME (1993) Optimizing parental selection for genetic linkage maps. Genome 36:181-186.
Barret BA and Kidwell KK (1998) AFLP-based genetic diversity assessment among wheat cultivars from the Pacific North-west. Crop Sci 38:1261-1271.
Bertan I, Carvalho FIF, Oliveira AC, Silva JAG, Benin G, Vieira EA, Silva GO, Hartwig I, Valério IP and Finatto T (2006) Dissimilaridade genética entre genótipos de trigo avaliados em cultivo hidropônico sob estresse por alumínio. Bragantia 65:55-63 (Abstract in English).
Bertini CHCM, Schuster I, Sedyiama T, Barros EG and Moreira MA (2006) Characterization and genetic diversity analysis of cotton cultivar using microsatellite. Genet Mol Biol 29:321-329.
Börner A, Röder MS, Unger O and Meinel A (2000) The detection and molecular mapping of a major gene for non-specific adult plant disease resistance against stripe rust (Puccinia stiiformins) in wheat. Theor Appl Genet 100:1095-1099. Burkhamer RL, Lanning SP, Martens RJ, Martin JM and Talbert
LE (1998) Predicting progeny variance from parental diver-gence in hard red spring wheat. Crop Sci 38:243-248. Chen HB, Martin JM, Lavin M and Talbert LE (1994) Genetic
di-versity in hard red spring wheat based on sequence-tagged-site PCR markers. Crop Sci 34:1628-1632.
Cruz CD (2006) Programa Genes: Biometria. Editora UFV, Vi-çosa, 382 pp.
Devos KM and Galley MD (1992) The use of random amplified polymorphic DNA markers in wheat. Theor Appl Genet 84:567-572.
Huang XQ, Hsam SLK, Zeller FJ, Wenzel G and Mohler V (2000) Molecular mapping of wheat powdery mildew resistance genePm24 and marker validation for molecular breeding. Theor Appl Genet 101:407-414.
Joshi CP and Nguyen HT (1993) RAPD (random amplified poly-morphic DNA) analysis based intervarietal genetic relation-ships among hexaploid wheats. Plant Sci 93:95-103. Kim HS and Ward RW (2000) Patterns of RFLP-based genetic
di-versity in germplasms pools of common wheat whith differ-ent geographical or breeding program origins. Euphytica 115:197-208.
Korzun V, Röder MS, Ganal MW, Worland AJ and Law CN (1998) Genetic analysis of the dwarfing gene (Rht8) in wheat. Part I. Molecular mapping ofRht8on the short arm of chromosome 2D of bread wheat (Triticum aestivum L.). Theor Appl Genet 96:1104-1109.
McDonald MB, Elliot LJ and Sweeney PM (1994) DNA extrac-tion from dry seeds for RAPD analyses in varietal identifica-tion studies. Seed Sci Technol 22:171-176.
Nagaoka T and Ogihara Y (1997) Applicability of inter-simple se-quence repeat polymorphisms in wheat for use as DNA markers in comparison to RFLP and RAPD markers. Theor Appl Genet 94:597-602.
Parker GD, Chalmers KJ, Rathjen AJ and Langride P (1998) Map-ping loci associated with flour colour in wheat (Triticum aestivumL.). Theor Appl Genet 97:238-245.
Peng JH, Fahima T, Röder MS, Li YC, Dahan A, Grama A, Ronin YI, Korol AB and Nevo E (1999) Microsatellite tagging of the stripe-rust resistance gene YrH52 derived from wild emmer wheat,Triticum dicoccoides, and suggestive nega-tive crossover interference on chromosome 1B. Theor Appl Genet 98:862-872.
Röder MS, Korzum V, Gil BS and Ganal MW (1998a) The physi-cal mapping of microsatellite markers in wheat. Genome 41:278-283.
Röder MS, Korzum V, Wendehake K, Plashke J, Tixier MH, Leroy P and Ganal MW (1998b) A microsatellite map of wheat. Genetics 149:2007-2023.
Sambrook J, Fritsch EF and Maniatis T (1989) Molecular Clon-ing: Laboratory Manual. 2nd edition. CSHL, Cold Spring Harbor.
Schuster I, Queiroz VT, Teixeira AI, Barros EG and Moreira MA (2004) Determinação da pureza varietal de sementes de soja com auxílio de marcadores moleculares microssatélites. Pesq Agropec Bras 39:247-253 (Abstract in English). Schuster I, Vieira ESN and Padilha L (2006) Marcadores
mole-culares no pós-melhoramento. In: Caixeta BE (ed) Marca-dores Moleculares. Jard, Viçosa, pp 206-230.
Siedler H, Messmer MM, Schachermeyr GM, Winzeler H, Win-zeler M and Keller B (1994) Genetic diversity in European wheat and spelt breeding material based on RFLP data. Theor Appl Genet 88:994-1003.
Vieira EA, Carvalho FIF, Bertan I, Kopp MM, Zimmer PD, Benin G, Silva JAG, Hartwig I, Malone G and Oliveira AC (2007) Association between genetic distances in wheat (Triticum aestivum L.) as estimated by AFLP and morphological markers. Genet Mol Biol 30:392-399.
Internet Resources
CONAB, Acompanhamento da safra brasileira: grãos: oitavo le-vantamento, maio 2008/Companhia Nacional de Abasteci-mento. Conab, Brasília, 2008. http://www.conab.gov.br. (March 6, 2008).
Supplementary Material
The following online material is available for this ar-ticle:
- Figure S1 - Frequency distribution of genetic dis-tances.
This material is available as part of the online article from http://www.scielo.br/gmb.
Associate Editor: Everaldo Gonçalves de Barros