ASSESSMENT OF EST-SSR MARKERS FOR GENETIC
ANALYSIS ON COFFEE (
1)
ROBSON FERNANDO MISSIO (2); EVELINE TEIXEIRA CAIXETA (2,3*); EUNIZE MACIEL ZAMBOLIM (2); GUILHERME FERREIRA PENA (2); ANA PAULA RIBEIRO (2); LAÉRCIO ZAMBOLIM (2);
ANTÔNIO ALVES PEREIRA (4); NEY SUSSUMU SAKIYAMA (2)
ABSTRACT
EST-SSR markers were used to investigate the genetic diversity among and within coffee populations, to explore the possibility of their use for fingerprinting of cultivars and to assist breeding programs. Seventeen markers, developed from ESTs (Expressed Sequence Tags) from the Brazilian Coffee Genome Project, were used. All markers showed polymorphism among the genotypes assessed. The average number of allele per primer was 5.1. The highest polymorphisms were found within C. canephora (88.2%) and rust-resistant varieties (35.3%). About 29.4% of the markers differentiated C. arabica from Híbrido de Timor; it was also possible to identify those closest and farthest from C. arabica. The analysis of population-grouped genotypes revealed a 64.0% genetic diversity among and a 36.0% genetic diversity within populations. The differentiation index was 0.637. Six markers distinguished four rust-resistance varieties, showing their fingerprinting potential. These results demonstrate the usefulness of EST-SSR markers for cross orientation, in diversity and introgression studies, and in genetic mapping.
Key words: DNA markers, Coffea sp., UPGMA, AMOVA, microsatellite markers.
RESUMO
POTENCIAL DE MARCADORES EST-SSR PARA ANÁLISE GENÉTICA EM CAFÉ
No estudo da diversidade genética entre e dentro de populações de café, foram usados marcadores EST-SSR, visando avaliar seu potencial para identificar cultivares comerciais e assistir programas de melhoramento. Os 17 marcadores utilizados foram desenvolvidos a partir das seqüências ESTs do Projeto Brasileiro do Genoma Café. Em todos os marcadores observou-se polimorfismo entre os genótipos avaliados, com um número médio de 5,1 alelos por primer. Os maiores polimorfismos foram constatados dentro de C. canephora (88,2%) e em variedades resistentes à ferrugem (35,3%). Dos marcadores analisados, 29,4% distinguiram C. arabica dos Híbridos de Timor (HDT), sendo possível identificar os mais próximos e os mais distantes de C. arabica. A análise dos genótipos agrupados por população revelou diversidade genética de 64% entre populações e 36% dentro delas, com um índice de diferenciação de 0,637. Em seis marcadores distinguiram-se quatro variedades resistentes à ferrugem, constando seu potencial para fingerprint. Esses resultados demonstram a utilidade dos EST-SSR para orientações dos cruzamentos e estudos de diversidade, introgressão e mapeamento genético.
Palavras-chave: Marcadores de DNA, Coffea sp., UPGMA, AMOVA, marcadores microssatélites.
(1) Receipt for publication in July 28, 2008 and accepted in April 1.°, 2009.
(2) Universidade Federal de Viçosa, Laboratório de Biotecnologia do Cafeeiro – Biocafé, BIOAGRO, 36570-000 Viçosa (MG) , Brasil. E-mail: [email protected] (*) Correspondent author.
R.F. Missio et al.
Bragantia, Campinas, v.68, n.3, p.573-581, 2009 574
1. INTRODUCTION
The Coffea genus comprises 103 species, of which Coffea arabica L. is commercially the most important (DAVIS et al., 2006). Genetic breeding for this species is limited, due to its narrow genetic base and susceptibility to the main diseases. Thus, the use of molecular markers for genetic diversity studies, crossings orientation and genetic mapping is particularly useful for breeders. Different types of molecular markers, such as RAPD, AFLP, RFLP and SSR, have been used in coffee genetic studies (LASHERMES et al., 2001, COMBES et al., 2000, TEIXEIRA -CABRAL et al., 2004, DINZ et al., 2005, MALUF et al., 2005). New classes of molecular markers have been developed as a result of genome sequencing projects, such an EST-SSR. EST-SSR are microsatellite markers (SSR) developed from ESTs (Expressed Sequence Tags). With the increasing of ESTs datasets, the SSR identification and primer design are done in time and cost-effective manner.
ESTs are sequenced portions of cDNA that are part of a transcribed region of the genome under certain biological conditions. Therefore, ESTs are relatively conserved region of the genome. Because EST-SSR markers are present in conserved not always sequences it is expected that they are less polymorphic compared to genomic SSRs. The main advantages of EST-SSR are their high transferability among phylogenetically related species and even genera and a probability of being associated with functional regions of the genome (PONCET et al., 2006). This marker has been used for different studies such as for evaluating the genetic diversity of grapevine (SCOTT et al., 2000), sugar cane (CORDEIRO et al., 2003) and coffee (AGGARWAL et al., 2007; PONCET et al., 2006), genetic map integration in soybean (SONG et al., 2004) and genetic mapping of wheat (GAO et al., 2004), potato (FEINGOLD et al., 2005) and cotton (HAN et al., 2006).
The characterization of genetic diversity among accessions in germplasm collections is extremely important for breeding programs. Selecting and assessing genotypes in germplasm with SSR markers may optimize and facilitate breeding processes by separating closely related genotypes, thus increasing the efficiency and orientation of future crossings and genetic studies. The current study aimed to investigate the genetic diversity among and within coffee populations, to explore the possibility of using EST-SSR markers for fingerprinting of cultivars, and to estimate genetic distances between
Coffea arabica and Híbrido de Timor genotypes. According to BETTENCOURT (1973), Híbrido de Timor was probably originated from a natural interspecific crossing between C. arabica and C. canephora. This germplasm has been used in breeding programs as a
source of resistant genes against rust, anthracnose, bacteriosis and nematodes. This study will be the basis for selecting genitors to built mapping populations and to develop new cultivars in the C. arabica breeding program.
2. MATERIAL AND METHOD Genetic material
Seventeen accessions were analyzed, including six C. arabica genotypes, five C. canephora
genotypes, three Híbrido de Timor (C. arabica x C. canephora), and three Triploids (C. arabica x C. racemosa). These accessions belong to the ‘Universidade Federal de Viçosa (UFV) / Empresa de Pesquisa Agropecuária de Minas Gerais (EPAMIG)’ genetic breeding program. Six commercial varieties of rust-resistant C. arabica were also analyzed (Table 1).
DNA extraction and EST-SSR primer design DNA was extracted from young leaves, according to the protocol described by DINIZ et al. (2005). DNA quality was analyzed in agarose gel and the quantification was done in a BioRad Smart Spec spectrophotometer. The SSR markers derived from non-redundant EST of the Brazilian Coffee Genome Project. The sequence could not be available due to a confidentiality agreement signed by the institutions involved in this Project. Primers flanking the EST-SSRs were designed using Primer3 (ROZEN and SKALETSKY, 2000) according to the following parameters: primer size ranged 18 to 22 bp (optimum – 20 bp), annealing temperature between 55 and 60ºC (optimum – 57ºC) and amplification product length of 100-300 bp. Seventeen primer pairs were used for the genetic diversity study of the 23 coffee accessions.
PCR amplification and electrophoresis The PCR amplification was done in a final volume of 20 μL containing 50 ng of DNA, 0.6 units of
Table 1. The coffee tree genotypes used for the genetic diversity analysis
Genotypes Species Code
UFV/EPAMIG germplasm bank accessions
UFV 2144 (Catuaí Vermelho IAC 44) Coffea arabica CA 1
Típica UFV 2945 Coffea arabica CA 3
Arábica UFV 10832 Coffea arabica CA 134
Bourbon UFV 2952 Coffea arabica CA 4
Bourbon Amarelo UFV 535-1 Coffea arabica CA 5
Bourbon Amarelo UFV 10745 Coffea arabica CA 135
T 3751 (Robusta) Coffea canephora CC 6
T 3580(Robusta) Coffea canephora CC 7
Conillon UFV 513(Conillon) Coffea canephora CC 8
Guarini UFV 514(Robusta) Coffea canephora CC 9
Apoatã IAC 2258 (Robusta) Coffea canephora CC 10
Híbrido de TimorCIFC 832/2 C. arabica x C. canephora HT 13
Híbrido de Timor CIFC 4106 C. arabica x C. canephora HT 14
Híbrido de Timor CIFC 1343/269 C. arabica x C. canephora HT 15
UFV 557-2 Triploid (C. arabica x C. racemosa) T 131
UFV 557-3 Triploid (C. arabica x C. racemosa) T 132
UFV 557-4 Triploid (C. arabica x C. racemosa) T 133
Rust-resistant varieties
Catiguá MG2 Commercial variety (C. arabica x HT) V 137
IAPAR 59 Commercial variety (C. arabica x HT) V 138
Oeiras MG6851 Commercial variety (C. arabica x HT) V 139
Sacramento MG1 Commercial variety (C. arabica x HT) V 140
Catucai Amarelo 2SL Commercial variety (C. arabica x Icatu vermelho) V 141 Obatã Amarelo IAC 4932 Commercial variety (C. arabica x HT) V 142
HT – Híbrido de Timor(C. arabica x C. canephora).
Statistical analysis
For data analysis, each band was defined as a single character. The allelic data for all genotypes was scored in the form of binary matrix where 1 represented presence and 0 (zero) absence of bands. The genetic distance for all the pairwise combinations was calculated using Jaccard’s similarity coefficient (JACCARD, 1908). A simplified representation of genetic distances was based on a dendrogram obtained from the Unweighted Pair Group Method based on Arithmetic Averages (UPGMA). Thousand bootstrap interations were calculated to test the robustness of the nodes, using the GENES software (CRUZ, 2006).
Genotypes were also grouped into five populations: (1) C. arabica genotypes; (2) C. canephora
genotypes; (3) Híbridos de Timor; (4) triploid hybrids; and (5) commercial varieties of rust-resistant C. arabica. The distance and genetic identity matrix were estimated according to Nei’s coefficient (NEI, 1978)
using PopGene version 1.3 software (YEH and BOYLE, 1997). Analysis of molecular variance (AMOVA) was used to investigate genetic diversity among and within populations (EXCOFFIER et al., 1992), using the GENES software (CRUZ, 2006).
3. RESULTS AND DISCUSSION
R.F. Missio et al.
Bragantia, Campinas, v.68, n.3, p.573-581, 2009 576
Polymorphism among and within Coffea genus species
The 17 EST-SSR primer pairs amplified 87 alleles from 23 coffee genotypes, a mean of 5.12 alleles per primer (Table 2). In a genetic diversity study of 28 accessions of C. arabica and C. canephora, MALUF et al. (2005) used 23 SSR primers, 66 alleles amplified, with an average of 2.87 alleles per locus. PONCET et al. (2006) investigated the level of polymorphism in a set of 25 EST-SSR primers in different species of the Coffea
genus, and found a mean of 10.5 alleles per locus. These findings demonstrate that the total number of alleles in a population depends highly on its size and genetic constitution assessed.
All of the 17 primers investigated showed polymorphism among the 23 genotypes analyzed. The highest level of polymorphism were found within the
C. canephora genotypes (88.2%), and within the six rust-resistant commercial varieties of C. arabica (35.3%). The lowest level of polymorphism (11.8%) was found within the C. arabica genotypes (Table 3). The selfing nature and narrow genetic base of C. arabica may explain the low polymorphism found in this species. Furthermore, EST-SSR markers originated from highly conserved genomic regions, which may present lower degree of polymorphism compared to microsatellites originating from genomic libraries (VARSHNEY et al., 2005).
All primer pairs detected genetic differences among C. arabica and C. canephora populations, and among C. canephora and other populations. This might be due mostly to C. canephora species cross-pollination, which results in high genetic variability. About 29.4% of primers differentiated C. arabica from Híbrido de Timoraccessions. This finding is extremely relevant for breeding programs that use Híbrido de Timoras the main source of rust resistance. These EST-SSR markers may be used for mapping studies of segregating populations derived from crossings between C. arabica and Híbrido de Timor. EST-SSR may also be used efficiently for the saturation and integration of preexisting genetic maps (TEIXEIRA -CABRAL et al., 2004), particularly facilitating QTL identification and marker-assisted selection (AKAFFOU et al., 2003; COULIBALY et al., 2003).
F i v e o f t h e r u s t - r e s i s t a n t c o m m e r c i a l varieties derived from crossings between C. arabica
and Híbrido de Timor (Table 1). Many selection cycles, aimed at obtaining a higher number of homozygotic loci and maintaining cultivar genetic homogeneity, were undertaken to launch these commercial varieties. However, the primers that were investigated were polymorphic among the rust-resistant commercial varieties and the C. arabica (35.3%) and Híbrido de Timor (47.1%)
accessions, indicating the potential of this class of molecular markers in variety identification studies and in genetic fingerprinting.
Six EST-SSR primers (EST-SSR 007, 010, 012, 013, 023, 029) of the 17 analysed differentiated the commercial coffee varieties Catiguá MG2, IAPAR 59, Oeiras MG6851 and Sacramento MG1 (four of six varieties). No primer was able to genetically distinguished Catucai Amarelo 2SL and Obatã Amarelo 4932 from the other varieties. A minor introgression of C. canephora may have contributed to the polymorphism among the rust-resistant cultivars.
Cluster analysis
The dendrogram obtained based on Jaccard’s genetic similarity matrix (Figure 1), taking into account all genotypes individually, generated three groups: (I)
C. arabica genotypes, the commercial rust-resistant varieties, Híbrido de Timor accessions and triploid genotypes; (II) C. canephora genotypes ‘T 3751’, ‘T 3580’, ‘Apoatã IAC 2258’ and ‘Guarini UFV 514’; (III) C. canephora ‘Conillon UFV 513’. Group I was subdivided into arbitrary three groups: (a) C. arabica genotypes, Híbrido de Timor accessions and five commercial varieties (Catucai Amarelo 2SL, Obatã Amarelo IAC 4932, Sacramento MG1, Oeiras MG6851 and IAPAR 59); (b) Triploid genotypes; and (c) the Catiguá MG2 variety. The commercial varieties remained genetically closer to C. arabica genotypes. The triploid individuals composed an intermediate group between tetraploid genotypes (C. arabica, Híbrido de Timor and cultivated varieties) and diploid genotypes (C. canephora).
C. canephora ‘T 3751’, ‘T 3580’, ‘Apoatã IAC 2258’ and ‘Guarini UFV 514’ belong to the Robusta group, and were genetically grouped closer to the commercial varieties and to the Híbrido de Timor accessions rather than to the ‘Conillon UFV 513’ group genotype. This may suggest that the rust-resistance genes in commercial varieties result from genomic introgressions of Robusta group genotypes.The dendrogram (Figure 1) made possible to identify the Híbrido de Timor accessionsthat are closer and more distant from C. arabica genotypes. This data is extremely significant for breeding programs to incorporate one or more C. canephora disease resistance genes, while maintaining the remaining C. arabica
traits. In this case, the genetically closest Híbrido de Timoraccession to C. arabica should be chosen, as the Híbrido de Timor ‘CIFC 1343/269’. On the other hand, genetically divergent genitors are more appropriate if the priority is to increase the genetic base of the breeding program. Thus crossing the most divergent
EST-SSR markers for genetic analysis of
Coffea
Bragantia, Campinas, v.68, n.3, p.573-581, 2009
Marker Motif Expected Observed Tm Number cDNA libraries Number
size (pb) size (pb) of alleles of reads
EST-SSR 005 (CA)7 170 175 -190 58 3 Embriogenic callus; Non embriogenic callus 2
EST-SSR 007 (GTC)5 155 118 -175 58 10 Water deficit stresses field plants (pool of tissue) 2
EST-SSR 010 (TG)7(TA)4//(GT)9 152 218 - 283 51 11 Flower buds; Mature leaves from plagiotropic branches; 4
Stems infected with Xyllella spp.
EST-SSR 012 (CA)7(AC)3 118 118 -125 53 4 Stems infected with Xyllella spp.;Young leaves from orthotropic 4
branches; Non embriogenic callus
EST-SSR 013 (CA)9 141 278 - 295 52 3 Plantlets and leaves treated with arquidonic acid; Suspension 4
cells treated with BION and brassinoesteroids
EST-SSR 023 (TA)15 207 200 - 238 58 5 Stems infected with Xyllella spp.; Embriogenic callus 2
EST-SSR 025 (AT)7 108 100 - 127 53 3 Embriogenic callus; Hypocotyls treated with BION 2
EST-SSR 027 (AT)3(AC)4(AT)9 259 265 - 300 53 6 Hypocotyls treated with BION; Embriogenic callus; Flower buds 7
EST-SSR 029 (AT)10 169 170 - 180 48 6 Embriogenic callus with 2,4D; Primary embriogenic callus 2
EST-SSR 047 (CAA)5N3(CTG)6 178 183 - 200 52 7 Mature leaves from plagiotropic branches 2
EST-SSR 048 (AAG)6N9(TGA)4 126 155 - 165 54 4 Mature leaves from plagiotropic branches 2
EST-SSR 054 (TAT)7 184 227 - 253 53 4 Suspension cells stressed with aluminum; Suspension cells 2
with BION
EST-SSR 055 (TAT)5 167 185 - 197 52 4 Flower buds; Leaves infected with leaf miner and 2
coffee leaf rust
EST-SSR 057 (TTA)6 132 150 - 190 51 4 Stems infected with Xyllella spp.; Hypocotyls treated 4
with BION; Leaves treated with arquidonic acid
EST-SSR 058 (AAT)4 201 215 - 280 52 4 Embriogenic callus; Suspension cells treated with BION 2
EST-SSR 069 (GCG)6 101 105 -128 53 3 Leaves infected with leaf miner and rust; Stems 5
with Xyllella spp.;Suspension cells with NaCl; Embriogenic callus
EST-SSR 073 (CGC)2(GGC)5 160 160 - 175 54 6 Stems infected with Xyllella spp. 3
Suspension cells treated with BION
-R.F. Missio et al.
Bragantia, Campinas, v.68, n.3, p.573-581, 2009 578
Table 3. Percentage of polymorphic loci among (above the diagonal) and within (along the diagonal) populations
Populations C. arabica C. canephora Híbrido de Timor Triploids Varieties
C. arabica 11.8(4.0)* 100.0 29.4 47.1 35.3
C. canephora - 88.2(3.3) 100.0 100.0 100.0
Híbrido de Timor - - 23.53(3.2) 58.8 47.1
Triploids - - - 23.5(3.7) 52.9
Varieties - - - - 35.3(3.7)
* Values in parenthesis are the mean number of alleles per polymorphic locus in each population.
Figura 1. Dendrogram obtained by the UPGMA method from genetic distances expressed as Jaccard complements, estimated among the 23 coffee tree genotypes, based on EST-SSR markers. Cofenetic correlations: 0.98; stress: 9,1%.
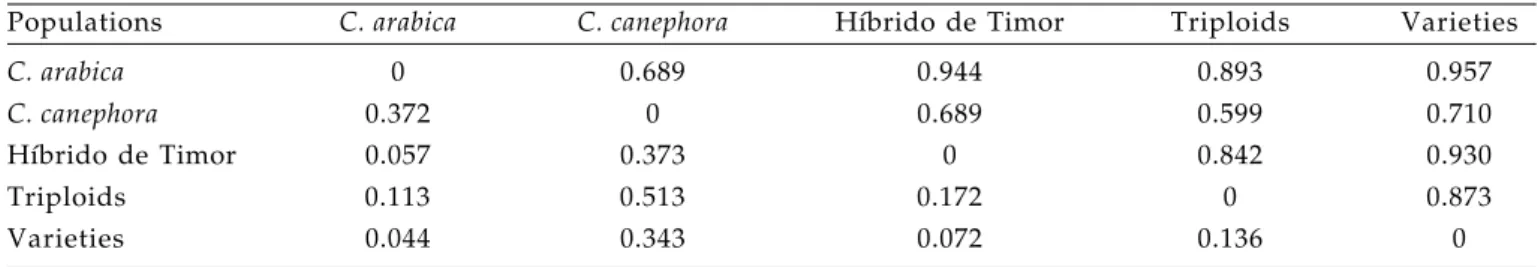
Analysis of genotypes grouped according to each population (Table 4 and Figure 2) revealed that the commercial varieties and the Híbrido de Timor accesionswere genetically highly similar to C. arabica
genotypes. The lowest genetic similarity values were found between the Triploid and C. canephora
genotypes.
The genetic similarity coefficients for each population are shown in figure 3. The highest genetic similarity coefficients were found within C. arabica
(0.94), Híbrido de Timor(0.93) and Triploid genotypes (0.91). C. canephora genotypes showed the lowest genetic similarity coefficient (0.54), which demonstrates the wide genetic variability of this
species. Notwithstanding the low polymorphism found within C. arabica, Híbrido de Timor, Triploid and commercial variety populations, the EST-SSR markers used in this study were effective for differentiating these populations.
Genetic diversity among and within the Coffea genus
The genetic diversity study revealed that about 64% of variation was found among populations, and 36% within these populations (Table 5). SILVEIRA et al. (2003), in a genetic diversity study of C. arabica
decreased genetic diversity to the many selection cycles done on genotypes. Similarly, ANTHONY et al. (2001), using 29 RAPD primers to study genetic diversity among and within natural C. arabica
Table 5. Analysis of molecular variance (Amova) among and within coffee populations
Source of variation df Sum of squares Variation component % variation
Among populations 4 133.59 6.59 63.66*
Within populations 18 67.66 3.76 36.34
Total 22 201.26 10.35
-*FST = 0.637
Figura 3. Mean genetic similarity coefficient within each population (vertical lines above each bar are the standard deviation values).
populations collected in Ethiopia, found a FST of 0.375. In the current study, EST-SSR markers effectively detected a high rate of genetic polymorphism among the sample populations, as revealed by a FST of 0.637.
Table 4. Measures of genetic distance (below the diagonal) and genetic identity (above the diagonal)
Populations C. arabica C. canephora Híbrido de Timor Triploids Varieties
C. arabica 0 0.689 0.944 0.893 0.957
C. canephora 0.372 0 0.689 0.599 0.710
Híbrido de Timor 0.057 0.373 0 0.842 0.930
Triploids 0.113 0.513 0.172 0 0.873
Varieties 0.044 0.343 0.072 0.136 0
R.F. Missio et al.
Bragantia, Campinas, v.68, n.3, p.573-581, 2009 580
4. CONCLUSION
The EST-SSR markers used in this study showed a relative high degree of polymorphism, efficient to study genetic diversity in coffee trees. In addition, it was showed that it is possible to use these EST-SSRs for coffee variety identification studies. Through these SSR markers, the most distant Híbrido de Timoraccessions(CIFC 832/2 and CIFC 4106) from
C. arabica genotypes were identified; these may be used to increase the genetic base of breeding programs. The Híbrido de Timor ‘CIFC 1343/269’ was found to be closest to the arabica coffees, it may, thus, be useful for breeding programs to incorporate one of more C. canephora rust-resistance genes while maintaining other C. arabica traits. Our data showed that EST-SSR markers may be useful in coffee breeding programs, particularly for crossings orientation, diversity studies, genetic introgression and genetic mapping.
ACKNOWLEDGMENTS
We wish to acknowledge the Conselho Nacional de Desenvolvimento Científico e Tecnológico (CNPq), the Coordenação de Aperfeiçoamento de Pessoal de Nível Superior (CAPES), the Fundação de Amparo a Pesquisa do Estado de Minas Gerais (FAPEMIG) and the Consórcio Brasileiro de Pesquisa e Desenvolvimento do Café (CBP&D) for funding.
REFERENCES
AGGARWAL, R.K.; HENDRE, P.S.; VARSHNEY, R.K.; BHAT, P.R.; KRISHNAKUMAR, V.; SINGH, L. Identification, characterization and utilization of EST-derived genic microsatellite markers for genome analyses of coffee and related species. Theoretical and Applied Genetics, v. 114, p.359-372, 2007.
AKAFFOU, D.S.; KY, C.L.; BARRE, P.; HAMON, S.; LOUARN, J.; NOIROT, M. Identification and mapping of a major gene (Ft1) involved in fructification time in the interspecific cross Coffea pseudozanguebariae x C. liberica var. Dewevrei: impact on caffeine content and seed weight. Theoretical and Applied Genetics, v. 106, p.1486-1490, 2003.
ANTHONY, F.; BERTRAND, B.; QUIROS, O.; WILCHES, A.; LASHERMES, P.; BERTHAUD, J.; CHARRIER, A. Genetic diversity of wild coffee (Coffea arabica L.) using molecular markers. Euphytica, v.118, p.53-65, 2001.
BETTENCOURT, A. Considerações gerais sobre o “Híbrido de Timor”. Campinas: Instituto Agronômico, 1973. (Circular 31)
COMBES, M.C.; ANDRZEJEWSKI, S.; ANTHONY, F.; BERTRAND, B.; ROVELLI, P.; GRAZIOSI, G.; LASHERMES, P. Characterization of microsatellite loci in Coffea arabica and related coffee species. Molecular Ecology, v.9, p.1171-1193, 2000.
CORDEIRO, G.M.; PAN, Y.B.; HENRY, R.J. Sugarcane microsatellites for the assessment of genetic diversity in sugarcane germplasm. Plant Science, v.165, p.181-189, 2003.
COULIBALY, I.; LOUARN, J.; LORIEUX, M.; CHARRIER, A.; HAMON, S.; NOIROT, M. Pollen viability restoration in a Coffea canephora P. and C. heterocalyx Stoffelen backcross. QTL identification for marker-assisted selection. Theoretical and Applied Genetics, v.106, p.311-316, 2003.
CRESTE, S.; TULMANN-NETO, A.; FIGUEIRA, A. Detection of simple sequence repeat polymorphisms in denaturing polyacrilamide sequencing gels by silver staining. Plant Molecular Biological Report, v.4, p.299-306, 2001.
CRUZ, C.D. Genes versão 2006.4.1: Programa GENES versão Windows. Viçosa: Editora UFV, 2006.
DAVIS, A.P.; GOVAERTS, R.; BRIDSON, D.M.; STOFFELEN, P. An annotated taxonomic conspectus of the genus Coffea (Rubiaceae). Botanical Journal of the Linnean Society, v.152, p.465-512, 2006.
DINIZ, L.E.C.; SAKIYAMA, N.S.; LASHERMES, P.; CAIXETA, E.T.; OLIVEIRA, A.C.B.; ZAMBOLIM, E.M.; LOUREIRO, M.E.; PEREIRA, A.A.; ZAMBOLIM, L. Analysis of AFLP marker associated to the Mex-1 resistance locus in Icatu progenies. Crop Breeding and Applied Biotechnology, v.5, p.387-393, 2005.
EXCOFFIER, L.; SMOUSE, P.E.; QUATTRO, J.M. Analysis of Molecular Variance Inferred From Metric Distances Among DNA Haplotypes: Application to Human Mitochondrial DNA Restriction Data. Genetics, v.131, p.479-491, 1992.
FEINGOLD, S.; LLOYD, J.; NORERO, N.; BONIERBALE, M.; LORENZEN, J. Mapping and characterization of new EST-derived microsatellites for potato (Solanum tuberosum L.).
Theoretical and Applied Genetics, v.111, p.456-466, 2005.
GAO, L.F.; JING, R.L.; HUO, N.X.; LI, Y.; LI, X.P.; ZHOU, R.H.; CHANG, X.P.; TANG, J.F.; MA, Z.Y.; JIA, J.Z. One hundred and one new microsatellite loci derived from ESTs (EST-SSRs) in bread wheat. Theoretical and Applied Genetics, v.108, p.1392-400, 2004.
HAN, Z.; WANG, C.; SONG, X.; GUO, W.; GOU, J.; LI, C.; CHEN, X.; ZHANG, T. Characteristics, development and mapping of Gossypium hirsutum derived EST-SSRs in allotetraploid cotton.
Theoretical and Applied Genetics, v.112, p.430-439, 2006.
JACCARD, P. Nouvelles recherches sur la distribution florale. Bulletin de la Societé Vanddoise des Sciences Natureles, v.44, p.223-270, 1908.
LASHERMES, P.; COMBES, M.C.; PRAKASH, N.S.; TROUSLOT, P.; LORIEUX, M.; CHARRIER, A. Genetic linkage map of Coffea canephora: effect of segregation distortion and analysis of recombination rate in male and female meioses. Genome,
v.44, p.589-596, 2001.
NEI, M. Estimation of average hetrozygosity and genetic distance from a small number of individuals. Genetics, v.89, p.583-590, 1978.
PONCET, V.; RONDEAU, M.; TRANCHANT, C.; CAYREL, A.; HAMON, S.; DE KOCHKO, A.; HAMON, P. SSR mining in coffee tree EST databases: potential use of EST-SSRs as markers for the Coffea genus. Molecular and Genetics Genomics, v.276, p.436-449, 2006.
ROZEN, S.; SKALETSKY, H.J. Primer3 on the WWW for general users and for biologist programmers. In: Krawetz S, Misener S (eds) Bioinformatics Methods and Protocols: Methods in Molecular Biology.Humana Press, p.365-386, 2000.
SCOTT, K.D.; EGGLER, P.; SEATON, G.; ROSSETTO, M.; ABLETT, E.M.; LEE, L.S.; HENRY, R.J. Analysis of SSRs derived from grape ESTs. Theoretical and Applied Genetics, v.100, p.723-726, 2000.
SILVEIRA, S.R.; RUAS, P.M.; RUAS, C.F.; SERA, T.; CARVALHO, V.P.; COELHO, A.S.G. Assessment of genetic variability within and among coffee progenies and cultivars using RAPD markers. Genetics and Molecular Biology, v.26, p.329-336, 2003.
SONG, Q.J.; MAREK, L.F.; SHOEMAKER, R.C.; LARK, K.G.; CONCIBIDO, V.C.; DELANNAY, X.; SPECHT, J.E.; CREGAN, P.B. A new integrated genetic linkage map of the soybean.
Theoretical and Applied Genetics, v.109, p.122-128, 2004.
TEIXEIRA-CABRAL, T.A.; SAKIYAMA, N.S.; ZAMBOLIM, L.; PEREIRA, A.A.; BARROS, E.G.; SILVA, D.S. Characterization of differential coffee tree hosts for Hemileia vastatrix Berk. et Br. with RAPD markers. Crop Breeding and Applied Biotechnology, v.4, p.68-73, 2004.
VARSHNEY, R.K.; GRANER, A.; SORRELLS, M.E. Genic microsatellite markers in plants: features and applications.
Trends in Biotechnology, v.23, p.48-55, 2005.
VIEIRA, L.G.E; ANDRADE, A.C.; COLOMBO, C.A. et al. Brazilian coffee genome project: an EST-based genomic resource. Brazilian Journal of Plant Physiology, v.18, p.95-108, 2006.
YEH, F.C.; BOYLE, T.J.B. Population genetic analysis of co-dominant and co-dominant markers and quantitative traits.