Rev. Caatinga
AGRONOMIC CHARACTERISTICS OF THE PACOVAN ORGANIC BANANA IN
IRRIGATION SYSTEMS IN THE AÇU
-
RN VALLEY
1JÚLIO JUSTINO DE ARAÚJO2*, VANDER MENDONÇA3, MARIA FRANCISCA SOARES PEREIRA4, MATHEUS DE FREITAS SOUZA3
ABSTRACT- The banana tree is grown in an extensive tropical region throughout the world, usually by small producers. The present work had the objective of evaluating irrigation systems in banana production in the Açu -RN Valley, aiming at alternatives so that they can be recommended to farmers in the Açu Valley region. The experiment was carried out in the area of the School Farm of the IFRN Campus Ipanguaçu, located in the municipality of Ipanguaçu-RN. The experiment was carried out in a randomized complete block design with subdivided plots and eight replications. The irrigation systems were: irrigation, drip irrigation, micro sprinkler and alternative irrigation. The plots were composed of eight useful plants with spacing in double rows 4 x 2 x 2 m. Eight characteristics related to production were evaluated: bunch mass (MC); number of leaves (NP); number of fruits per cluster (NFC); mean mass of the leaves (MMP); diameter of the fruit of the second seed (DF2P); length of the fruit of the second seed (CF2P); mean fruit mass (MMF); productivity (Prod). The data were submitted to analysis of variance and the means were compared by the Tukey test at 5% of probability. In the first cycle of production the sprinkler irrigation system was the one that presented better results the productivity of the Pacovan banana tree; in the 3rd cycle the alternative irrigation system was the one that showed better results the productivity of the banana tree; where the electrical conductivity correlated with the sodium adsorption ratio in the irrigation water, contributed to a moderate limitation of use.
Keywords: Fruit crop. Agroecology. Water management. Organic fertilization.
CARACTERÍSTICAS AGRONÔMICAS DA BANANEIRA ORGÂNICA ‘PACOVAN’ EM SISTEMAS DE IRRIGAÇÃO NO VALE DO AÇU-RN
RESUMO- A bananeira é cultivada em uma extensa região tropical em todo mundo, geralmente por pequenos produtores. O presente trabalho teve o objetivo de avaliar sistemas de irrigação na produção de banana no Vale do Açu-RN, visando alternativas para que possam ser recomendados aos agricultores da região do Vale do Açu. O experimento foi realizado na área da Fazenda Escola do IFRN Campus Ipanguaçu, localizado no município de Ipanguaçu-RN. O ensaio foi conduzido por um período de três ciclos de produção, em delineamento de blocos casualizados com parcelas subdivididas e oito repetições, sendo representados por quatro sistemas de irrigação: aspersão, gotejamento, microaspersão e alternativo. As parcelas foram constituídas de oito plantas úteis com espaçamento em fileiras duplas 4 x 2 x 2 m. Foram avaliadas oito características relacionadas à produção: massa do cacho (MC); nº de pencas (NP); nº de frutos por cacho (NFC); massa média das pencas (MMP); diâmetro do fruto da segunda penca (DF2P); comprimento do fruto da segunda penca (CF2P); massa média de frutos (MMF); produtividade média (Prod). Os dados foram submetidos a análise de variância e as médias foram comparadas pelo teste de Tukey a 5% de probabilidade. No 1º ciclo de produção o sistema de irrigação por aspersão foi o que apresentou melhores resultados a produtividade da bananeira Pacovan; no 3º ciclo o sistema de irrigação alternativo foi o que mostrou melhores resultados a produtividade da bananeira; onde a condutividade elétrica correlacionada com a razão de adsorção do sódio na água de irrigação, contribuiram para moderada limitação de uso.
Palavras-chave: Fruticultura. Agroecologia. Manejo de água. Adubação orgânica.
_________________
*Corresponding author
1Received for publication in 12/15/2016; accepted in 06/26/2017.
Extracted from the first author's Doctor's thesis.
2Instituto Federal de Educação, Ciência e Tecnologia do Rio Grande do Norte, Ipanguaçu, RN, Brazil; julio_justino@hotmail.com. 3Department of Plant Science, Universidade Federal Rural do Semi-Árido, Mossoró, RN, Brazil; vanderm2000@hotmail.com, freitasouza@yahoo.com.br.
Rev. Caatinga
INTRODUCTION
Banana is grown in tropical regions throughout the world, usually by small producers. In Brazil, banana is planted in all states, including several ecosystems, and is the fourth largest produce and the seventh most exported fruit in the country. Each year, an estimated 99,216 tons are produced, generating 35.57 million US dollars (MARQUES, 2013).
In the State of Rio Grande do Norte, banana production is concentrated in the lower Açu irrigated district (DIBA) and in the area of the Del Monte company, a region between the municipalities of Assú, Ipanguaçu, Alto do Rodrigues, and Carnaubais. These municipalities produce 86,000 tons of banana per year, representing 50% of the total production in this state (IBGE, 2016).
Among banana cultivars planted in the Açu-RN Valley, the cultivar “Grand Naine” of the Cavendish sub-group is mostly produced by the company Del Monte and destined for the foreign market. On the other hand, the cultivar “Pacovan” of the sub-group Prata is cultivated by small and medium producers, mainly in the DIBA, and serves the local and regional markets in the states Rio Grande do Norte, Ceará, and Paraíba.
All banana cultivars have similar nutrition properties and are consumed throughout the world. Recently, the consumer market has started to demand pesticide-free products, mainly of agroecological
origin (SANTOS, 2010). However, it is necessary to increase the yields of these systems, which could be achieved by adjusting fertilization rates, spacing between plants, and irrigation types. In this context, this study considered banana cultivation on an ecological basis, providing not only a research environment, but also a demonstration unit for students and banana producers in the region. The present work aimed to analyze irrigation systems in the organic banana production in the Açu-RN region.
MATERIAL AND METHODS
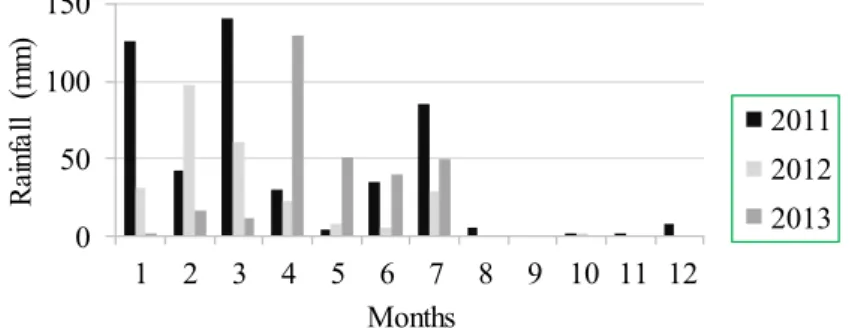
Climatic dataThe experiment was carried out in the area of the IFRN Campus, Ipanguaçu School Farm, in the municipality of Ipanguaçu-RN (5 ° 32 '0.85 "south latitude, west longitude 36 ° 53' 1, 11 "), at an elevation of 16 m above sea level. The soil was classified as a Neosol, and the climate is BSwh according to the classification of Koeppen. Monthly precipitation data were collected from the automatic meteorological station of the IFRN Campus Ipanguaçu during the period from 2011 to 2013 (Figure 1).
Monthly temperature data, provided through the automatic meteorological station of the IFRN Campus Ipanguaçu, was obtained for the period from 2011 to 2013 (Figure 2).
0 50 100 150
1 2 3 4 5 6 7 8 9 10 11 12
R
ai
nf
a
ll
(m
m
)
Months
2011
2012
2013
Source: Meteorological Station of the IFRN Campus Ipanguaçu.
Figure 1. Monthly rainfall in 2011 to 2013.
0.00 5.00 10.00 15.00 20.00 25.00 30.00 35.00
1 2 3 4 5 6 7 8 9 10 11 12
T
em
per
at
ur
e
(º
C
)
Months
2011
2012
2013
Source: Meteorological Station of the IFRN Campus Ipanguaçu.
Rev. Caatinga
Monthly data on relative air humidity, provided through the automatic meteorological station of the IFRN Campus Ipanguaçu, was obtained for the period from 2011 to 2013 (Figure 3).
Monthly data on net radiation, provided through the automatic meteorological station of the IFRN Campus Ipanguaçu, was obtained for the period from 2011 to 2013 (Figure 4).
0.00 10.00 20.00 30.00 40.00 50.00 60.00 70.00 80.00
1 2 3 4 5 6 7 8 9 10 11 12
A
ir
h
um
id
it
y
(%
)
Months
2011
2012
2013
Figure 3. Monthly air humidity in 2011 to 2013.
Source: Meteorological Station of the IFRN Campus Ipanguaçu.
0.00 5.00 10.00 15.00 20.00 25.00 30.00 35.00
1 2 3 4 5 6 7 8 9 10 11 12
Ir
ra
d
ia
tio
n
(W
.m
-2)
Months
2011
2012
2013
Figure 4. Monthly solar irradiation in 2011 to 2013.
Source: Meteorological Station of the IFRN Campus Ipanguaçu.
Soil analysis
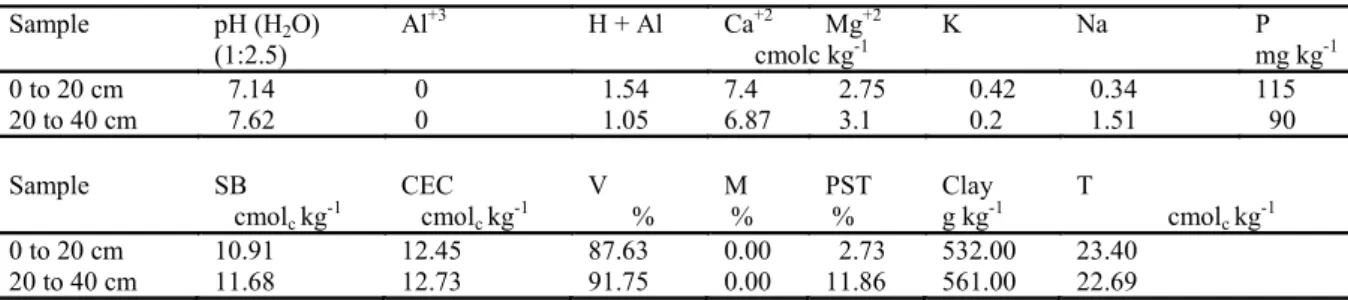
Soil sampling was carried out via mechanical tracing, following the protocols of the (EMBRAPA, 2006). We sampled the depths 0 to 20 cm and 20 to 40 cm and analyzed the chemical characteristics in 2010 and 2011 (Tables 1 and 2). In 2012, we only
sampled and analyzed the depth 0 to 20 cm (Table 3).
Water analysis and planting
Analysis of the Amazon well water supplying water to the banana irrigation system (Table 4).
Table 1. Result of soil chemical analysis, conducted in Aug / 2010.
Sample pH (H2O) Al+3 H + Al Ca+2 Mg+2 K Na P
(1:2.5) cmolc kg-1 mg kg-1
0 to 20 cm 7.14 0 1.54 7.4 2.75 0.42 0.34 115
20 to 40 cm 7.62 0 1.05 6.87 3.1 0.2 1.51 90
Sample SB CEC V M PST Clay T
cmolc kg-1 cmolc kg-1 % % % g kg-1 cmolc kg-1
0 to 20 cm 10.91 12.45 87.63 0.00 2.73 532.00 23.40
20 to 40 cm 11.68 12.73 91.75 0.00 11.86 561.00 22.69
Rev. Caatinga
Table 2. Result of soil chemical analysis, conducted in May/2011.
Sample pH (H2O) Al+3 H + Al Ca+2 Mg+2 K Na P
1 : 2.5 cmolc kg-1 mg kg-1
0 to 20 cm 7.9 0 0 7.44 2.69 0.69 1.34 150
20 to 40 cm 7.57 0 0 8.75 3.25 0.59 1.3 123
SB CEC V M PST Clay T
Sample cmolc kg-1 cmolc kg-1 % % % g kg-1 cmolc kg-1
12.16 12.16 100.00 0.00 11.02 532.00 22.86
0 to 20 cm 13.89 13.89 100.00 0.00 9.36 561.00 24.76
20 to 40 cm
SB - Sum of bas e; CEC - Cation Exchange Capability; V - Base Saturation (Eutrophic); M - Aluminum saturation; PST - Percent Changeable Sodium (20 to 40 cm - Solodic); T - Activity of the clay fraction (Tb - clay of low activity).
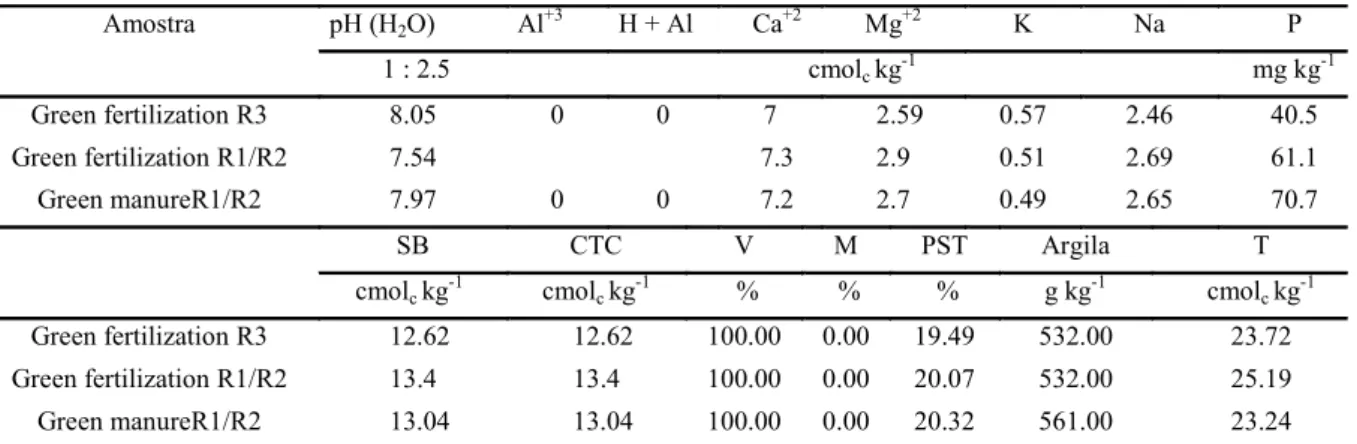
Table 3. Result of soil chemical analysis, conducted in May/2012.
Amostra
pH (H2O) Al +3
H + Al Ca+2 Mg+2 K Na P
1 : 2.5 cmolc kg-1 mg kg-1
Green fertilization R3 8.05 0 0 7 2.59 0.57 2.46 40.5
Green fertilization R1/R2 7.54 7.3 2.9 0.51 2.69 61.1
Green manureR1/R2 7.97 0 0 7.2 2.7 0.49 2.65 70.7
SB CTC V M PST Argila T
cmolc kg-1 cmolc kg-1 % % % g kg-1 cmolc kg-1
Green fertilization R3 12.62 12.62 100.00 0.00 19.49 532.00 23.72
Green fertilization R1/R2 13.4 13.4 100.00 0.00 20.07 532.00 25.19
Green manureR1/R2 13.04 13.04 100.00 0.00 20.32 561.00 23.24
SB - Sum of bas e; CEC - Cation Exchange Capability; V - Base Saturation (Eutrophic); M - Aluminum saturation; PST - Percent Changeable Sodium (20 to 40 cm - Solodic); T - Activity of the clay fraction (Tb - clay of low activity).
Table 4. Result of water analysis of the amazon well during January to April 2015.
Date of the collected pH C.E. Na Ca + Mg RAS
dS m-1 mmolc dm-3
20/01/2015
8.61 1.25 5.71 3.61 4.25
05/02/2015
7.40 1.21 7.31 3.61 5.44
12/03/2015
8.67 1.12 6.63 3.61 4.93
24/04/2015
7.56 1.14 4.06 3.61 3.02
Laboratory of Soils and Water of IFRN Campus Ipanguaçu.
C3 - Water with high salinity (EC between 0.75 and 2.25 dS m-1); IEC of irrigation water with moderate degree of use restriction (0.7 to 3.0 dS m-1) - C3S1, Bernardo et al. (2009); RAS = 3 to 6 and CEi = 1.2 to 0.3, moderate degree of use restriction (AYRES; WESTCOT, 1985).
Planting was carried out through rhizomes that were removed from selected seedlings of the horn type. Cleaning and disinfection of the rhizomes were performed to ensure phytosanitary quality, which is common practice in agroecological production. The hydrothermal treatment was carried out with water at 50ºC for 20 minutes for the control of the larvae of the "moleque da bananeira". Subsequently, the rhizomes were immersed in a 20%
sodium hypochlorite solution for 20 minutes to control bacterial diseases and the rhizome pieces were planted in the nursery with a spacing of 20 x 20 cm and at a depth of 15 cm. Sowing was prepared with 80 liters per m2 of a compound, homogenized
Rev. Caatinga Green fertilization
Soil preparation was carried out through two cross gradations, aimed at the planting of green fertilizers, followed by the demarcation of the land and the sub-division of the 32 plots with a dimension of 12 x 12 m, identifying the plots for the planting of green manure in the first cycle (Table 5).
At 90 days after planting, the green manure plants reached the flowering stage, and mechanized brushing was performed, followed by two cross
gradations for the incorporation of green manure. At 15 days after the incorporation of the green manure, 1,000 kg ha-1 of MB-4 rock meal and 500 kg ha-1 of
organic Agrobom biofertilizer were applied to the plots. The demarcation of the area was carried out, identifying the blocks and plots. The rhizomes were planted in double rows with a spacing of 4 x 2 x 2 m. The pits presented dimensions of 40 x 40 x 40 cm; in each pit, carnauba straw and bovine manure were placed.
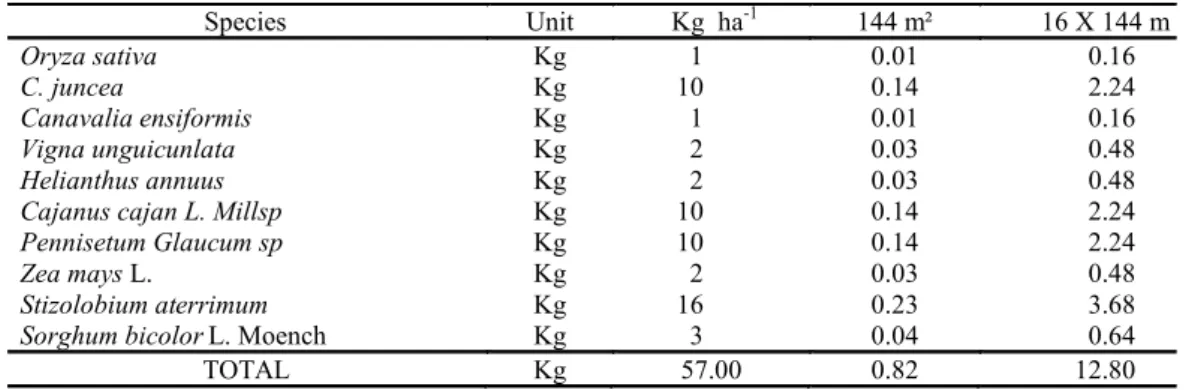
Table 5. Crop species used in the planting of the cocktail for green manure.
Species Unit Kg ha-1 144 m² 16 X 144 m
Oryza sativa Kg 1 0.01 0.16
C. juncea Kg 10 0.14 2.24
Canavalia ensiformis Kg 1 0.01 0.16
Vigna unguicunlata Kg 2 0.03 0.48
Helianthus annuus Kg 2 0.03 0.48
Cajanus cajan L. Millsp Kg 10 0.14 2.24
Pennisetum Glaucum sp Kg 10 0.14 2.24
Zea mays L. Kg 2 0.03 0.48
Stizolobium aterrimum Kg 16 0.23 3.68
Sorghum bicolor L. Moench Kg 3 0.04 0.64
TOTAL Kg 57.00 0.82 12.80
Planting of the green manure was carried out with seeds from 10 plant species, which were seeded in grooves with a spacing of 0.50 m after the mixing of 34 grams of the mixture for each row over 12 m (2,833 g m-1).
The MB-4 rock meal is a natural product derived from previously selected rocks; it contains
all necessary nutrients to meet the requirements of plants and microorganisms, producing well-nourished, healthy, and appropriate crops
without pests and diseases.
Therefore, MB-4 flour can improve soil quality based on nutrients such as magnesium, calcium, iron, phosphorus, potassium, and sulfur and micronutrients such as copper, zinc, manganese, and cobalt. The silica present in MB-4 increases the resistance of the plants to pests and diseases.
The nutrients contained in MB-4 react with the soil solution, releasing essential elements for the development of soil microorganisms, favoring plant health.
Agrobom biofertilizer is a compound with the
following composition: N 23.1%, P 4.23%, K 34.37%, Ca 37.2, Mg 15.84%, and S 4.57%
(manufacturer data).
After the planting of the green manure, a conventional sprinkler irrigation system was installed for complementary irrigation during the first semester of 2010.
Compost was prepared using 50% of bovine manure and 50% of carnauba straw, used for base fertilization during the months of September to October 2010, with a dosage of 10 liters per cot, homogenized with 20 cm of surface soil.
Fertilization in the pits was carried out semi-annually, using a dosage of 9 liters per clump.
After the planting and scrubbing of the green manure, the irrigation systems was installed according to the treatments (sprinkling, micro aspersion, and alternative). The pits were opened manually. However, in the other block, due to the high compaction, the pits needed to be opened with the help of a tractor. The irrigation system was installed in five sub-areas, using two records to balance the flows.
The seedlings were planted in polyethylene bags and remained in the nursery for another four months. Subsequently, they were planted out in March 2011.
After a cultivation period of one year, the seedlings were fertilized with compost, using a
dosage of 9 liters per clump. From November 2012 onwards, fertilization with tanned
manure was performed every six months, using 9 liters per clump. The used dosage corresponds to 10 tons ha-1 year-1, with 130 kg ha-1 year-1 of
nitrogen. In addition to the fertilization with tanned manure, every 90 days, the companion plants were worked into the soil for cover fertilization, along with the stubbles of the cultured plants.
Irrigation
We used the following treatments: 1) A drip irrigation system was installed with two lateral lines for each row of banana, with drippers installed every 1.0 m and a flow rate of 2 L h-1; 2) a micro-sprinkler
Rev. Caatinga
for two banana rows, with micro sprinklers installed at a spacing of 6 x 4 m and a flow rate of 55 L h-1; 3)
a sprinkler irrigation system was installed with one lateral line for each plot, with a spacing of 12 x 12 m and a flow rate of 597 L h-1; 4) an alternative
irrigation system was installed with one lateral line for two banana rows, with a spacing of 6 x 2 m and a
flow rate of 120 L h-1.
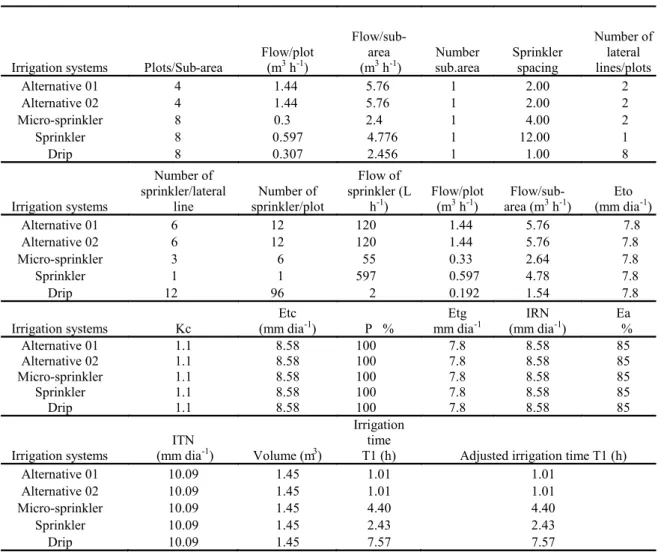
The irrigation management was based on data from the automatic weather station of the IFRN Campus, which calculated the bi-weekly reference evapotranspiration by the Penman-Monteith Method - FAO/56 (ALLEN et al., 1998) (Table 6).
Table 6. Calculation of irrigation management for the second fortnight of September/2012.
Irrigation systems Plots/Sub-area
Flow/plot (m3 h-1)
Flow/sub-area (m3 h-1)
Number sub.area
Sprinkler spacing
Number of lateral lines/plots Alternative 01 4 1.44 5.76 1 2.00 2 Alternative 02 4 1.44 5.76 1 2.00 2 Micro-sprinkler 8 0.3 2.4 1 4.00 2 Sprinkler 8 0.597 4.776 1 12.00 1
Drip 8 0.307 2.456 1 1.00 8
Irrigation systems
Number of sprinkler/lateral
line
Number of sprinkler/plot
Flow of sprinkler (L
h-1)
Flow/plot (m3 h-1)
Flow/sub-area (m3 h-1)
Eto (mm dia-1) Alternative 01 6 12 120 1.44 5.76 7.8 Alternative 02 6 12 120 1.44 5.76 7.8 Micro-sprinkler 3 6 55 0.33 2.64 7.8 Sprinkler 1 1 597 0.597 4.78 7.8 Drip 12 96 2 0.192 1.54 7.8
Irrigation systems Kc
Etc
(mm dia-1) P %
Etg mm dia-1
IRN (mm dia-1)
Ea %
Alternative 01 1.1 8.58 100 7.8 8.58 85
Alternative 02 1.1 8.58 100 7.8 8.58 85
Micro-sprinkler 1.1 8.58 100 7.8 8.58 85
Sprinkler 1.1 8.58 100 7.8 8.58 85
Drip 1.1 8.58 100 7.8 8.58 85
Irrigation systems
ITN
(mm dia-1) Volume (m3)
Irrigation time
T1 (h) Adjusted irrigation time T1 (h)
Alternative 01 10.09 1.45 1.01 1.01
Alternative 02 10.09 1.45 1.01 1.01
Micro-sprinkler 10.09 1.45 4.40 4.40
Sprinkler 10.09 1.45 2.43 2.43
Drip 10.09 1.45 7.57 7.57
Eto - Reference evapotranspiration (mm dia-1); Kc - Coefficient of culture; Etc - Evapotranspiration of the crop (mm day-1); P - Percentage of wet area (%); Ea - Irrigation efficiency (%).
The cultivation coefficient (Kc) of 0.5, 0.85, and 1.1 was considered for Stages I, II, and III respectively. Stage I represented the period between seedling emergence up to 10% of the surface cover (CSS), Stage II from 10% of CSS to 80% of CSS, and Stage III from 80% of CSS to 100% of CSS (including fruits) (DOORENBOS et al., 1979). The Kc was considered for stages I to III, since stages IV and V also coincide with stages I, II, and III of offspring plants. For the irrigation management, the same volume of water was calculated for all treatments of the respective irrigation systems for September 2012 (Table 7).
Statistical analysis
The experiment was performed in a DBC - a randomized block design with sub-divided plots. The blocks were subdivided into four plots (irrigation systems), with eight replications per plot; we used Tukey´s test with a 5% probability in SISVAR (FERREIRA, 2011).
Rev. Caatinga
RESULTS AND DISCUSSION
In the first production cycle of the cultivar 'Pacovan', bunch mass, mean bunch mass, average fruit mass, and productivity were significantly different between the irrigation systems at 5% probability (Table 8).
Sprinkler and drip irrigation systems
presented slightly higher production parameters than micro-sprinkler irrigation systems, especially the alternative system. This is justified by the fact that it allows a higher wetting factor, accelerating the decomposition of the stubble. Companion plants favored root development and nutrient use efficiency, being was inversely proportional to micro -sprinkler and alternative irrigation systems.
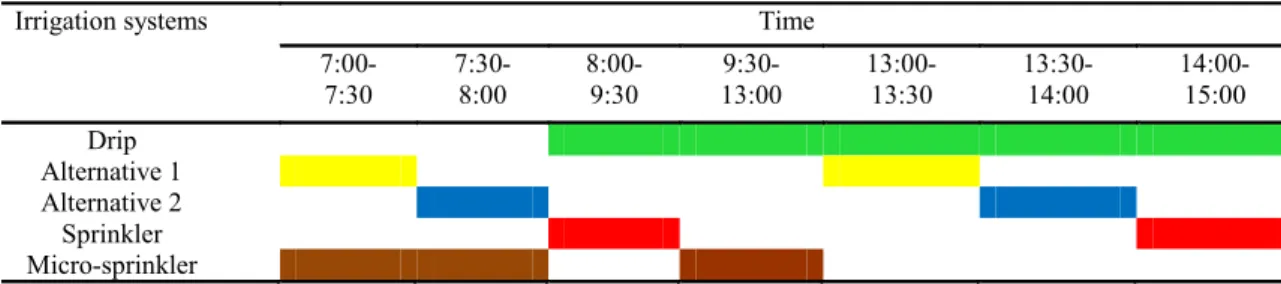
Table 7. Irrigation management adopted for the second half of September/2012.
Irrigation systems Time
7:00-7:30
7:30-8:00
8:00-9:30
9:30-13:00
13:00-13:30
13:30-14:00
14:00-15:00
Drip Alternative 1 Alternative 2 Sprinkler Micro-sprinkler
Table 8. Mean values of cluster mass (MC); Number of leaves (NP); Number of fruits per cluster (NFC); Mean mass of the
leaves (MMP); Diameter of the fruit of the second seed (DF2P); Length of the fruit of the second seed (CF2P); Mean fruit mass (MMF); Average productivity (yield).
Irrigation systems Treatments
MC kg
NP NFC MMP
kg
DF2P cm
CF2P cm
MMF G
Yield kg ha-1 Sprinkler 14.55a 6.90 88.64 1.88a 3.46 15.40 151.25ª 24,240.30a Drip 13.71a 6.93 90.32 1.76ab 3.33 15.03 137.50ab 22,840.86a Micro-sprinkler 11.83ab 6.86 86.77 1.51b 3.30 14.08 122.50b 19,708.78ab Alternative 9.52b 6.17 77.13 1.32b 3.20 13.91 112.50b 15,662.57b Mean 12.40** 6.72ns 85.72ns 1.62* 3.32ns 14.61ns 130.94** 20,662.57**
CV 20.23 3.02 6.09 20.33 6.97 8.95 16.92 20.23
Values followed by the same letter do not differ statistically from each other by Tukey Test (P <0.05). ** = P <0.01; * = P <0.05. CV: Coefficient of variation.
In the second production cycle of 'Pacovan', the agronomic traits evaluated did not present significant differences among the irrigation systems (Table 9). The micro-sprinkler and alternative irrigation systems presented slightly lower results than the other systems, due to the fact that the soil
wetting factor was restricted, contributing to reduced decomposition of the stubble and the companion plants, thereby impairing root system development and decreasing water and nutrients, which resulted in decreased crop development.
Table 9. Mean values of cluster mass (MC); Number of leaves (NP); Number of fruits per cluster (NFC); Mean mass of the
leaves (MMP); Diameter of the fruit of the second seed (DF2P); Length of the fruit of the second seed (CF2P); Mean fruit mass (MMF); Average productivity (yield).
Irrigation systems Treatments
MC kg
NP NFC MMP
kg
DF2P cm
CF2P cm
MMF g
Yield kg ha-1 Sprinkler 13.46 6.95 93.88 1.55 3.28 16.58 115.00 22,424.36 Drip 12.19 7.06 95.65 1.69 3.48 16.99 122.50 20,308.54 Micro-sprinkler 12.09 6.73 88.90 1.33 3.10 15.79 105.00 20,141.94 Alternative 10.38 7.12 95.86 1.51 3.32 16.43 112.50 17,293.08 Mean 12.03ns 6.97 93.57ns 1.52ns 3.30ns 16.45ns 113.75ns 20,041.98ns
CV 23.60 2.95 4.68 20.72 10.67 7.12 18.65 23.60
Rev. Caatinga
In the third production cycle of 'Pacovan', only the variable number of fruits per cluster (NFC) presented a significant difference at 5% probability, in sprinkler, drip, micro sprinkler and alternative irrigation systems, did not differ statistically (Table 10). In terms of productivity, our values were higher than those found by Fernandes et al. (2008), who evaluated the yield of the banana cultivar 'Prata Anã' irrigated with a drip system, with two lateral lines per plant row over a period of 10 years, and obtained
an average productivity of 18.2 Mg ha-1.
However, our values are comparable with those of Nunes et al. (2008), who reported that banana yields under conventional, highly technological,
fertilizer-intensive, and systematic pest and disease control conditions can exceed 30 Mg ha-1. Pereira et
al. (2000), evaluating the growth and production of 'Prata Anã' banana in a conventional system irrigated by a micro-sprinkler in the first cycle at different spacings, reported a productivity of 29.1 Mg ha-1.
The authors obtained a higher number of pence (9 pence), with a mean number of 6.86 pence. In terms of bunch mass, we obtained a mean value of 11.71 kg (average of the three cycles), while the authors obtained a bunch mass of 18.1 kg, which was probably a result of the different soil types and climatic conditions.
Table 10. Mean values of cluster mass (MC); Number of leaves (NP); Number of fruits per cluster (NFC); Mean mass of
the leaves (MMP); Diameter of the fruit of the second seed (DF2P); Length of the fruit of the second seed (CF2P); Mean fruit mass (MMF); Average productivity (yield).
Irrigation systems
Treatments
MC kg
NP NFC MMP
kg
DF2P cm
CF2P cm
MMF g
Yield kg ha-1
Sprinkler 14.17 7.29 101.60ab
1.75 3.26 17.26 135.00 23,607.22
Drip 12.83 6.94 94.66ab
1.66 3.29 17.01 122.50 21,374.78
Micro-sprinkler 11.19 6.86 89.59b 1.43 3.16 16.29 117.50 18,642.54
Alternative 13.98 7.38 102.76ª 1.71 3.29 17.11 123.75 23,290.68 Mean 13.04ns 7.12ns 97.15** 1.64ns 3.25ns 16.92ns 124.69ns 21,728.81ns
CV 20.39 3.62 4.94 17.47 4.63 6.00 20.03 20.39
Values followed by the same letter do not differ statistically from each other by Tukey Test (P <0.05). ** = P <0.01; * = P <0.05. CV: Coefficient of variation.
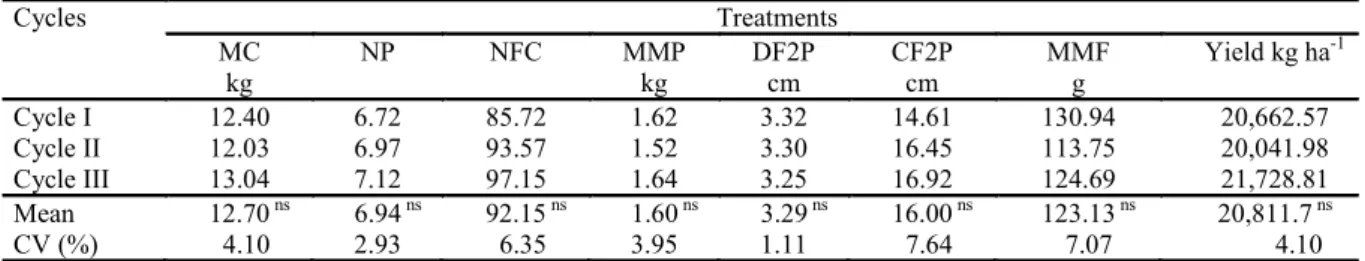
Mean overall production during three cultivation cycles did not differ significantly at 5% probability (Table 11). Bunch mass in the first cycle and bunch number in the third cycle were higher in plants cultivated with a sprinkler system compared to
plants under drip irrigation. This indicates that the variability of these characters is not only genetic, but can be impacted by environmental parameters (ORTIZ, 1995; ORTIZ; VUYLSTEKE, 1998) and management.
Table 11. Average of the characters evaluated in the production: bunch mass (MC); Number of leaves (NP); Number of
fruits per cluster (NFC); Mean mass of the leaves (MMP); Diameter of the fruit of the second seed (DF2P); Length of the fruit of the second seed (CF2P); Mean fruit mass (MMF); Average productivity (yield).
Cycles Treatments
MC kg
NP NFC MMP
kg
DF2P cm
CF2P cm
MMF g
Yield kg ha-1
Cycle I 12.40 6.72 85.72 1.62 3.32 14.61 130.94 20,662.57
Cycle II 12.03 6.97 93.57 1.52 3.30 16.45 113.75 20,041.98
Cycle III 13.04 7.12 97.15 1.64 3.25 16.92 124.69 21,728.81
Mean 12.70 ns 6.94 ns 92.15 ns 1.60 ns 3.29 ns 16.00 ns 123.13 ns 20,811.7 ns CV (%) 4.10 2.93 6.35 3.95 1.11 7.64 7.07 4.10
Values followed by the same letter do not differ statistically from each other by Tukey Test (P <0.05). ** = P <0.01; * = P <0.05. CV: Coefficient of variation.
The higher values of vegetative and yield characteristics in the system using sprinklers compared to drip irrigation may be a result of the larger wet area (COSTA et al., 2008), which provides greater distribution of the root system (DONATO et al., 2010; SANT'ANA, 2011).
Sant'ana (2011) evaluated the distribution of the root system and the water extraction in the
cultivar 'Prata-Anã' in the first and second cycle growth phases and showed highest root density and root length values under drip irrigation compared to systems using sprinklers, which indicates that drip systems provide water at greater soil depths, facilitating root development at greater depths.
Rev. Caatinga
reduced at electrical conductivity (EC) values between 1.12 and 1.25 dS m-1, classified as C3 - high
salinity water (AYRES; WESTCOT, 1985); in addition, the sodium adsorption ratio (RAS) also played a role (Table 4). Sodium adsorption ratio values (RAS) between 3 and 6 and electrical conductivity (EC) values between 1.2 and 0.3 caused a reduction in water infiltration into the soil, contributing to a slight or moderate degree of restriction of irrigation water use. Considering the toxicity of sodium (Na) with RAS values between 3.02 and 5.44, it causes a slight or moderate restriction of irrigation water use.
CONCLUSIONS
In the first production cycle, highest productivity of the banana cultivar “Pacovan” was obtained using the sprinkler irrigation system. In the third production cycle, the alternative irrigation system showed higher productivity values. Electrical conductivity, correlated with the sodium adsorption ratio in the irrigation water, contributed to a moderate restriction of irrigation water use.
REFERENCES
ALLEN, R. G. et al. Crop evapotranspiration: Guidelines for computing crop water requirements. Rome: FAO, 1998. 300 p. (Irrigation and Drainage Paper, 56).
AYRES, R. S.; WESTCOT, D. W. Water quality for agriculture (Revised). Rome: FAO, 1985. 174 p. (Irrigation and Drainage Paper, 29).
BERNARDO, S. et al. Manual de irrigação. 8. ed. Viçosa, MG: UFV, 2009. 625 p.
COSTA, E. L. et al. Irrigação da bananeira. Informe Agropecuário, Belo Horizonte, v. 29, n. 245, p. 38 -46, 2008.
DONATO, S. L. R. et al. Estado nutricional de bananeiras tipo Prata sob diferentes sistemas de irrigação. Pesquisa Agropecuária Brasileira, Brasília, v. 45, n. 9, p. 980-988, 2010.
DOORENBOS, J. et al. Yield response to water. Rome: FAO. 1979. 193 p. (Irrigation and Drainage Paper, 33).
EMPRESA BRASILEIRA DE PESQUISA AGROPECUÁRIA - EMBRAPA. Sistema Brasileiro de classificação de solos. 2. ed. Rio de Janeiro, RJ: Embrapa Solos, 2006. 412 p.
FERNANDES, L. A. et al. Fertilidade do solo, nutrição mineral e produtividade da bananeira irrigada por dez anos. Pesquisa Agropecuária Brasileira, Brasília, v. 43, n. 11, p. 1575-1581, 2008.
FERREIRA, D. F. Sisvar: A computer statistical analysis system. Ciência e Agrotecnologia, Lavras, v. 35, n. 6, p. 1039-1042, 2011.
INSTITUTO BRASILEIRO DE GEOGRAFIA E ESTATÍSTICA - IBGE. Produção agrícola municipal. Disponível em: <http:// www.ibge.gov.br>. Acesso em: 16 de jan. 2016.
MARQUES, E. S. Secretaria de Relações Internacionais do Agronegócio. Ministério da Agricultura, Pecuária e Abastecimento. In AgroStat Brasil, com dados da SECEX/MDIC, Brasília, 2013.
NUNES, W. A. G. A. et al. Características químicas de solos da região de Janaúba, MG, irrigados com água de poços tubulares e do Rio Gorutuba. Revista Brasileira de Ciência do Solo, Viçosa, v. 32, n. 7, p. 227-236, 2008.
ORTIZ, R. Plot techniques for assessment of bunch weight in banana trials under two systems of crop management. Agronomy Journal, Ibadan, v. 87, n. 1, p. 63-69, 1995.
ORTIZ, R.; VUYLSTEKE, D. Quantitative variation and phenotypic correlations in banana and plantain. Scientia Horticulturae, Amsterdam, v. 72, n. 3-4, p. 239-253, 1998.
PEREIRA, M. C. T. et al. Crescimento e produção de primeiro ciclo da bananeira prata anã (AAB) em sete espaçamentos. Pesquisa Agropecuária Brasileira, Brasília, v. 35, n. 7, p. 1377-1387, 2000. SANT’ANA, J. A. V. Distribuição de raízes de bananeira ‘prata-anã’ sob diferentes sistemas de
irrigação em condições semi-áridas. 2011. 79 f. Dissertação (Mestrado em Recursos Hídricos: Área de Concentração em Sistemas Agrícolas) -Universidade Federalde Lavras, Lavras, 2011.
SANTOS, S. C. L. Pesquisa participativa na avaliação de armadilhas e controle populacional
de Cosmopolites sordidus. 2010. 140 f. Tese
(Doutorado em Agronomia: Área de Concentração em Fitotecnia) – Universidade Federal Rural do Semi -Árido, Mossoró, 2010.