ISSN: 1809-4430 (on-line) www.engenhariaagricola.org.br
2 São Paulo State University/ UNESP – Jaboticabal – São Paulo, Brazil. 3 University of Sorocaba/ UNISO – Sorocaba – São Paulo, Brazil.
Received in: 12-14-2017 Accepted in: 5-31-2018
Doi: http://dx.doi.org/10.1590/1809-4430-Eng.Agric.v38n4p568-576/2018
POSITION ERRORS IN SOWING IN CURVED AND RECTILINEAR ROUTES
USING AUTOPILOT
Adão F. dos Santos
1*, Lígia N. Correa
2, Lucas A. S. Gírio
2, Carla S. S. Paixão
3, Rouverson P. da Silva
21*Corresponding author. São Paulo State University/UNESP - Jaboticabal – São Paulo, Brazil. E-mail: [email protected]
KEYWORDS
precision agriculture,
peanut, GNSS,
parallelism, RTX.
ABSTRACT
The use of automatic routing significantly increases the yield and quality of agricultural
operations and reduces the overlap rates between the mechanized set passes during the
operation. The objective of this study was to analyse the quality of peanut sowing using
automatic routing in two paths, curved and rectilinear, based on the error of parallelism
and execution error, through statistical process control. The maps used came from an area
of peanut seed production, in the city of Luzitânia, São Paulo, Brazil. The sowing was
carried out by the execution of a project elaborated in CAD software that, for its
elaboration, was taken into consideration the working width of the seeder-fertilizer, as
well as the spacing of the crop. The CenterPoint RTX signal was used on both routes. The
errors were measured in the Agrocad
®program, by means of the orthogonal difference
between the lines, and the execution errors were calculated based on the difference
between the previously projected lines and the lines executed by the tractor. In general,
the sowing operation presented better quality in the rectilinear path, providing smaller
parallelism and execution errors. The maximum errors of parallelism were 8.75 and 5.22
cm in the curved and rectilinear path, respectively. The RTX signal ensured good quality
of operation in rectilinear path, with low probability of errors occurrence above 3.8 cm.
INTRODUCTION
The profile of agriculture has been making major technological advances in several parts of the world, making use of precision agriculture techniques such as; Global Satellite Navigation Systems (GNSS), Geographic Information Systems (GIS), performance monitors, distant and proximal remote sensors, as well as variable rate applications (Robertson et al., 2012) reducing input costs and minimizing environmental degradation (Tey & Mark, 2012).
Among the precision agriculture techniques automatic orientation is the best known to farmers, because of the benefits it offers in relation to the machines manual orientation (Holpp et al., 2013; Stoll & Kutzbach, 2000), can be used in various operations, from sowing to harvesting (Batte & Ehsani, 2006; Bergtold et al., 2009; Oksanen, 2015; Roberson & Jordan, 2014; Xiu, et al., 2010).
The use of auto orientation can be through paid signals (greater precision) or free (less precision) signals. The kinematic relative positioning method, using Real Time Kinematic (RTK), has good precision and acceptability
among farmers. The method requires a base with known latitude and longitude near to the machine, which guarantees at least 2.5 cm accuracy (Baio & Moratelli, 2011), within 10 km (Pérez-Ruiz & Upadhyay, 2012). Despite the established benefits of this positioning method, Brazilian peanut growers have not adopted it because of the high initial investment, which directly impacts the cost of production, together with the rental price of the land, which can represent up to 18% of the total costs (Barbosa et al.,
2014).
However, Ortiz et al. (2013) and Vellidis et al.
(2014) found that the use of RTK autopilot on sowing and peanut ripening results in substantial gains in productivity and economic returns in the states of Alabama and Georgia in the United States. In Brazil, Santos et al. (2016a) also verified that the alignment of sowing with the cutter reduces the loss rates and parallelism errors in the peanut crop.
vehicle (Gomez-Gil et al., 2011), by filtering the GPS data using Kalman filter (Han et al., 2002; Mousazadeh, 2013), and by extremely accurate algorithms, such as Trimble’s Real Time eXtend (RTX) signal, which uses the precise point-positioning (PPP) method provided by satellite to service subscribers. In general, this method uses the observables (phase and / or pseudo range) of a single receiver, making use of accurate ephemeris, satellite clock corrections and models for the various physical phenomena that affect observations, in order to obtain solutions with accuracy at the level of a few centimetres (Rocha et al., 2017).
The RTX signal is recent in agriculture, and to use this method only one GNSS receiver is required in the machine, without the use of a base near to the rover, which makes the RTX an interesting alternative for mechanizable agricultural operations. Its operation consists of several reference bases distributed across the globe that send the information, via the internet, to a central, where these are processed and performed calculations of positioning errors to guarantee the accuracy of the system. Then the correction is sent to a geostationary satellite that retransmits to all the receivers that are within reach, which in turn make the correction of the positioning of the machines in the field, with guarantee precision of ± 3.8 cm, according to the supplier of the sign (Trimble, 2017). This signal was evaluated by Rizos et al. (2012) and Santos et al. (2017) where it guaranteed horizontal accuracy of 4 cm in 95% of the observations with a time of initiation of 1 minute. Carballido et al. (2014) also demonstrated the efficiency of the signal in autonomous vehicles in rectilinear path.
However, there are no reports of the use and precision of the RTX signal in the sowing operation in curved paths, and a study is necessary to show its efficiency in this type of route since the axis implement does not accompany the wheel front axis, which may lead to greater occurrence of errors between the passes of the mechanized set. The objective of this study was to evaluate the quality of peanut sowing, based on positioning errors (parallelism and execution), in curved and rectilinear paths using statistical process control tools.
MATERIAL AND METHODS
Place of experiment
The experiment was conducted in the farm Santa Candida, a municipality of Luzitânia, São Paulo, Brazil, located near the geographic coordinates 21°06’39” S and
48°14’09” W using the Geodetic System WGS84 reference
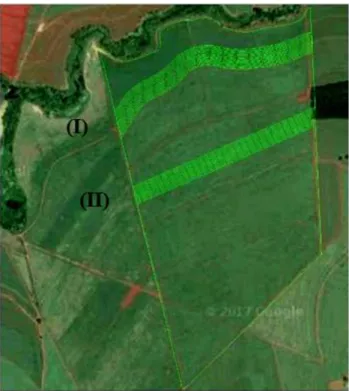
(Figure 1). The average to altitude and slope was 540 m and 2.5%, respectively, with climate Aw according to the Koppen classification. The cultivar used was the Runner 886, sown with 0.90 m between rows, in soil of clayey texture (EMBRAPA, 2013).
FIGURE 1. Sample area, curved path (I) and rectilinear path (II).
Description of the treatments used, and characteristics evaluated
The sowing project was carried out using the AgroCAD® software (Tecgraf, Campinas, São Paulo,
Brazil). The project considered the working width of the sower as well as the spacing of the culture, in which the lines for guidance of the autopilot were spaced 3.60 m apart.
In sowing, a John Deere tractor, model 6110J, with a displacement speed of 5 km h-1 and a seeder-fertilizer
PHT4 Suprema, were regulated to obtain a seeding density of 21 seeds per metre. The seeder had coupling at the third point of the tractor, which allows less sliding of the machine assembly.
In order to receive the signal, the tractor was equipped with the EZ-street electric pilot (Trimble Brazil, Campinas, São Paulo, Brazil) located in the tractor steering wheel, with antenna model AG25 (featuring multiband receivers, L1 and L2, and works on the GPS, GLONASS, SBAS, RTK, and OMNISTAR signals, as well as the RTX signal), and the Trimble® CFX750 monitor / processor.
Before the beginning of the sowing, a calibration of the electric autopilot was carried out in the field to guarantee similar conditions of the machine for the two routes.
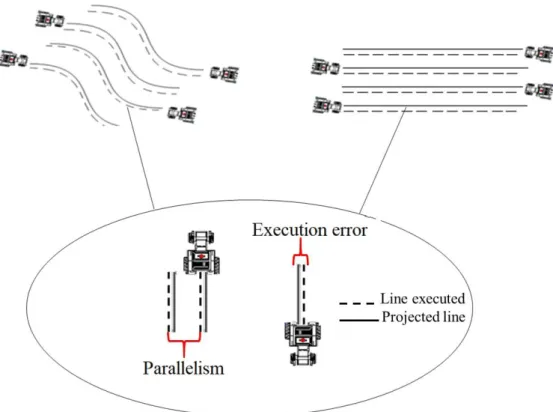
Two trajectories were analysed: curved (with degree of curvature ranging from 23 to 25º) and rectilinear. Eleven passes of the tractor-seeder assembly were analysed in each course. The Agrocad® program was used to measure the
errors, which were obtained by means of the orthogonal difference between the lines (Figure 2):
Parallelism errors: obtained by means of the distance between the lines executed by the tractor-seeder assembly.
FIGURE 2. Sample diagram for the evaluation of positioning errors in curved and rectilinear paths.
In each pass of the mechanized set were sampled 15 points per pass spaced in 60 m. After each maneuver was considered 60 m of border for stabilization of the machine and the signal.
Experimental design and statistics
The analysis of the variability of the peanut machining process was carried out using SPC and descriptive statistics (absolute values), with the help of the Minitab® 17 program (www.minitab.com).
The control chart model selected was the Mobile Amplitude Individual, which contains two graphs: the upper one, corresponding to the individual values sampled at each point; and the lower one, obtained by the calculated amplitude between two successive observations. The control limits were established while considering the variation of data owing to uncontrolled causes in the process (special causes), and were calculated based on the standard deviation of the variables, as shown in eqs (1) and (2) as proposed by Santos et al. (2016b):
2
+
=
x
ULC
(1)
2
−
=
x
LLC
(2)
Where,
ULC: upper limit of control;
x
: general average of the variable;
: standard deviation,LLC: lower limit of control.
For error charts between passes, the specific limit of control (SLC), represented by blue lines, was established based on the information of the signal provider, which guarantees an accuracy of 3.8 cm in 95% of the observations (www.trimbler.com / trimble-rtx).
Finally, we performed the frequency analysis of positioning errors occurrence in each path, using the Pareto Chart. The Pareto chart organizes the data from the highest to the lowest frequency occurrence, and a line of cumulative percentages of the values is plotted in the graphic. Its greatest utility is to allow an easy visualization and identification of the most important causes or problems, allowing the concentration of efforts on them. This analysis is commonly used when seeking to improve the quality of a process.
RESULTS AND DISCUSSION
TABLE 1. Results of descriptive statistics of curved and rectilinear paths.
Parallelism error Execution Error
Parameters Rectilinear Curved Rectilinear Curved
Mean (cm) 1.36 1.92 0.99 1.93
SD (cm) 1.00 1.69 0.79 1.82
CV (%) 73.30 88.24 80.13 94.21
Minimum (cm) 0.02 0.02 0.01 0.01
Maximum (cm) 5.22 8.75 4.05 11.10
SD: Standard Deviation; CV: Coefficient of Variation. (p<0.05)
Note that there is a 3.53 cm difference of the curved path with respect to the straight path, with the straight path being 1.42 cm above the supply’s precision limit (3.8 cm). Therefore, both paths have maximum errors above the specified limit. However, the occurrence of errors far above the stipulated can occur in isolation, and the signal is corrected in the following observations, so there is a need for point-to-point sampling by plotting the errors in a control chart, where it is possible to analyse and verify the occurrence of special causes that may impair the quality of the operation in the field with errors of positioning than anticipated. The same happens for the maximum execution error in the curved path, which presented approximately 3 times greater error than allowed.
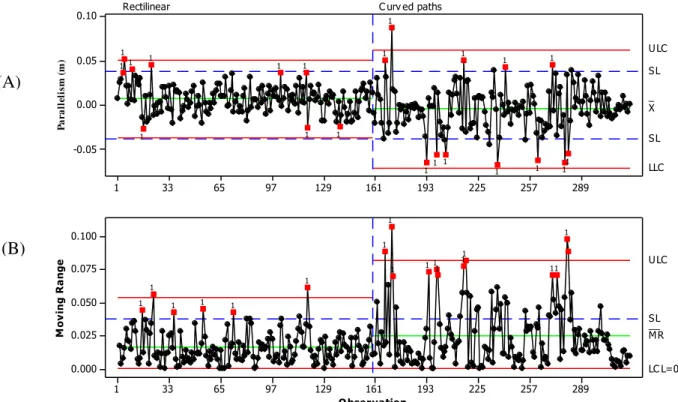
When the control charts for the error of parallelism (Figure 3) are analysed through Statistical Process Control (SPC), for the points (17, 102, 118, 119 and 139) in the straight course they are within the control limits (ULC and LLC). This type of error in the SPC is called a Type I error, which according to Montgomery (2009) are considered as
false alarms and do not risk the quality of the process, since they are between ULC and LLC. It is noteworthy that, regardless of the route, there were points that extrapolated the ULC and LLC, evidencing that there are random causes interfering in the positioning of the mechanized set and signal quality, which can increase the overlapping rate in the sowing operation, reducing the sown area.
When working with specific limits in the control charts (SL), these should receive special attention, since they are the ones that will guarantee the quality in the monitoring process, indicating if there was precision in the positioning of GNSS signal-guided machines during field operation, so that when all points are between the SL indicates high accuracy and accuracy in positioning (Santos et al., 2017). Considering this information, it can be said that the use of the satellite signal for the steering of mechanized set did not provide a sowing with precision and accuracy, having points that extrapolate the control limits, in the two routes.
FIGURE 3. Letters of control of individual values (A) and mobile range (B) for parallelism errors in rectilinear and curved paths.
289 257 225 193 161 129 97 65 33 1 0.10 0.05 0.00 -0.05 P a ra ll el is m ( m ) _ X U LC LLC Rectilinear S L S L C urv ed paths
289 257 225 193 161 129 97 65 33 1 0.100 0.075 0.050 0.025 0.000
O bser vation
Mobile amplitude charts (Figure 3B) can be a powerful tool in improving the quality of GNSS signals via PPP since it carries information from the previous point to the next, serving as an alert for values that are close to exceeding the SL. In the rectilinear path, observation 17 is close to exceeding the SL on the individual chart (Figure 3A) and the mobile range (Figure 3B), this point is plotted as out of control. In contrast, values that were observed as maximum errors (Point 5) are corrected to the nearest average, indicating that the method of satellite signal correction has control efficiency of points that exceed or are close to exceeding the limits.
False alarms (Type I error) in the curved path are represented as loss of signal quality, since they are above the SL. However, despite having the same experimental conditions for the two routes, guided automatic guided machines may find it more difficult to remain aligned in curved paths, regardless of the quality of the signal arriving in the rover of the machine, the gains from adopting an automatic steering system in this type of course may be substantially greater when compared to rectilinear paths.
In some cases, the use of an auxiliary GNSS system (Trueguide ™), which is installed in the traction implement, is recommended to obtain lower overlap and positioning errors. However, the instability of 15.78% in the sowing operation in the curved path does not justify the use of a Trueguide™ system in the sowing machine, as this is coupled to the tractor hydraulics, where lateral slip is less.
Vellidis et al. (2014) report that the use of this mechanism was efficient when used in sowing and peanut mechanization in areas with different degrees of curvature, however, the system is only recommended when trailed implements are coupled to the drawbar, where sliding is greater because the implement does not follow the same path as that of the tractor. This was observed by Kayacan et al., (2014) where they found mean values of error for the tractor and trailer from 3.61 to 6.44 cm for a straight-line trajectory and 41.52 to 49.78 cm for a curved path.
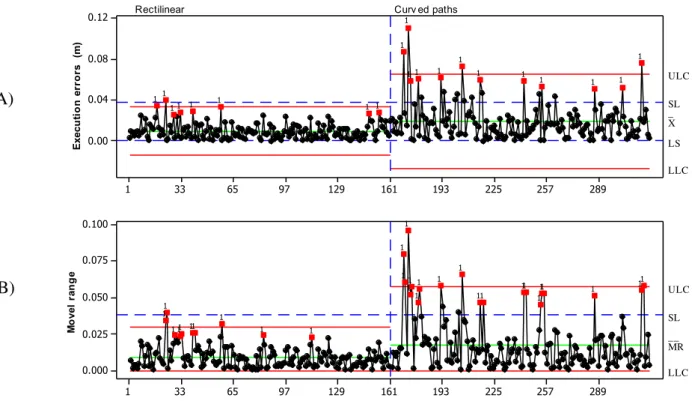
The sowing quality based on the execution error (projected x executed) obtained less variability in the straight path, while in the curved path there is an increase in the variability of the operation, as well as in the number of points above the SL (Figure 4), what can be proven on control charts of mobile range. This point is attributed to the environmental factor, where the slope and degree of curvature at some points in the line affected the direction of the tractor. These errors can be minimized when the vehicle has an automatic compensation system, which ensures the alignment of the tractor to the projected line, especially on routes with sharp slope and curved paths.
In addition, the use of autopilot with a predefined route can bring about improvements in the quality of the operation, since it is possible to make better use of the working width of the machines from records of the previous operation, in the case of sowing this is essential to have the minimum errors during execution, being the base to size the other operations, aiming to reduce overlap rates (Holpp et al., 2013; Stoll & Kutzbach, 2000).
FIGURE 4. Letters of control of individual values (A) and mobile range (B) for execution errors in rectilinear and curved paths.
289 257 225 193 161 129 97 65 33 1 0.12 0.08 0.04 0.00 E x e c u ti o n e rr o rs (m ) _ X ULC LLC Rectilinear SL LS Curv ed paths
In general, based on the results found, the sowing operation presented better quality in the rectilinear path, giving smaller errors of parallelism, which can be noticed by the lower amplitude of variation of the ULC and LLC of each process (Figure 4). Lipinski et al. (2016) point out that the profits generated by the automatic steering systems in agricultural machines are mainly determined by the quality of the operation, which considers the deviations between the actual position of the vehicle and the planned route.
However, the occurrence of isolated points above the SL does not represent any damage to the quality of the whole sowing operation, since the accuracy of systematic error correction is included in the RTX signal algorithm, which returns the values to the specific limits immediately, as observed in the control charts of this study.
In relation to the frequency and occurrence of parallelism errors, it is noted that the probability distribution of these in the rectilinear path is greater for errors of smaller values (Figure 5 I). From these results it is possible to note that the probability of the tractor-seeder assembly guided with RTX signal to maintain the previously planned distance between the passes (3.60 m) is higher, since the occurrence probability of errors smaller than 1 cm is 95% occurring 40 times during the sowing operation. Errors greater than 3.8 cm were found in the straight course, but with low frequency, causing a low occurrence probability (> 2%).
The low occurrence of sowing errors ensures accurate alignment with the crop, and net returns can be between $ 94 and $ 404 ha-1 when positioning errors are
smaller than 2.5 cm when compared to errors greater than 9 cm (Ortiz et al., 2013). Also, the frequency of the errors found is in agreement with those found by Rizos et al. (2012) who observed that positioning with RTX signal was able to provide in real time, maximum errors of 4 cm in up to 95% of the observations.
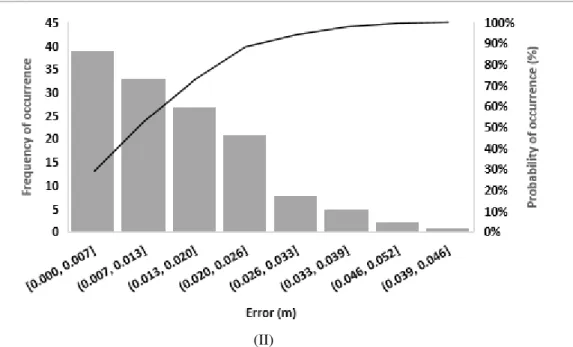
As for the curved path (Figure 5 II), the occurrence of errors greater than 3.8 cm was greater, however, as in the rectilinear path parallelism errors had an accumulated frequency of smaller values, representing 83% of the accumulated value.
The occurrence of deviations greater than 5 cm would occasionally occur in the part of the course where the terrain presented the greatest curvature. The use of electric pilot under these conditions can reduce the efficiency in the positioning of the machines in the field guided by RTX signal, by the response time that is given for the tractor’s wheel spinning, responsible for aligning and guiding the machined assembly during the operation, when compared to hydraulic pilot. Vellidis et al. (2014) point out that low curvatures do not affect the orientation of machines using GNSS signal, however, the author used RTK signal in his study, which can reduce this effect when the operation is performed in areas that have low curvature and inclination, method of relative correction.
(II)
FIGURE 5. Frequency graph of the occurrence of parallelism errors and occurrence probability in rectilinear (I) and curved (II) paths.
Thus, taking into account maximum positioning errors of 5.2 and 8.8 cm for the straight and curved paths, respectively, and that, one pass of the tractor-seeder assembly is 3.60 m in 1.0 (111 lines sown with peanuts), this would result in loss of sown area (109 lines in the rectilinear path and 108 lines sown in the curved), that is, if the accumulated frequency of these values were expressive, there would be reduction of plants per hectare and consequently reduction in productivity.
However, errors of up to 3.8 cm do not interfere with the overlapping rate in the peanut sowing operation, which makes the RTX signal an interesting alternative to the producer who wishes to make a precise sowing, as attested by Santos et al. (2017), in rectilinear paths.
The accuracy of the sowing operation using the RTX Center point signal can be compared with the results found by Berning (2011), who tested soil preparation equipment coupled to an automatic steering vehicle (RTK) and found a reduction in the overlap rate increasing steering accuracy between 5 to 6 cm in comparison to manual steering. Santos et al. (2017) evaluated the RTX signal in a straight course, and concluded that one of the main factors that affect the positioning of the tractor is the type of coupled implement, where it can cause greater or lesser lateral sliding. Lipinski et al. (2016) evaluated different types of GNSS signals (paid signal SF1 and SF2, free and manual signal) and found significant differences in relation to the overlap, so that when adopting a paid signal for the direction of the machines the error reduces. However, the authors emphasize that the choice of signal to be used depends on the precision that the operation requires.
For the case of the RTX signal the choice must receive special attention of several factors, mainly if the Country or region is on tectonic plate, since the movement of these can diminish the efficiency of the quality of the signal. This fact is more pronounced in satellite signals with PPP because they do not require a base close to the area, which considerably increases the possibility of errors occurring from signal degradation (environmental factor) arising from ionospheric refraction and, mainly, due to the scintillation in this layer in some periods of the day as in the late afternoon (Almeida & Dal Poz, 2016).
Therefore, the assertion that the RTX signal provides accuracy of 3.8 cm in 95% of the time is acceptable for the macro-region of Ribeirão Preto, São Paulo, Brazil, the largest sugarcane producing region, which makes a high investment in new technologies. It is worth noting that the RTX signal did not come to replace the RTK signal, it is a complement to this, since when the machine rover loses the satellite signal (RTX), the vehicle starts to operate with RTK signal until re-establishing the connection with the satellite signal.
CONCLUSIONS
1. The quality of peanut sowing was better in the rectilinear path compared to the curved one, however, it does not disqualify the quality of the operation using RTX in the curved path.
2. For both errors (parallelism and execution), considering that the probability of occurrence of maximum error is equal to 3.8 cm, the RTX signal ensured good quality in the sowing operation, through design in CAD software, independent of the analysed path.
3. In spite of the occurrence of errors above the limit specified in the curved and rectilinear paths, the RTX signal is a good alternative for reducing the overlap between pasts in the sowing operation, mainly due to the absence of base installation near the machine in curved paths.
ACKNOWLEDGEMENTS
REFERENCES
Almeida MS, Dal Poz WR (2016) Precise point
positioning and relative positioning with GNSS: what most accurate currently? Bulletin of Geodetic Sciences
22(1):175-195.
Baio FRR, Moratelli RF (2011) Auto guidance accuracy evaluation and contrast of the operational field capacity on the mechanized plantation system of sugar cane. Journal of the Brazilian Association of Agricultural Engineering 31(2):367-375.
Barbosa RM, Homem BFM, Tarsitano MAA (2014) Production costs and profitability of peanut in Jaboticabal, São Paulo. Revista Ceres 61(4):475-481.
Batte MT, Ehsani MR (2006) The economics of precision guidance with auto-boom control for farmer-owned agricultural sprayers. Computers and Electronics in Agriculture 53(1):28-44.
Bergtold JS, Raper RL, Schwab EB (2009) The economic benefit of improving the proximity of tillage and planting operations in cotton production with automatic steering. Applied Engineering in Agriculture 25(2):133-143.
Berning F (2011) Ganz genau geradeaus? Top Agrar 3:116 -123.
Carballido J, Perez-Ruiz ML, Agüera EJ (2014) Comparison of positional accuracy between rtk and rtx gnss based on the autonomous agricultural vehicles under field conditions American Society of Agricultural and Biological Engineers 30(3):361-366.
EMBRAPA - Empresa Brasileira de Pesquisa
Agropecuária (2013) Sistema brasileiro de classificação de solos. EMBRAPA, 3 ed. 353p.
Gomez-Gil J, Alonso-Garcia S, Gomez-Gil FJ, Stombaugh T (2011) A simple method to improve autonomous GPS positioning for tractors. Sensors 11(6):5630-5644.
Han S, Zhang Q, Noh H (2002) Kalman filtering of DGPS positions for a parallel tracking application. Transactions of the American Society of Agricultural Engineers 45(3):553-559.
Holpp M, Kroulik M,Kviz Z,Anken T, Sauter M,Hensel O (2013)Large-scale field evaluation of driving
performance and ergonomic effects of satellite-based guidance systems, Biosystems Engineering 116(2):190-197.
Kayacan, E, Kayacan E, Ramon H, Saeys W (2014) Learning in centralized nonlinear model predictive control: application to an autonomous tractor-trailer system. IEEE Transactions on Control Systems Technology 23(1):197-205.
Lipinski AJ, Markowski P, Lipinski S, Pyra P (2016) Precision of tractor operations with soil cultivation implements using manual and automatic steering modes Biosystems Engineering 145:22-28.
Montgomery, DC (2009). Design and analysis of
experiments. 6th ed. Hoboken, NJ, USA: Wiley. pp 179-268.
Mousazadeh HA (2013) Technical review on navigation systems of agricultural autonomous off-road vehicles, Journal of Terramechanics 50(3):211-232.
Oksanen T (2015) Accuracy and Performance Experiences of Four Wheel Steered Autonomous Agricultural Tractor in Sowing Operation. In: Mejias L, Corke P, Roberts J (eds). Field and service robotics. Springer Tracts in Advanced Robotics, v 105.
Ortiz BV, Balkcom KB, Duzy L, Van Santen E, Hartzog DL (2013) Evaluation of agronomic and economic benefits of using RTK-GPS-based auto-steer guidance systems for peanut digging operations. Precision Agriculture
14(4):357-37.
Pérez-Ruiz M, Upadhyay SK (2012) GNSS in precision agricultural operation. In: F. Albahhar (ed). New Approach of Indoor and Outdoor Localization Systems, p. 1-26.
Rizos C, Janssen V, Robert C, Grinter T (2012) PPP versus DGNSS. Geomatic World 20(6):18-20.
Roberson GT, Jordan DL (2014) RTK-GPS and automatic steering for peanut digging. Applied Engineering in Agriculture 30(3):405:409.
Robertson MJ, Llewellyn RS, Mandel R, Lawes R, Bramley RGV, Swift L, Metz N, O’Callaghan C (2012) Adoption of variable rate fertiliser application in the Australian grains industry: status, issues and prospects. Precision Agriculture 13(2):181-199.
Rocha RSM, Jerez GO, Brassarote GON, Monico JFG (2017) Avaliação do efeito da cintilação ionosférica e de diferentes intervalos de tempo de coleta de dados no posicionamento por ponto preciso na sua forma on-line. Revista Brasileira Geomática 5(2):251-276.
Santos AF, Kazama EH, Ormond ATS, Tavares TO, Silva RP (2016a) Quality of mechanized peanut digging in function of the auto guidance. African Journal of Agricultural Research 11(48):4894-4901.
Santos, AF, Silva, RP, Correa, LN, Borba, MAP, Girio, LAS (2016b) Accuracy and precision monitoring through statistical process control. In: Brazilian Congress of Precision Agriculture - ConBAP, 2016, Goiânia. Anais... Goiânia. CD-Rom
Stoll A, Kutzbach HD (2000) Guidance of a forage harvester with GPS. Precision Agriculture 2(3):281-291.
Tey YS, Mark B (2012) Factors influencing the adoption of precision agricultural technologies: a review for policy implications. Precision Agriculture13(6):713-730.
TRIMBLE RTX (2017). Available in:
http://www.trimble.com/Positioning-Services/Trimble-RTX.aspx Last accessed: September 22, 2017.
Vellidis G, Ortiz B, Beasley J, Hill R, Henry H, Brannen H (2014) Reducing Digging Losses by Using Automated Steering to Plant and Invert Peanuts. Agronomy 4:337-348.
Xiu Y, Lin H, Wang R, Li Q, Yi C (2010) The