Food Science and Technology
DO:
D https://doi.org/10.1590/fst.08917
OSSN 0101-2061 (Print) OSSN 1678-457X (Dnline)
1 Introduction
On Brazil, corn is consumed in the form of grains and their derivatives resulting from dry milling. On this processing, anatomical parts of the corn (endosperm, pericarp and germ) are mechanically separated (Gonçalves et al., 2003; Paes, 2008). The pericarp, fraction that coats the grain, is transformed into a residue, consisting essentially of hemicellulose, cellulose and lignin (>95% of crude fiber). This product has been used as a source of insoluble dietary fibers in bread industry and farinaceous products ready for use in Europe and North America (Sugawara et al., 1991). On Brazil, however, the use of corn fiber has been directed primarily to animal feeding (Alessi et al., 2003; Callegaro et al., 2005; Paes, 2008; Dliveira et al., 2014), with no added value to the product.
Onsoluble dietary fibers are important in providing the mass required for the peristaltic action of the intestine (Rique et al., 2002), since they remain intact along the digestive tract (Moraes & Colla, 2006). Furthermore, they promote the reduction of energy nutrient absorption and increase the fecal bulk, which may increase satiety and reduce food intake (Costa & Martino, 2008).
Soluble and insoluble fiber help reducing body weight and composition, contributing to the control of obesity, multifactorial disease resulting from a positive energy balance; and that seems to have a strong association with excess body fat and morbimortality. Dbesity is considered a low intensity chronic inflammation (Li et al., 2008) and is related to pathologies such as hypertension, type 2 diabetes mellitus, coronary artery disease, chronic obstructive pulmonary disease, certain types of cancer (Halpern et al., 2004; Duarte et al., 2006) and non-alcoholic hepatic steatosis (NASH) (Love-Dsborne et al., 2008). The deposition of visceral fat, associated to the increase in free fatty acids levels in the portal circulation and insulin resistance are considered risk factors for the onset of diabetes mellitus and cardiovascular diseases (Duchesne, 2001). Thus, reduced abdominal fat deposition has a positive impact in lowering the risk of chronic diseases associated with the metabolic syndrome.
Cafeteria, high-calorie and high-fat diets are generally associated with overweight, as a high lipid intake might be the key for the development of obesity (Campión & Martinez, 2004). On this sense, the objective of the present study was to evaluate
The effect of micronized corn fiber on body weight, glycemia, and lipid metabolism
in rats fed cafeteria diet
Vanessa Barbosa de Moraes THDMPSDN1*, Neuza Maria Brunoro CDSTA1, Hércia Stampini Duarte MARTOND1,
Maria Cristina Dias PAES2
Received 08 Mar., 2017 Accepted 10 Jan., 2018
1 Universidade Federal de Viçosa – UFV, Viçosa, MG, Brasil 2 EMBRAPA Milho e Sorgo, Sete Lagoas, MG, Brasil
*Corresponding author: vanessabdm@yahoo.com.br Abstract
During corn industrial dry milling, a residue rich in dietary fibers is generated. This study aimed to evaluate the effects of micronized corn fiber (MCF) as part of a cafeteria diet in the macronutrient metabolism and body weight. Wistar male rats, with initial body weight of 249 ± 14 g (n = 13), received AON-93M diet (Group 1) or cafeteria diet (Groups 2, 3 and 4), composed of commercial ration, cookies, fried potato sticks, milk chocolate, bacon and chicken liver pâté. Groups 3 and 4 received MCF to replace 100 and 50% of the cellulose from the AON-93M diet, respectively. After 35 days, blood, tissues and feces were collected. Data were analyzed by ANDVA followed by Tukey test (p < 0.10). The weight gain of the animals increased by 25.9%, 20.8% and 22.0%, when fed cafeteria diet or 100 and 50% of MCF respectively, compared to the control group, although food consumption did not differ between them. Body weight and food efficiency ratio did not differ between the groups fed cafeteria diet with or without MCF. The addition of MCF to the cafeteria diet did not alter the animal lipid profile and glycemia, however, the accumulation of lipids in their livers was similar to the control group. The intake of 100% MCF resulted in higher fecal weight and fecal excretion of lipids, and lower fecal nitrogen, lipid absorption and lipid deposition in the liver than the cafeteria diet. On conclusion, MCF has a potential to improve intestinal transit and lipid excretion, but showed no benefit on blood lipid and glucose levels.
Keywords: dietary fiber; corn; lipid profile; blood glucose; rat study.
the effect of micronized corn fiber (MCF) on body weight, lipid metabolism and glycemia in rats fed with a cafeteria diet.
2 Materials and methods 2.1 Animals and diets
This study was approved by the Ethics Committee on Animal Experimentation of the Federal University of Minas Gerais, Brazil. Ot was used 52 adult male Wistar rats (Rattus novergicus,
Albinus variety, Rodentia class), with initial weight of 249 ± 14 g, approximately 54 days old. These animals were kept in individual stainless steel cages for a period of 35 days, in an environment with controlled temperature at 22 ± 2 °C and 12-hour photoperiod. The animals received water and diet ad libitum.
The rats were divided into four groups (n=13), control AON-93M diet (G1), cafeteria diet (G2), cafeteria + 100% MCF (G3), and cafeteria + 50% MCF (G4). Microcrystalline cellulose, used in the control diet as a source of dietary fiber, was replaced by MCF in groups 3 and 4. The MCF presented 73.4% of total dietary fiber, with 72.7% of insoluble fiber and 0.67% of soluble fiber (Dliveira et al., 2014).
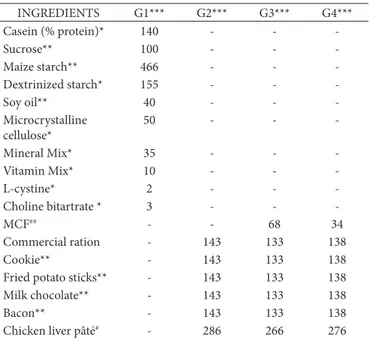
The composition of the experimental diets is presented in Table 1. The diet of group 1 was based on AON-93M (Reeves et al., 1993), while the cafeteria diet was adapted from Milagro et al. (2006) and presented the following ingredients commercial ration, cookies, fried potato sticks, milk chocolate, bacon and chicken liver paté.
The commercial ration, the cookies, the potato, the chocolate and the bacon were purchased in the local market, while the pâté was obtained by cooking the chicken liver and later processing with butter in appropriate proportions (960:350 g, respectively)
in a domestic multiprocessor. Then all ingredients, including the MCF in concentrations of 50 and 100%, were mixed, smashed and pelletized. These were weighed, packed in polyethylene bags, identified and stored at 10 °C. The amount of corn residue was calculated by the concentration of total dietary fiber in the control diet, so that the test diets (G3 and G4) provided 100% and 50% of dietary fiber, respectively, of that provided by the AON-93M diet.
Moisture, ash, lipids and proteins were determined according to ADAC (Association of Dfficial Analytical Chemists, 1984), and dietary fiber by the method described in ADAC (Association of Dfficial Analytical Chemists, 1997). The total carbohydrates content was calculated by reducing the other nutrients (lipids, proteins, moisture, ash and dietary fiber) on a dry basis of 100. Cholesterol and saturated fatty acids contents of cafeteria diets with 100 and 50% MCF were obtained from the Brazilian Table of Food Composition - TACD (Universidade Estadual de Campinas, 2006), considering each food used.
2.2 Tissue, feces and blood analysis
At the end of the experimental period, the animals were sacrificed under CD2 inhalation after fasting for 12h. Blood
was collected by heart puncture and serum was obtained by centrifugation at 2.400 x g for 15 min (Centrifuge Fanem, SP – Brazil).
The liver of the animals was removed, washed in Phosphate Buffered Saline (PBS), weighed on the scale (Bioprecisa-BS3000A), accuracy of 0.1 g. After weighing, the right lobe was removed and stored. The rest of the organ was conditioned on previously identified aluminum foil and stored in an ultra-freezer (ThermoScientific) at -80 °C, for further determination of total lipids.
The stool collection was performed in the last week of the experiment, for a period of five consecutive days. The feces were collected in plastic bottles with lids and stored in a refrigerator at 10 °C for analyzes of moisture, proteins, lipids and percentage of absorbed lipids, as described above.
The percentage of lipid absorption was calculated by the balance between lipid intake during the five days of stool collection and fecal lipids of the same period.
Serum glucose, total cholesterol and triacylglycerols were analyzed in duplicate by colorimetric enzymatic method, using a commercial kit (Bioclin®, Brazil), in the Automatic Analyzer
of Biochemistry (Model BS200, Mindray).
Glycosylated hemoglobin was manually dosed by the cation exchange method in tubes, using a commercial kit (Katal®, Brazil).
HDL was measured by the colorimetric enzymatic method, by using a commercial kit (Bioclin®, Brazil). Very low density
lipoproteins (VLDL) and low density lipoproteins (LDL) were precipitated with the mixture of phosphotungstic acid and magnesium chloride. After centrifugation, the cholesterol associated with the high density lipoprotein (HDL) was determined in the supernatant by the colorimetric enzymatic method. The tests were performed in duplicate.
Table 1. Composition of experimental diets (g/kg of mixture).
ONGREDOENTS G1*** G2*** G3*** G4***
Casein (% protein)* 140 - -
-Sucrose** 100 - -
-Maize starch** 466 - -
-Dextrinized starch* 155 - -
-Soy oil** 40 - -
-Microcrystalline cellulose*
50 - -
-Mineral Mix* 35 - -
-Vitamin Mix* 10 - -
-L-cystine* 2 - -
-Choline bitartrate * 3 - -
-MCF## - - 68 34
Commercial ration - 143 133 138
Cookie** - 143 133 138
Fried potato sticks** - 143 133 138
Milk chocolate** - 143 133 138
Bacon** - 143 133 138
Chicken liver pâté# - 286 266 276
For the extraction of total lipids in the liver, it was used the technique proposed by Folch et al. (1957).
2.3 Statistical analysis
Data were submitted to the Kolmogorov-Smirnov normality test. For the comparisons between three or more independent groups, the analysis of variance ANDVA was used, complemented by Tukey’s multiple mean comparison test, p < 0.10.
Data were analyzed using the System for Statistical Analysis (SAEG) software, version 9.1 (2007) for statistical analysis.
3 Results and discussion
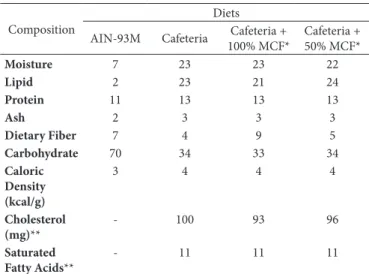
The cafeteria diet is characterized by high content of lipids and digestible carbohydrates and low dietary fiber content (Table 2).
The experimental group that received a cafeteria diet presented higher weight gain when compared to the control Group. The weight gain of groups G3 and G4 did not differ from the control Group (Table 3). Similar results have been found in the literature, where it was not observed any differences in the weight gain and the final weight of the animals when they were fed with peel of corn and corn bran (Vidal-Quintanar et al., 1997; Ebihara & Nakamoto, 2001).
The animal livers weight did not differ between groups (Table 4), whereas the lipid concentration in the liver was higher for the group with cafeteria diet, compared to the control group. The groups with addition of 50 and 100% MCF, however, did not differ neither from the control group nor from the cafeteria diet, regarding the deposition of lipids in the liver.
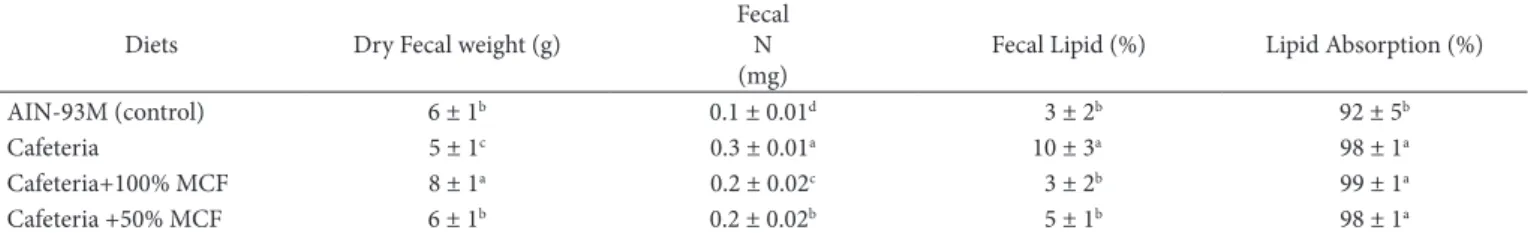
Animals fed with the cafeteria diet showed a higher percentage of lipids in their feces, compared to the control group (Table 5), which could be justified by the excess of lipids in the diet. When adjusted by the excreted feces concentration, the 100% MCF diet promoted lower lipid absorption and, consequently, higher fecal lipid excretion, compared to the cafeteria diet and 50% MCF groups. This higher lipid excretion in the feces, however, did not promote changes in weight gain of the animals (Table 3) and in the lipid deposition in the liver (Table 4). The corn fiber may have reduced fat absorption at the intestinal level, reducing its deposition in the liver tissue or increasing its excretion via the bile duct in the enterohepatic circulation. The addition of MCF to the cafeteria diet did not seem to have reduced the protein digestibility of the diet, on the contrary, the diets with 50 and 100% MCF promoted lower fecal nitrogen excretion than the cafeteria diet (Table 5), although this excretion was higher in these groups compared to the control diet.
Table 6 shows the average rates for glycemic and lipid profiles. The glycemic levels did not differ among the experimental groups. However, the values found for glycosylated hemoglobin (HBA1c) were higher (p < 0.10) for the groups with cafeteria diet,
irrespective to the addition of MCF, when compared with the control group.
Total cholesterol levels of the groups fed cafeteria diet with or without MCF were lower than the control Group, and
no significant difference was observed between the groups fed cafeteria diets.
Hu et al. (2008) found a reduction in serum cholesterol levels when corn bran was added to the atherogenic diet in Sprague-Dawley rats, when compared to animals fed with the control diet over a six-week period. Vidal-Quintanar et al. (1997) found greater response in VLDL and LDL-cholesterol reduction in guinea pigs fed corn bran for 4 weeks.
HDL-cholesterol values followed the same pattern of total cholesterol. However, the HDL/total cholesterol ratio did not differ between groups, showing that the cafeteria diet with or without addition of MCF did not present atherogenic effect.
Table 2. Centesimal composition of the experimental diets (g/100g).
Composition
Diets AON-93M Cafeteria Cafeteria +
100% MCF*
Cafeteria + 50% MCF*
Moisture 7 23 23 22
Lipid 2 23 21 24
Protein 11 13 13 13
Ash 2 3 3 3
Dietary Fiber 7 4 9 5
Carbohydrate 70 34 33 34
Caloric Density (kcal/g)
3 4 4 4
Cholesterol (mg)**
- 100 93 96
Saturated Fatty Acids**
- 11 11 11
*MCF = Micronized corn fiber; **Concentrations estimated based on the Food Composition Table (Universidade Estadual de Campinas, 2006).
Table 3. Means of weight gain (WG), food consumption (FC) and food efficiency ratio (FER) for the different experimental groups.
Groups WG (g)
(n = 13)
FC (g) (n = 13)
FER (n = 13) AON-93M (control) 139 ± 30b 768 ± 54NS 0.2 ± 0.03b
Cafeteria 175 ± 40a 784 ± 69NS 0.2 ± 0.04a
Cafeteria + 100% MCF 168 ± 36ab 799 ± 91NS 0.2 ± 0.02ab
Cafeteria + 50% MCF 169 ± 39ab 777 ± 73NS 0.2 ± 0.03a
Averages followed by at least one same letter in the column do not differ from each other at the 10% of probability level by the Tukey Test; MCF = Micronized corn fiber; NS = Not significant by F test.
Table 4. Mean of liver weight and liver lipid for the different experimental groups.
Groups Liver weight (g) (n = 13)
Liver lipid (g) (n = 13) AON-93M (control) 14 ± 2NS 1 ± 0.4b
Cafeteria 15 ± 2NS 2 ± 0.6a
Cafeteria + 100% MCF 15 ± 2NS 1 ± 0.4ab
Cafeteria + 50% MCF 15 ± 2NS 1 ± 0.5ab
Serum levels of triacylglycerols (TG) did not differ between the cafeteria diet group and the control group (Table 6). Similar results were shown by Li et al. (2008), when the rats evaluated with diet-induced obesity presented small, but non-significant, elevations of plasma triglycerides when compared to lean rats.
Animals that received the cafeteria diet with or without addition of MCF did not present differences in TG, CDL and HDL concentrations, demonstrating that the corn residue has no influence on the plasma lipid profile when added to the cafeteria diet. Similar results were verified in rats by Vidal-Quintanar et al. (1997), however, Hu et al. (2008) found a reduction in this index when the animals received 100% of recommendations in the form of corn bran, although the values of TG for the animals with corn residue diet were lower than the control group.
4 Conclusions
The addition of 100% MCF to the cafeteria diet did not influence the weight gain, and the deposition of lipids in the liver in the study model.
Fibers added to the cafeteria diet, at different concentrations, in the form of micronized corn fiber, did not promote beneficial effects on glycemia, glycosylated hemoglobin, total cholesterol, HDL/cholesterol and triacylglycerols in rats.
The fecal weight increased with the addition of MCF in the diet, suggesting that an adequate consumption of dietary fiber in the form of this product may contribute to improve intestinal transit. Therefore, the MCF might consist in an alternative source of dietary fiber to aid the proper functioning of the intestinal tract when added to the diet.
References
Alessi, M. D., Raupp, D. S., & Gardingo, J. R. (2003). Caracterização do processamento da farinha de milho biju para o aproveitamento
dos subprodutos. Publication UEPG: Ciências Exatas e da Terra,
Ciências Agrárias e Engenharias, 9(2), 31-39.
Association of Dfficial Analytical Chemists – ADAC. (1984). Official Methods of Analysis of Association of Official Analytical Chemists
(14th ed., 1141 p.). Washington: ADAC.
Association of Dfficial Analytical Chemists – ADAC. (1997). Official Methods of Analysis of Association of Official Analytical Chemists
(16th ed.). Washington: ADAC.
Callegaro, M. G. K., Dutra, C. B., Huber, L. S., Becker, L. V., Rosa, C. S., Kubota, E. H., & Hecktheur, L. H. (2005). Determinação da fibra alimentar insolúvel, solúvel e total de produtos derivados do milho.
Ciência e Tecnologia de Alimentos, 25(2), 271-274. http://dx.doi.
org/10.1590/S0101-20612005000200015.
Campión, J., & Martinez, J. A. (2004). Ketoconazole, an antifungal agent, protects against adiposity induced by a cafeteria diet. Hormone and Metabolic Research. Hormon- und Stoffwechselforschung. Hormones et
Metabolisme, 36(7), 485-491. http://dx.doi.org/10.1055/s-2004-825729.
PMid:15305233.
Costa, N. M. B., & Martino, H. S. D. (2008). Fibras alimentares. On N. M. B. Costa & M. C. G. Pelúzio. Nutrição básica e metabolismo (Cap. 4, pp. 85-120). Viçosa: Editora UFV.
Duarte, A. C. G. D., Fonseca, D. F., Manzoni, M. S. J., Soave, C. F., Sene-Fiorese, M., Damaso, A. R., & Cheik, N. C. (2006). Dieta hiperlipídica e capacidade secretória de insulina em ratos. Revista de Nutrição, 19(3), 341-348. http://dx.doi.org/10.1590/S1415-52732006000300005. Duchesne, M. (2001). D consenso latino-americano de obesidade.
Revista Brasileira de Terapia Comportamental e Cognitiva, 3(2), 19-24.
Ebihara, K., & Nakamoto, Y. (2001). Effect of the particle size of corn bran on the plasma cholesterol concentration, fecal output and cecal fermentation in rats. Nutrition Research, 21(12), 1509-1518. http:// dx.doi.org/10.1016/S0271-5317(01)00380-3.
Folch, J., Lees, M., & Sloane Stanley, G. H. (1957). A simple method for the isolation and purification of the total lipids from animal tissues.
The Journal of Biological Chemistry, 226(1), 497-509. PMid:13428781.
Gonçalves, R. A., Santos, J. P., Tomé, P. H. F., Pereira, R. G. F. A., Ascheri, J. L. R., & Abreu, C. M. P. (2003). Rendimento e composição química Table 6. Average rates of glucose (GL), glycosylated hemoglobin (HBA1c), total cholesterol (CDL), HDL-cholesterol (HDL), HDL/Total cholesterol (HDL/CDL) and triglycerides (TG) for the different experimental groups.
Groups GL
(n = 13)
HBA1c (n = 13)
CDL (n = 13)
HDL (n = 13)
HDL/CDL (n = 13)
TG (n = 13)
AON-93M (control) 305 ± 46a 2 ± 0.2b 85 ± 14a 78 ± 22a 1 ± 0.2a 169 ± 57a
Cafeteria 269 ± 50a 2 ± 0.3a 68 ± 13b 53 ± 11b 1 ± 0.2a 131 ± 40ab
Cafeteria + 100% MCF 301 ± 75a 2 ± 0.2a 70 ± 6b 53 ± 14b 1 ± 0.2a 128 ± 36b
Cafeteria + 50% MCF 300 ± 52a 2 ± 0.1a 70 ± 11b 60 ± 15b 1 ± 0.2a 122 ± 34b
The results were expressed in mg/dL for all parameters, except for HDL/CDL ratio. Averages followed by at least one same letter in the column do not differ from each other at the 10% of probability level by the Tukey Test; MCF = Micronized corn fiber.
Table 5. Nitrogen and lipids in feces and lipid absorption for the different experimental groups.
Diets Dry Fecal weight (g)
Fecal N (mg)
Fecal Lipid (%) Lipid Absorption (%)
AON-93M (control) 6 ± 1b 0.1 ± 0.01d 3 ± 2b 92 ± 5b
Cafeteria 5 ± 1c 0.3 ± 0.01a 10 ± 3a 98 ± 1a
Cafeteria+100% MCF 8 ± 1a 0.2 ± 0.02c 3 ± 2b 99 ± 1a
Cafeteria +50% MCF 6 ± 1b 0.2 ± 0.02b 5 ± 1b 98 ± 1a
de cultivares de Milho em moagem a seco e produção de grits.
Ciência e Agrotecnologia, 27(3), 643-650. http://dx.doi.org/10.1590/
S1413-70542003000300020.
Halpern, Z. S. C., Rodrigues, M. D. B., & Costa, R. F. (2004). Determinantes fisiológicos do controle do peso e apetite. Revista de Psiquiatria
Clínica, 31(4), 150-153.
Hu, Y., Wang, Z., & Xu, S. (2008). Corn bran dietary fibre modified by xylanase improves the mRNA expression of genes involved in lipids metabolism in rats. Food Chemistry, 109(3), 499-505. http:// dx.doi.org/10.1016/j.foodchem.2007.12.045.
Li, H., Lelliott, C., Hakansson, P., Ploj, K., Uneld, A., Verolin-Johansson, M., Benthem, L., Carlsson, B., Storlien, L., & Michaelsson, E. (2008). Ontestinal, adipose, and liver inflammation in diet-induced obese mice. Metabolism Clinical and Experimental, 57(12), 1704-1710. http://dx.doi.org/10.1016/j.metabol.2008.07.029. PMOD: 19013294. Love-Dsborne, K. A., Nadeau, K. J., Sheeder, J., Fenton, L. Z., & Zeitler, P. (2008). Presence of the metabolic syndrome in obese adolescents predicts impaired glucose tolerance and nonalcoholic fatty liver disease. The Journal of Adolescent Health, 42(6), 543-548. http:// dx.doi.org/10.1016/j.jadohealth.2007.11.136. PMid:18486862. Milagro, F. O., Campión, J., & Martinez, J. A. (2006). Weight gain
induced by high-fat feeding involves increased liver oxidative stress.
Obesity, 14(7), 1118-1123. http://dx.doi.org/10.1038/oby.2006.128.
PMid:16899792.
Moraes, F. P., & Colla, L. M. (2006). Functional foods and nutraceuticals: definition, legislation and health benefits. Revista Eletrônica de
Farmácia, 3(2), 99-112.
Dliveira, G. O. Jr., Costa, N. M. B., Martino, H. S. D., & Paes, M. C. D. (2014). Chemical composition and effects of micronized corn bran
on iron bioavailability in rats. Food Science and Technology, 34(3), 616-622. http://dx.doi.org/10.1590/1678-457x.6330.
Paes, M. C. D. (2008). Aspectos físicos, químicos e tecnológicos do grão de milho. On J. C. Cruz, D. Karam, M. A. R. Monteiro & P. C. Magalhaes (Ed.), A cultura do milho (Cap. 2, pp. 47-61). Sete Lagoas: Embrapa Milho e Sorgo.
Reeves, P. G., Nielsen, F. H., & Fahey, G. C. Jr. (1993). AON-93 purified diets for laboratory rodents: Final Report of The American Onstitute of Nutrition ad hoc writing committee on the reformulation of the AON-76A rodent diet. The Journal of Nutrition, 123(11), 1939-1951. http://dx.doi.org/10.1093/jn/123.11.1939. PMid:8229312. Rique, A. B. R., Soares, E. A., & Meirelles, C. M. (2002). Nutrição e
exercício na prevenção e controle das doenças cardiovasculares.
Revista Brasileira de Medicina do Esporte, 8(6), 244-254. http://
dx.doi.org/10.1590/S1517-86922002000600006.
Sugawara, M., Sato, Y., Yokoyama, S., & Mitsuoka, T. (1991). Effect of corn fiber residue supplementation on fecal properties, flora, ammonia, and bacterial enzyme activities in healthy humans.
Journal of Nutritional Science and Vitaminology, 37(1), 109-116.
http://dx.doi.org/10.3177/jnsv.37.109. PMid:1652631.
Universidade Estadual de Campinas – UNOCAMP. (2006). Tabela
Brasileira de Composição de Alimentos – TACO (versão 2. 2. ed.).
Campinas: UNOCAMP/NEPA. Retrieved from http://www.unicamp. br/nepa/taco