www.scielo.br/rbg
IDENTIFICATION OF GROUNDWATER CONTAMINATION
USING 2-D ELECTRICAL IMAGING SURVEY
Rafael Machado Mello
1, Carlos Tadeu Carvalho do Nascimento
2,
Sergio Koide
3and Jo˜ao Cˆandido Magalh˜aes
4ABSTRACT.In February, 2009, an underground industrial effluent discharge originating from a small meat processing industry was identified in Ceilˆandia, Distrito Federal, Brazil. The contamination plume reached the phreatic level, where it propagated reaching the wells located downstream the discharge point. The area near this effluent discharge point was monitored by monthly groundwater sampling and analysis. In January, 2011, a geophysical survey was carried out in this area, using the DC electrical resistivity method. Three resistivity sections were obtained and they allowed the mapping of the contamination plume. The contaminated spots presented resistivity values less than 140 Ohm.m and non-contaminated areas showed values between 140 and 2550 Ohm.m. The three sections were numerically integrated and the result was a 3-D figure showing the volume of subsurface with lower values of resistivity. The study showed reduced resistivity values in a portion of the subsoil out of the expected contaminated area, which suggests the existence of another contamination source.
Keywords: resistivity, pollution, industrial effluent.
RESUMO.Em fevereiro de 2009, em Ceilˆandia, Distrito Federal, foi identificado um lanc¸amento de efluente industrial no subsolo derivado do processamento, lavagem, tratamento e embalagem de carnes. A pluma de contaminac¸˜ao chegou ao lenc¸ol fre´atico onde se propagou at´e atingir poc¸os e cisternas situadas a jusante do ponto de lanc¸amento. A regi˜ao onde ocorreu este lanc¸amento passou a ser monitorada por meio de coleta mensal e an´alise de amostras da ´agua subterrˆanea. Em janeiro de 2011 foi feito um levantamento geof´ısico na ´area utilizando o m´etodo el´etrico de corrente cont´ınua. Foram obtidas trˆes sec¸˜oes de resistividade que possibilitaram mapear a pluma de contaminac¸˜ao. As regi˜oes contaminadas apresentaram valores de resistividade inferiores a 140 Ohm.m, enquanto aquelas n˜ao contaminadas mostraram valores entre 140 e 2550 Ohm.m. As trˆes sec¸˜oes foram integradas numericamente e o resultado foi uma figura tridimensional que envolve o volume da subsuperf´ıcie com os menores valores de resistividade. O estudo mostrou valores reduzidos de resistividade em uma parte do subsolo fora da ´area de influˆencia da pluma de contaminac¸˜ao conhecida, sugerindo a existˆencia de outro foco de contaminac¸˜ao.
Palavras-chave: resistividade, poluic¸˜ao, efluente industrial.
1ADASA, Parque Ferrovi´ario de Bras´ılia, Estac¸˜ao Rodoferrovi´aria, 70631-900 Bras´ılia, DF, Brazil. Phone: +55(61) 3961-4985 – E-mail: [email protected] 2Universidade de Bras´ılia, Faculdade UnB Planaltina, 73345-010 Planaltina, DF, Brazil. Phone: +55(61) 3107-8052 – E-mail: [email protected]
3Universidade de Bras´ılia, Departamento de Engenharia Civil e Ambiental, 70910-900 Bras´ılia, DF, Brazil. Phone: +55(61) 3107-0926 – E-mail: [email protected] 4Universidade de Bras´ılia, Instituto de Geociˆencias, 70910-900 Bras´ılia, DF, Brazil. Phone: +55(61) 3631-7537 – E-mail: [email protected]
i i
“main” — 2015/1/26 — 11:59 — page 292 — #2
i i
292
IDENTIFICATION OF GROUNDWATER CONTAMINATION USING 2-D ELECTRICAL IMAGING SURVEYINTRODUCTION
Monitoring the groundwater quality in Distrito Federal (DF) is greatly important, since the demand for this water is growing rapidly due to urban expansion. The case study relates to an ir-regular discharge of effluent resulting from washing, processing and packaging steps of a small meat processing plant located in Ceilˆandia. The effluent was discharged into an uncoated cesspool and reached the phreatic surface, spreading into the groundwa-ter. The company is located near residential lots, of which several showed contamination of wells and cisterns. There is also the risk of the pollutants reaching the source of the Cap˜ao do Brejo stream, a tributary of the Descoberto River. Geophysical surveys employ-ing the direct current electrical resistivity method were performed, in order to identify the effluent spreading pattern in the subsurface, especially close to the residential lots.
CHARACTERIZATION OF THE STUDY AREA
Location and description of the pollution source
This work was developed in the Bela Vista Rural Condominium, in Ceilˆandia, a town with approximately 400,000 inhabitants (Fig. 1) in the Distrito Federal. Wells are the only source of wa-ter for households and industries in this area and in the condo-minium. The study area is located in the headwaters of the Cap˜ao do Brejo stream, a tributary of the Descoberto River subbasin, Parna´ıba Basin. This is an area of 350 hectares, characterized by irregular land occupation. There are approximately 500 houses located within the catchment area of the Cap˜ao do Brejo stream.
Small industries, including meat processing, are located in-side this area. In one of these small industries, the soil was infil-trated by the industrial effluent resulting from washing, processing and packaging of meat for making beef jerky. Sodium chloride is the main product used in the process; therefore, the effluent con-sists basically of the mixture of brine and blood of the processed meat. This effluent has high levels of chloride and Biochemical Oxygen Demand (BOD) and cannot be disposed of without treat-ment. For this reason, the industry has built a system for biolog-ical treatment of wastewater that consists of decanters, aerators, and sand and gravel filters. This system should treat two cubic meters of effluent per day, with BOD higher than 2,300 mg/liter; chlorides, 50,000 mg/liter; and total ammonium nitrogen above 83 mg/l. The treatment system failed at some point in time as the effluent disposed on the ground through a cesspool showed no significant reduction of polluting load. These effluents reached the phreatic surface, eight feet deep, and propagated following
the hydraulic gradient, reaching wells and cisterns of households located downstream of the company.
The cisterns nearby the small plant showed the presence of a substance similar to the effluent produced by the company. From that moment, the Agˆencia Reguladora de ´Aguas, Energia e Sanea-mento B´asico do Distrito Federal, ADASA, (Regulatory Agency for Water, Energy and Sanitation of the Federal District), responsible for the management of water resources in DF has prohibited the wastewater treatment system for suspected inefficiency. The area is being monitored by the agency through physico-chemical and bacteriological analyses of groundwater and wastewater. The con-tamination was identified in February 2009, and in January 2011, a geophysical survey was performed at the site to identify possible contaminated underground areas.
Geology
The Distrito Federal is located in a regional high with no ma-jor surface drainage, being a natural divider of three mama-jor wa-tersheds and for this reason the groundwater is of strategic im-portance for the supply of rural and urban areas. In this region there are two groups of aquifers, called Fractured and Porous Domains. The first group consists of rock units where the water occupied spaces are represented by planar discontinuities. The second corresponds to soils, alteration mantle rocks and alluvial materials, in which the water occupies the intergranular spaces (Campos & Freitas-Silva, 1998).
The Fractured Domain is associated with four distinct litho-logic groups that make up the regional geolitho-logical context of the Distrito Federal: Parano´a, Canastra, Arax´a and Bambu´ı groups. The Parano´a group, aged from Meso to Neoproterozoic, occu-pies 65% of the total area of the Distrito Federal and in this re-gion, it can be divided, from base to top, into six lithostratigraphic units: meta-siltstone, slate, sandy metarhythmite, quartzite, clayey metarhythmite and psammo-pelitic-carbonated unit. The ground-water of the Fractured Domain presents understated risk of con-tamination since the overlapped aquifers of the Porous Domain act as a natural filter (Campos & Freitas-Silva, 1998).
The Porous Domain in the Distrito Federal corresponds to shallow and free aquifers, with extensive lateral continuity, usu-ally availed by shallow wells. These aquifers are moderately sus-ceptible to contamination by external agents. This Domain can be divided into systems based on hydraulic conductivity and thick-ness. In the study area, the predominant P1 system corresponds to Oxisol, resulting from weathering of the clayey metarhythmite (Campos & Freitas-Silva, op. cit.).
Figure 1 – Location of the study area.
METHODOLOGY
Theoretical review
The first successful attempts to use the resistivity as a tool for mineral exploration date from the early twentieth century. The rocks and soils, in general, are very resistive, but the presence of metallic substances, of natural or anthropogenic origin, may favor the passage of electric current. This fact led to the idealiza-tion of this method, initially for exploring metallic minerals, but during the second half of the twentieth century, the most common applications were those associated with groundwater, because the presence of water in the pores and/or fractures commonly reduces resistivity.
At first, prospecting of the underground water was tied to the oil industry since it could facilitate the detection of structural traps. Subsequently, this geophysical method was used to search for groundwater and, since the mid-twentieth century, for monitor-ing the contamination of aquifers (Van Nostrand & Cook, 1966; Orellana, 1972; Telford et al., 1985).
Although the electrical resistivity of soils and rocks de-pends on many factors such as porosity, soil or rock composi-tion, particle orientation and shape, and pore structure (Keller & Frischkecht, 1966; Parkhomenko, 1967), an important marker is the electrical resistivity of the fluid contained in the pores (water in particular). On the other hand, water resistivity tends to decrease with increasing dissolved solids (natural mineralization or addi-tion by polluaddi-tion). Polluaddi-tion, therefore, can lead to a substantial decrease of rock resistivity.
There are a number of publications showing how the resis-tivity can be used to identify or delimit polluted regions within the saturated zone. Generally, these works are carried out near garbage dumps and landfills, where contaminant plumes can oc-cur. These plumes tend to migrate to the subsurface, interacting with the soil and eventually reaching the saturated zone. The dif-ference between the electrical properties of the aquifer, saturated either with native water or different proportions of pollutant liq-uid, enables to delimit the polluted area (Mazac et al., 1987; Ellert et al., 1990; Meju, 1993; Costa & Ferlin, 1993; Matias et al., 1994; Frohlich et al., 1994; Costa et al., 1995; Nascimento et al., 1999a,b; Meju, 2000).
The direct current electrical resistivity method usually works with two current (A and B) and two potential (M and N) electrodes, all of them fixed onto the soil surface. A potential differential is applied between the electrodes A and B and, as a result, a di-rect electrical current travels through the soil. The current value is measured and recorded. The electrodes M and N are used to measure the potential difference that is established on soil and associated with the travelling current. It is noteworthy that the soil already has a natural electric potential, called spontaneous po-tential, which must be subtracted from the measurement between electrodes M and N. Knowing the current that travels the subsoil, the electrodes arrangement geometry and the potential measured between electrodes M and N allows to calculate an apparent elec-trical resistivity value named as such because it is measured in a heterogeneous and anisotropic medium as a function of the elec-trode array (Orellana, 1972; Telford et al., 1985).
i i
“main” — 2015/1/26 — 11:59 — page 294 — #4
i i
294
IDENTIFICATION OF GROUNDWATER CONTAMINATION USING 2-D ELECTRICAL IMAGING SURVEYIn the horizontal electrical profiling, also known as resistivity measurements, the four electrodes are moved in groups on the ground to obtain a set of measures regularly distributed along a given direction. When several measurement lines are performed in a given area, the results can be presented in the form of maps. The investigation depth depends on the spacing between the electrodes, signal to noise ratio, and local electrical properties, among others.
Since the mid-1980s, several automated devices to perform horizontal electrical profiling became available on the market, thus reducing the operating time. The common feature of such devices is the use of multiple electrodes connected independently that are activated or deactivated by means of a microcomputer to simulate the displacement of only four electrodes with different spacing on the ground.
This resistivity measuring device enables acquiring hundreds of resistivity measurements at different depths and throughout the area where the electrodes are placed. The large volume of data enables to present them as pseudo-sections, graphical represen-tations of the resistivity variation in the subsurface in two di-mensions, length and pseudo-depth. This type of work has been called 2-D electrical imaging and provides good results in areas of complex structure, where conventional electrical profiling is inad-equate.
The development of 2-D electrical imaging equipment was accompanied by the development of specific computer software to represent this type of measurement, such as RES2DINV (Loke & Barker, 1995, 1996). This software inverts the set of measures, i.e., allows to build a subsurface geoelectrical model, whose response to the energization reproduces, as best as possible, the mea-surements obtained. This geoelectrical model is subsequently in-terpreted in terms of the geological/hydrogeological/pedological model that fits best the studied area.
Technique and performed tests
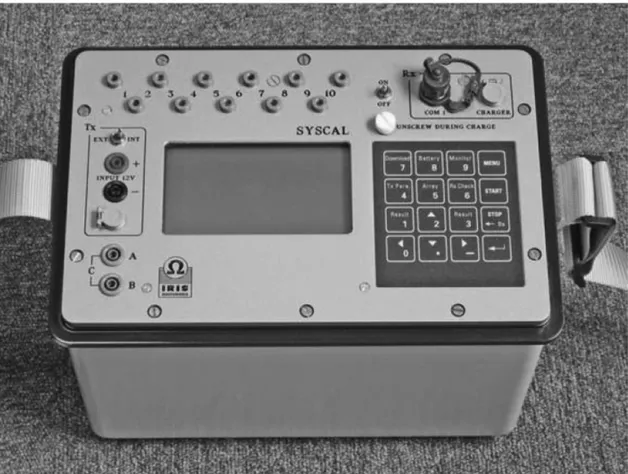
The geophysical equipment used during the field work was the SYSCAL Pro resistivity meter, manufactured by Iris Instruments, France (Fig. 2). This device combines transmitter and receiver in a single module, powered by a 12 V battery and whose specifica-tions include output voltage up to 1000 V. The SYSCAL Pro is a multichannel equipment, which allows multiple potential dipoles to be used simultaneously to obtain the resistivity measurements. The dipole-dipole arrangement allows fairly quick data acqui-sition, and enables studying the lateral variation of a given physi-cal parameter at different depths. This arrangement has the current
(AB) and the potential (MN) dipoles, which are most commonly placed linearly on the ground. The spacing between A and B is equal to the spacing between M and N both of which remain un-changed during data acquisition. The distance between dipoles is an integer multiple of the spacing between the electrodes that form a dipole, and should vary during acquisition. Greater depths are reached by increasing the distance between the dipoles. The measurements are plotted at the intersection of lines starting from the centers of the current and voltage dipoles, and form a 45-degree angle with the horizontal (Fig. 3). Equation (1) is used to calculate the apparent electrical resistivity.
ρa = K · R (1)
K = a · π · n · (n + 1) · (n + 2) (2)
R = ΔUI (3)
ρa = apparent resistivity (Ohm.m)
K = geometry factor for the used array (m) R = electrical resistance (Ohm)
a = spacing between electrodes which form a dipole (m) n = multiple of the distance between the dipoles
(typicallyn = 1, 2, 3, 4, 5 and 6) π = 3.1415
ΔU = electric potential difference (mV) I = electric current (mA)
Three lines of investigation were performed. Line 1 was 215 meters long, located upstream from the meat processing plant; Line 2 was 135 meters long, parallel to line 1, positioned imme-diately downstream from the plant; and, Line 3 was 180 meters long, parallel to the other two and positioned 70 meters down-stream from the plant. Data with dipoles of 5, 10 and 15 meters for 10 different levels (Fig. 4) were acquired in each section.
Data processing
The data have been processed jointly using the RES2DINV soft-ware (Loke & Barker, 1995, 1996). This softsoft-ware adopts a rapid technique for inverting apparent resistivity data into actual resis-tivity, which is much more useful for geological interpretation. Theoretically, it produces a subsurface geoelectrical 2-D model free of the distortions from the pseudo-sections of apparent re-sistivity caused by the geometry array used (Loke & Barker, op. cit.). The average depth of 37 meters was reached in the three sections, calculated by the Edwards depth model (1977) adopted by the RES2DINV software.
Figure 2 – SYSCAL Pro resistivity meter manufactured by Iris Instruments, France.
Figure 3 – Schematics of data acquisition using the dipole-dipole (DD) array at 10 different depths.
RESULTS AND DISCUSSION
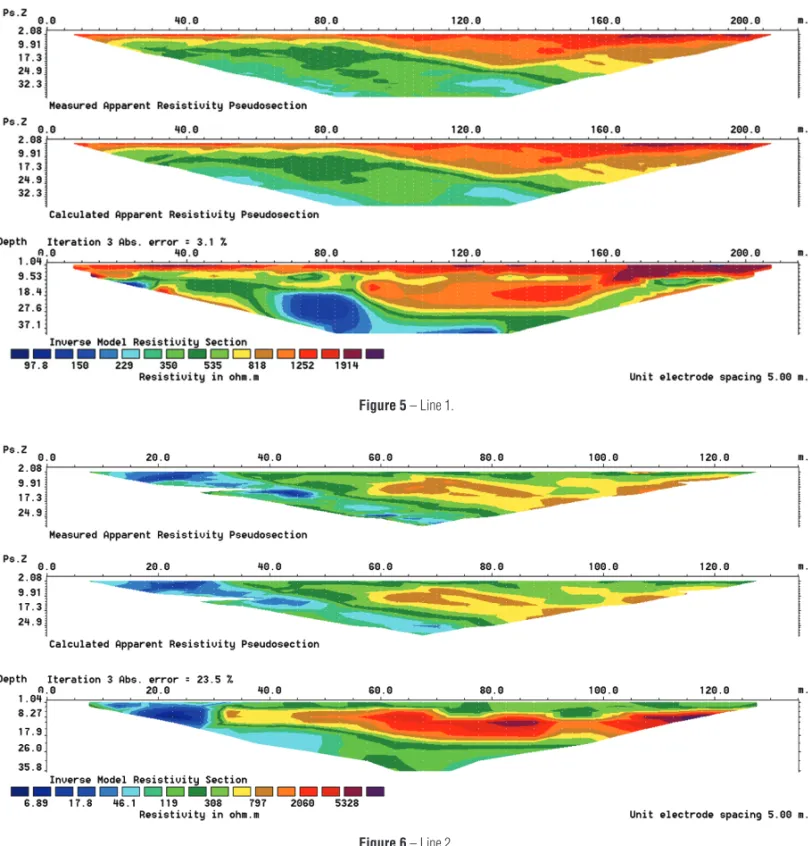
The apparent resistivity values obtained ranged from 223 to 2298 Ohm.m on Line 1; from 5 to 1873 Ohm.m on Line 2; and from 3 to 2546 Ohm.m on Line 3. Line 1 was located upstream of the area affected by the meat processing plant effluent, while lines 2 and 3 were downstream; therefore, higher resistivity val-ues were expected on line 1. Furthermore, because line 2 was located immediately downstream from the point where the efflu-ent was released the lowest resistivity values were expected on this line.
The apparent resistivity measurements were interpreted us-ing the RES2DINV software and the correspondus-ing sections are shown in Figures 5, 6 and 7. The resistivity values indica-tive of contamination adopted for these sections were less than 140 Ohm.m, since these values were only found in places where contamination was observed. Thus, the values between 140 and 2550 Ohm.m were considered to be associated with areas with-out contamination. Visual analysis showed a contaminated zone on line 1, at 80 meters. However, values indicative of a contami-nant plume were not expected on this line because the plume on
i i
“main” — 2015/1/26 — 11:59 — page 296 — #6
i i
296
IDENTIFICATION OF GROUNDWATER CONTAMINATION USING 2-D ELECTRICAL IMAGING SURVEY0 m 107 m 214 m
1
2
3
0 90 180 m
N
Figure 4 – Detailed study area showing the geophysical survey lines (lines 1, 2 and 3). Image source: SEDHAB (2012).
this spot is located downstream from the studied contamination source. Thus, detecting contaminant plume on this line may be an indicator of another contamination source in addition to the cesspool associated with the meat processing unit.
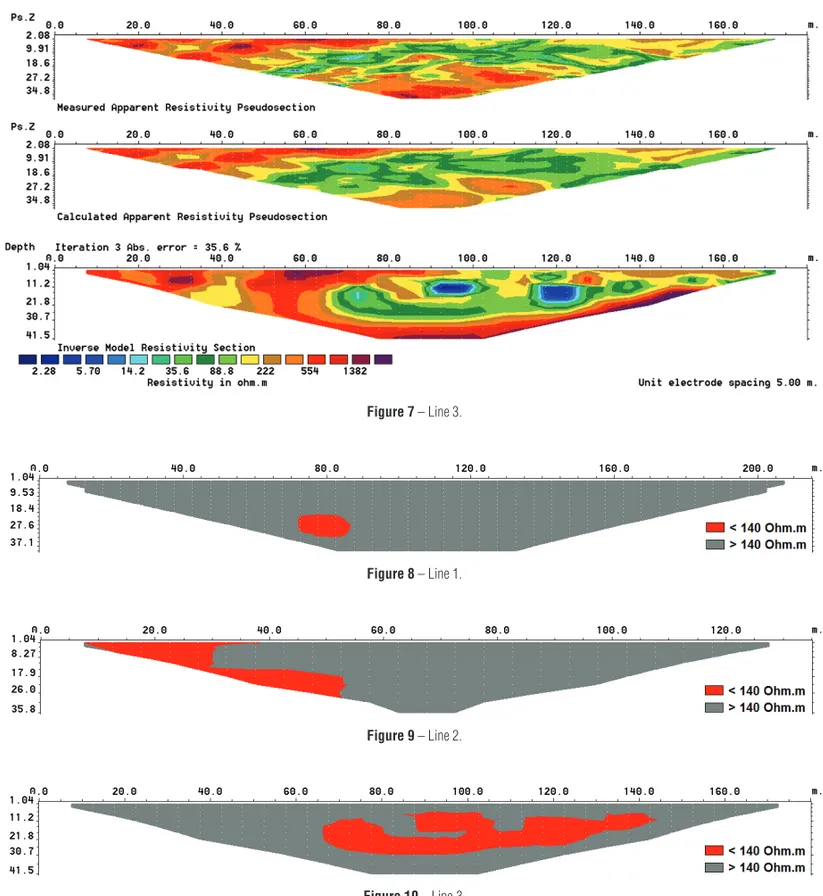
A plume of contamination was observed at 20 meters in line 2, which corresponds to the pollutant propagation following the flow of the groundwater. Line 3 shows specific regions of low resistivity at 95 and 120 meters, where the cesspools/cisterns of residential lots are located. Apparently, the effluent has been ac-cumulating in the tanks as the water is withdrawn.
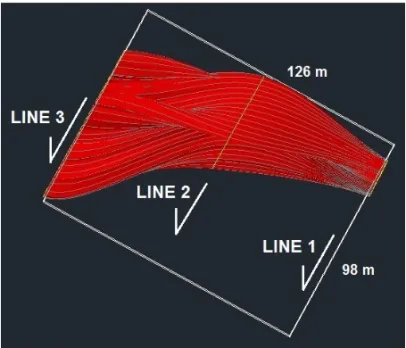
Although the resistivity sections can be examined individu-ally, the three images were grouped for the analysis. Therefore, the first step was to standardize the scales of the figures to highlight the anomalous resistivity values, which are linked to the simulta-neous spread of the effluent in the saturated zone in three sections (Figs. 5, 6 and 7). The RES2DINV output files, in figure format, were exported to Windows Paint software (Microsoft) for vector-ization (Figs. 8, 9 and 10). The three files were then exported to AUTOCAD (Autodesk) where the anomalies contours were geo-referenced and joined to generate a solid, whose shape must in principle be related to the shape of the contamination plume that spreads in the saturated zone (Figs. 11, 12 and 13).
The images of Figures 11, 12 and 13 show a low resistiv-ity zone in a region not compatible with what would be expected. The groundwater contamination was detected in February 2009, and after that the pollution-generating activities were interrupted.
In January 2011, a geophysical survey was carried out approx-imately 18 months after the underground contaminant disposal ceased. Although there are no data on the ability of the aquifer to return to its initial condition, it was expected that due to the time elapsed, the resistivity difference between the contaminated and non-contaminated areas would be smaller. Another feature that draws attention in these images is the point-source aspect of the upstream edge of the possible contamination plume (Fig. 13). Considering only the images of this possible plume, it is possible to conclude that it originates at 80 meters from Line 1 and prop-agates towards Line 3. The point-source of contaminant identi-fied and sealed in 2009 is 40 meters downstream of Line 1 and thus, the results lead to the assumption that there must be an-other source of contamination beyond the one identified in 2009 and that the effluent was being discharged until the date of the geophysical survey.
CONCLUSIONS
The geophysical survey performed in the study area was suitable for viewing the plume of contaminants originating from the meat processing unit. A plume of contaminant was observed and ex-pected downstream the company site; however, another plume observed upstream may indicate another point of effluent dis-charge, unknown at the time of the geophysical survey. The im-age processing to view the shape of the plume in three
dimen-Figure 5 – Line 1.
Figure 6 – Line 2.
sions allowed a better assessment of the contamination’s origin and pathway. In the light of the new evidence, new field inves-tigation should be conducted to determine other likely sources of contamination and also further geophysical surveying to better define the shape of the plume.
ACKNOWLEDGEMENTS
The authors are thankful to ADASA – Agˆencia Reguladora de ´Aguas, Energia e Saneamento B´asico do Distrito Federal; the
Laboratory of Applied Geophysics, Universidade de Bras´ılia; the Technician Jo˜ao Moreira Pacheco and Professor Welitom Rodrigues Borges of the Universidade de Bras´ılia.
REFERENCES
CAMPOS JEG & FREITAS-SILVA FH. 1998. Hidrogeologia do Distrito Federal. In: Invent´ario Hidrogeol´ogico e dos Recursos H´ıdricos Superfi-ciais do Distrito Federal. Bras´ılia, Instituto de Ecologia e Meio Ambiente do Distrito Federal/Universidade de Bras´ılia. 66 pp.
i i
“main” — 2015/1/26 — 11:59 — page 298 — #8
i i
298
IDENTIFICATION OF GROUNDWATER CONTAMINATION USING 2-D ELECTRICAL IMAGING SURVEYFigure 7 – Line 3.
Figure 8 – Line 1.
Figure 9 – Line 2.
Figure 10 – Line 3.
COSTA AFU & FERLIN C. 1993. M´etodos geof´ısicos aplicados `a defi-nic¸˜ao da contaminac¸˜ao das ´aguas subterrˆaneas. In: Simp´osio Brasileiro de Recursos H´ıdricos, 10., Porto Alegre, Proceedings... ABRH, 4: 453–461.
COSTA AFU, ZANINI LF, DIAS NL & CORREA O. 1995. Metodologia geof´ısica para detecc¸˜ao de ´aguas subterrˆaneas; caso do Lix˜ao da Estrada da Palha. A ´Agua em Revista, 3: 24–37.
EDWARDS LS. 1977. A modified pseudo-section for resistivity and
in-duced polarization. Geophysics, 42: 1020–1036.
ELLERT N, ROSS S, MENDES JMB & MARTIN E. 1990. Mapeamento geof´ısico do lix˜ao de S˜ao Carlos. In: Congresso Brasileiro de ´Aguas Subterrˆaneas, 6., Porto Alegre, Proceedings... ABAS, p. 82–88. FROHLICH RK, URISH DW, FULLER J & O’REILLY M. 1994. Use of geoelectrical methods in groundwater pollution surveys in a coastal environment. Journal of Applied Geophysics, 32: 139–154.
Figure 11 – Top view of the solid associated with the contamination plume.
Figure 12 – Downstream to upstream view.
i i
“main” — 2015/1/26 — 11:59 — page 300 — #10
i i
300
IDENTIFICATION OF GROUNDWATER CONTAMINATION USING 2-D ELECTRICAL IMAGING SURVEYKELLER GV & FRISCHKNECHT FC. 1966. Electrical methods in geo-physical prospecting. International series of monographs in electromag-netic waves. Pergamom Press, v. 10. 519 pp.
LOKE MH & BARKER RD. 1995. Least-squares deconvolution of appar-ent resistivity pseudosections. Geophysics, 60: 1682–1690.
LOKE MH & BARKER RD. 1996. Rapid Least-squares inversion of appar-ent resistivity pseudosections by a quasi-newton method. Geophysical Prospecting, 44: 131–152.
MATIAS MS, SILVA MM, FERREIRA P & RAMALHO E. 1994. A geophys-ical and hydrogeologgeophys-ical study of aquifers contamination by a landfill. Journal of Applied Geophysics, 32: 155–162.
MAZAC O, KELLY WE & LANDA I. 1987. Surface geoelectrics for ground-water pollution and protection studies. Journal of Hydrology, 93: 277– 294.
MEJU MA. 1993. Geophysical mapping of polluted groundwater in a closed landfill site. In: International Congress of the Brazilian Geophys-ical Society, 3., Rio de Janeiro, Proceedings... SBGf, 1: 425–428. MEJU MA. 2000. Geoelectrical investigation of old/abandoned, covered landfill sites in urban areas: model development with a genetic diagno-sis approach. Journal of Applied Geophysics, 44: 115–150.
NASCIMENTO CTC, KOIDE S & PIRES ACB. 1999a. Contaminac¸˜ao do subsolo monitorada por resistividade el´etrica. In: International Congress
of the Brazilian Geophysical Society, 6., Rio de Janeiro, Proceedings... SBGf, CD-ROM.
NASCIMENTO CTC, KOIDE S, PIRES ACB & MELLO GA. 1999b. Pseudo-sec¸˜oes el´etricas na avaliac¸˜ao da contaminac¸˜ao do subsolo. Re-vista Brasileira de Geociˆencias, 29: 621–626.
ORELLANA E. 1972. Prospeccion Geoelectrica en Corriente Continua. Madrid, Paraninfo, 523 pp.
PARKHOMENKO EI. 1967. Electrical properties of rocks. KELLER GV (Ed.). Translated from Russian, Plenum Press, New York, 314 pp. SEDHAB. Secretaria de Estado de Habitac¸˜ao, Regularizac¸˜ao e Desen-volvimento Urbano. 2012. Ortofotocarta 132. Bras´ılia, Distrito Federal. Available on:
<http://www.sedhab.df.gov.br/downloads/suplan/index sirgas.htm>. Access on: Nov. 19, 2012.
TELFORD WM, GELDART LP, SHERIFF RE & KEYS DA. 1985. Applied Geophysics. Cambridge, Cambridge University Press, 860 pp. VAN NOSTRAND R & COOK KL. 1966. Interpretation of Resistivity Data. Geological Survey Professional Paper 499. Washington, United States Geological Survey, 310 pp.
Recebido em 30 janeiro, 2012 / Aceito em 14 abril, 2014 Received on January 30, 2012 / Accepted on April 14, 2014
NOTES ABOUT THE AUTHORS
Rafael Machado Mello graduated in Biology at the Centro Universit´ario de Bras´ılia (2004). Holds a M.Sc. in Environmental Technology and Water Resources
(UnB – 2013). Currently, works as Executive Manager of ADASA – Agˆencia Reguladora de ´Aguas, Energia e Saneamento B´asico (Regulatory Agency for Water, Energy and Sanitation) of the Distrito Federal.
Carlos Tadeu Carvalho do Nascimento holds a degree in Geology (UnB – 1993), Master in Environmental Technology and Water Resources (UnB – 1998) and a
Ph.D. in Geology (UnB – 2003). Currently, works as assistant professor at the Universidade de Bras´ılia, in Planaltina. Has experience in Geosciences with emphasis on Applied Geophysics, working mainly in the area of environment.
Sergio Koide holds a degree in Civil Engineering from the Universidade de Bras´ılia (UnB – 1975), specialization in Pipelines and Terminals Engineering from
Petrobras (1976), Master in Civil Engineering (Water Resources) from COPPE-UFRJ (1984) and Ph.D. (water) from the Imperial College – University of London (1990). Currently, works as Associate Professor at the Universidade de Bras´ılia. Has experience in Sanitary Engineering with emphasis on Water Resources, more specifically: surface and groundwater hydrology (quantity and quality), contamination, and water supply networks (losses and contamination).
Jo ˜ao Cˆandido Magalh ˜aes is an undergraduate student in Geophysics from the Universidade de Bras´ılia, and works with geophysical data processing and CAD