www.scielo.br/rbg
LONGITUDINAL AND DAY-TO-DAY VARIATIONS OF EQUATORIAL SPREAD F OCCURRENCE
FROM OBSERVATIONS OVER SOUTH AMERICA
Ricardo Yvan de La Cruz Cueva
1, Cesar E. Valladares
2, Eurico Rodrigues de Paula
3, Mangalathayil Ali Abdu
3,
Igo Paulino
4, Inez Staciarini Batista
3, Hisao Takahashi
3and Jean Pierre Raulin
5ABSTRACT.In this work we studied the longitudinal and day-to-day variability of equatorial spread F occurrence over South America. Digisonde from the equatorial stations of S˜ao Lu´ıs and Jicamarca, and Total Electron Content (TEC) data from several GPS receivers were used to analyse the ionospheric conditions conductive to ionospheric plasma irregularity generation during the solar minimum months of September 2009 to January 2010. To support this analysis an Automatic-Bubble-Detection-Algorithm was used to detect abrupt decreases that plasma bubbles introduce in the TEC values. The bubble occurrence pattern over South America (SA) observed in this work maximizes on September-October (equinox) in the west and November-January (December solstice) in the east-longitudes. However, on a day-to-day basis bubble signatures are also detected all over SA during this period. Besides being observed during days with pronounced prereversal enhancement (PRE), as expected, the TEC depletions were also observed during days without PRE, during equinox at Jicamarca and December solstice at S˜ao Lu´ıs. This unex-pected occurrence of TEC depletions (TECds) suggests that seeding mechanisms, like periodic structures are present and modify the onset conditions of bubble-events. In this report are shown evidences of wave-like structures previous to bubble development.
Keywords: day-to-day variation, equatorial spread F, aeronomy.
RESUMO.Neste trabalho estuda-se a variabilidade longitudinal e o dia-a-dia da ocorrˆencia dospreadF equatorial sobre a Am´erica do Sul. Digissondas das estac¸˜oes equatoriais de S˜ao Lu´ıs e Jicamarca, e dados de Conte´udo Eletrˆonico Total (TEC) de v´arios receptores GPS foram usados para analisar as condic¸˜oes ionosf´ericas para a gerac¸˜ao de irregularidades de plasma ionosf´erico durante os meses de m´ınimo solar de Setembro 2009 a Janeiro 2010. Para dar suporte a esta an´alise um Algoritmo de Detecc¸˜ao Autom´atica de Bolhas foi usado para detectar decr´escimos abruptos nos valores de TEC. O padr˜ao de ocorrˆencia de bolhas sobre a Am´erica do Sul observado neste trabalho s˜ao Setembro-Outubro (equin´ocio) no leste e Novembro-Janeiro (solst´ıcio de Dezembro) nas longitudes leste. Entretanto, na observac¸˜ao dia-a-dia as assinaturas de bolhas s˜ao tamb´em detectadas sobre toda Am´erica do Sul neste per´ıodo. Al´em de ter sido observado durante dias com pronunciado pr´e-reversal enhancement (PRE), como esperado, as deplec¸˜oes TEC foram tamb´em observadas durante dias sem PRE, durante equin´ocio em Jicamarca e solst´ıcio de Dezembro em S˜ao Lu´ıs. Esta ocorrˆencia inesperada de deplec¸˜oes TEC (TECds) sugere que mecanismos geradores, como estruturas peri´odicas est˜ao presentes e modificam as condic¸˜oes de in´ıcio de eventos-bolhas. Neste trabalho s˜ao apresentados resultados mostrando evidˆencias de estruturas tipo onda pr´evio ao desenvolvimento de uma bolha.
Palavras-chave: variabilidade dia-a-dia,spreadF equatorial, aeronomia.
1Universidade Estadual do Maranh˜ao (UEMA), Physics Department, Cidade Universit´aria Paulo VI s/n, Tirirical, 65055-970 S˜ao Lu´ıs, MA, Brazil. Phone: +55(98) 2016-8730 – E-mail: [email protected]
2The University of Texas at Dallas, William B. Hanson Center for Space Sciences, TX, USA. Phone: +1(972) 883-5349 – E-mail: [email protected] 3Instituto Nacional de Pesquisas Espaciais (INPE), Aeronomy Division, DAE, S˜ao Jos´e dos Campos, 12227-010 S˜ao Paulo, SP, Brazil. Phone: +55(12) 3945-7163 – E-mails: [email protected]; [email protected]; [email protected]; [email protected]
4Universidade Federal de Campina Grande (UFCG), Physics Department, Av. Apr´ıgio Veloso, 882, Bodocong´o, 58429-140 Campina Grande, PB, Brazil. Phone: +55(83) 3310-1196 – E-mail: [email protected]
5Universidade Presbiteriana Mackenzie, Centro de Radio Astronomia e Astrof´ısica Mackenzie, CRAAM, Rua da Consolac¸˜ao, 896, 01302-907 S˜ao Paulo, SP, Brazil. Phone: +55(11) 2114-8724 – E-mail: [email protected]
i i
“main” — 2018/8/9 — 15:32 — page 28 — #2
i i
28
LONGITUDINAL AND DAY-TO-DAY VARIATIONS OF EQUATORIAL SPREAD F OCCURRENCE FROM OBSERVATIONS OVER SOUTH AMERICAINTRODUCTION
The ionospheric F layer height conditions near sunset are known to influence the generation of the spread F irregularities (Farley et al., 1970; Fejer, 1997; Fejer et al., 1999; Abdu, 2005; Muella et al., 2008). A large uplift of the F layer in the evening hours due to the Prereversal Enhancement (PRE) in the zonal electric field, can establish the precondition for the plasma instability development that lead to the generation of equatorial Spread F (ESF). The PRE is one of the most important factors controlling the generation of plasma bubble, but not the only one as pointed out by Fejer et al. (1999), Abdu et al. (2009b), Takahashi et al. (2010) and Tsun-oda (2008; 2010a, b). A seed perturbation is a necessary require-ment for the initiation of the Gravitational Rayleigh Taylor (GRT) instability (Haerendel et al., 1992) to initiate equatorial plasma bubbles. Looking for seeding mechanisms, several authors have suggested that the atmospheric gravity waves generated at tro-pospheric altitudes and propagating upward to ionospheric alti-tudes are a potential source for the seeding (Kelley et al., 1981; Hysell et al., 1990; Kherani et al., 2009; Abdu et al., 2009b; Takahashi et al., 2010).
Takahashi et al. (2010) observed a sinusoidal structure in OI 630 nm airglow depletions and vertical oscillations in the F layer bottom height in association with bottom-type irregularity struc-tures that might indicate AGW as the seed mechanism to gen-erate plasma bubbles. Keskinen et al. (2009) concluded that the zonally propagating gravity waves, in the presence of zonal tidal winds, are needed for the excitation of equatorial ionospheric bubbles. Large-Scale Wave Structure (LSWS) is also mentioned as a candidate for seed mechanism by Tsunoda (2008; 2010a, b) and Tsunoda et al. (2010), that was supported by Thampi et al. (2009) who observed modulations in the Total Electron Con-tent (TEC) simultaneously with oscillatory structures in the bot-tomside of the F region as seen in Kototabang VHF radar RTI maps. Narayanan et al. (2012) suggested that even in the absence of significant PRE, the presence of LSWS and SSWS (Small-Scale Wave Structure) might be important for Equatorial Plasma Bubble (EPB) generation. Further, Tsunoda et al. (2011) found that the growth rate of LSWS can be substantial during the PRE, as a seed for the instability process. A common characteris-tic is that both (GW and LSWS) are wave-like forms acting as a potential seed to initiate the instability growth leading to the onset of plasma bubbles.
The behavioral pattern of the equatorial ionospheric plasma at different longitudes is well known due to several studies made at particular equatorial stations. Chen et al. (2006) have made a study of the equatorial ionosphere using data from a digisonde
and GPS receivers over the western sector of South America (SA), whereas Abdu et al. (1983a, 1983b) have studied the eastern sector with ionosondes. Abdu et al. (1981, 1992) and Batista et al. (1990) compared the spread F conditions with ionosondes be-tween eastern and western sectors. The principal finding in these previous works is that the differences in the magnetic field dec-lination angle cause significant differences in the conjugate E re-gion sunset duration between different longitude sectors, so that the magnetic declination angle controls the longitudinal and sea-sonal pattern of the evening spread F plasma bubble develop-ment. Recently Seemala & Valladares (2011) used data from the Low-Latitude Ionospheric Sensor Network (LISN) GPS Network and three other GPS Networks and the Automatic Bubble Detec-tion Algorithm (ABDA) to investigate the day-to-day variability in spread F occurrence, being the first regional study covering broad range of GPS observations over the South American continent. Their explanation for the seasonal climatology of spread F agrees with Tsunoda’s (2010a) hypothesis based on the requirement for Solar terminator-B Alignment (STBA) and Gravity Wave-B Align-ment (GWBA), the day-to-day variability in spread F occurrence being attributed to the day-to-day variation in the proximity of the Inter-Tropical Convergence Zone (ITCZ) to the magnetic equator, which requires further study.
In this work, data from multiple instruments, including a large number of GPS receivers, were analyzed jointly using the ABDA algorithm, for the period September 2009 to January 2010. This provided a unique opportunity to compare the local and regional behavior of preconditioning of the nighttime equatorial ionosphere.
The discussion about seeding mechanisms is one of the newest goal in the scientific community, without leaving aside PRE as a major spread F precursor at sunset hours. LSWS and GW propagating in the equatorial thermosphere play an important role as the initial perturbation in the lower ionosphere required for GRT instability growth and consequently spread F formation. But, how effective are these mechanisms compared with PRE or how effective are they together? An attempt to answer these questions is the motivation of the current report.
Prereversal enhancement is considered a necessary condi-tion for plasma bubbles development but not sufficient, since it lifts the plasma up at local sunset which makes the ambient iono-sphere more unstable for the initiation of the GRT mechanism. According to Basu et al. (1996) – post-sunset vertical drifts in the range of 10-20 m/s are necessary for the occurrence of spread F during equinox, under solar minimum conditions. When the drift velocities are large enough the necessary seeding mechanism for
spread F generation always appears to be present. The results presented by Fejer et al. (1999) highlight the importance of the upward drift velocities on the generation of spread F, and also the importance of the evolution of the unstable layer that can be strongly affected by the drift velocities after the evening reversal. They also remarked that large downward drifts after sunset rapidly decrease the layer height, consequently reducing the instability growth rates during equinoxes and June solstice.
The fast upward movement of the F layer during local sun-set is favorable for the Rayleigh-Taylor mechanism to start and to generate plasma irregularities that reach high altitudes in the equatorial F region. The plasma depletions move upward over the magnetic equator, with simultaneous mapping along the magnetic field lines to magnetic low latitudes, originating the bubbles. The detection of plasma depletions using the ABDA technique allows us to observe the TEC depletions over the equator and simultane-ously over the southern and northern crests of the EIA (Equatorial Ionization Anomaly).
This paper is organized as follows: Section 2 describes the in-strumentation used to obtain the data sets during the last extended solar minimum period. Section 3 introduces the digisonde data. This section also presents a longitudinal study on individual days with multiple instruments and statistics. Section 4 discusses our results and summarizes the findings.
INSTRUMENTATION AND DATABASE
The TEC data from the LISN GPS receivers, the true heights and vertical drift inferred from Brazilian and Peruvian digisondes dur-ing nighttime for the solar minimum period of September 2009 to January 2010 (average 10.7 cm SFU of 76), were used to study the longitudinal and day-to-day variations of equatorial spread F. Here is good to point out that Jicamarca LT is 5 h earlier than UT and S˜ao Lu´ıs LT is 3 h earlier than UT. Only quiet time data with average Kp less than or equal to 3 for the 6 hours preceding sunset were used in this analysis.
RTI (Range-Time-Intensity) maps generated by the S˜ao Lu´ıs 30 MHz coherent radar (de Paula & Hysell, 2004) and Jicamarca 50 MHz coherent scatter ionospheric radar are also used in this analysis. VHF radars are sensitive to few meter scale size irreg-ularities. The bottom-type structures observed in the RTI plots are manifestation of Rayleigh-Taylor Instabilities processes, and radar plumes are manifestation of the existence of developed plasma bubbles.
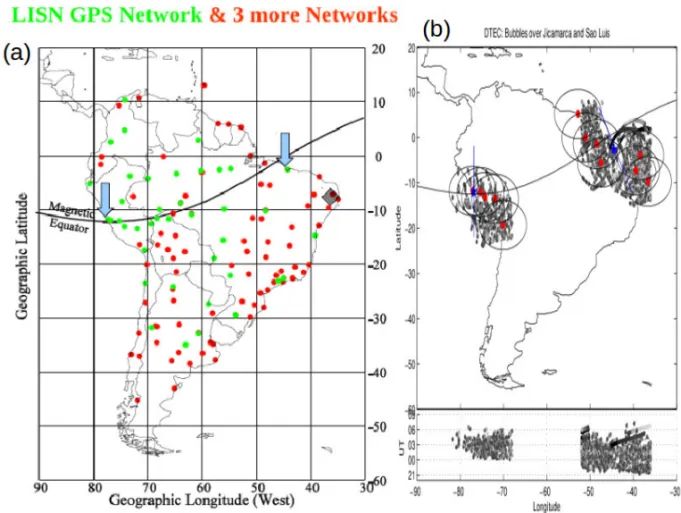
Data from four GPS networks with 127 receivers, shown in Figure 1(a), were used to study the ambient ionospheric plasma. They are LISN (Valladares & Chau, 2012), Ohio State University
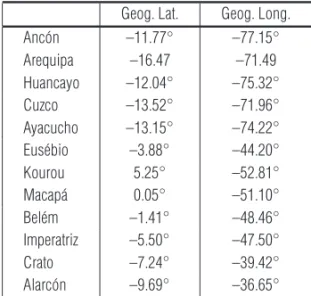
– Central and Southern Andes GPS Project (OSU-CAP), Geocen-tric Reference System for the Americas (SIRGAS) (Brunini et al., 2010) and International GNSS Service (IGS) (Dow et al., 2009). These GPS receivers cover most of the South American continent area with geographic longitude coverage of 35◦to 80◦West and latitude of 45◦S to 13◦N (magnetic latitudes in the range of 35◦S to 20◦N). For our study we decided to use few stations, mainly the ones located few kilometer around the digisonde station (see Table 1) as observed in red dots in Figure 1(b), the circumference around each GPS station has a radio of 606.23 km (5◦) that is the sky-view of each receiver in ionospheric altitude of 350 km. In this figure we plotted the DTEC values, which is an index for TEC depletion.
Table 1 – Geographic latitude and longitude of GPS stations
located around S˜ao Lu´ıs and Jicamarca equatorial stations. Geog. Lat. Geog. Long. Anc´on –11.77◦ –77.15◦ Arequipa –16.47 –71.49 Huancayo –12.04◦ –75.32◦ Cuzco –13.52◦ –71.96◦ Ayacucho –13.15◦ –74.22◦ Eus´ebio –3.88◦ –44.20◦ Kourou 5.25◦ –52.81◦ Macap´a 0.05◦ –51.10◦ Bel´em –1.41◦ –48.46◦ Imperatriz –5.50◦ –47.50◦ Crato –7.24◦ –39.42◦ Alarc´on –9.69◦ –36.65◦
The vertical plasma drifts were calculated every 15 minutes as d(hF)/dt from digisonde true heights at the specific plasma frequencies of 3, 4, 5 and 6 MHz. The vertical drifts calculated from true heights are reliable representations of the plasma drifts when the F layer rises up above 300 km during the PRE as stated by Bittencourt & Abdu (1981) and Abdu et al. (2009b), for solar maximum. The high resolution of the virtual heights (h’F) is deter-mined by the pulse width/coding and varies from 5 km to 10 km for the height ranges of 500 km to 1000 km that are usually set for the ionograms. The true heights that are extracted from a series of virtual heights also have similar degree of height resolution as that of the virtual heights.
The number of available days of data analyzed for each month/equatorial station is presented in Tables 2 and 3, and num-bers in parenthesis means no PRE/TECd observations for each month over each region/equatorial station.
The airglow OI 630.0 nm emission corresponding to the night of October 11th, 2009 was measured by an all-sky imager located
i i
“main” — 2018/8/9 — 15:32 — page 30 — #4
i i
30
LONGITUDINAL AND DAY-TO-DAY VARIATIONS OF EQUATORIAL SPREAD F OCCURRENCE FROM OBSERVATIONS OVER SOUTH AMERICAFigure 1 – On the left panel, LISN GPS Network (in green) and 3 more Networks (in red). The arrows indicate the Jicamarca and S˜ao Lu´ıs digisondes, the diamond
indicates the position of the imager at S˜ao Jo˜ao do Cariri. On the right panel, TEC depletions detected using the ABDA algorithm, as red dots are the GPS stations used in this work and in blue stars are the digisonde station. Also as blue line is possible to observe the magnetic declination.
Table 2 – It is shown in the first two rows the number of available days for the digisonde
and GPS instruments for the East/S˜ao Lu´ıs region. Below is shown the PRE and TEC deple-tions (TECd) data set for each month from September 2009 to January 2010. The numbers in parentheses means that there are no PRE or no TECd observations, respectively.
East/S˜ao Lu´ıs region
September October November December January
DIGISONDE 29 31 30 30 26
GPS 30 31 30 31 31
PRE 16(13) 29(02) 26(04) 28(02) 20(06) TECd 7(13) 25(06) 30(0) 28(02) 26(05)
Table 3 – It is shown in the first two rows the number of available days for the digisonde
and GPS instruments for the West/Jicamarca region. Below is shown the PRE and TEC deple-tions (TECd) data set for each month from September 2009 to January 2010. The numbers in parentheses means that there are no PRE or no TECd observations, respectively.
West/Jicamarca region
September October November December January
DIGISONDE 17 31 29 31 31
GPS 30 31 30 31 31
PRE 14(03) 26(05) 24(05) 21(08) 11(14) TECd 6(14) 21(10) 15(15) 9(22) 5(26)
at S˜ao Jo˜ao do Cariri (35.7◦W, 7.4◦S). The imager used in the present work consists of a fisheye, telecentric and re-imaging lens system, optical filters (630.0 nm) and a CCD imaging device. The cooling CCD camera has 1024×1024 pixels with 24 micron el-ements, which made it possible to take an image of OI 630.0 nm emission with a time integration of around 90 seconds.
DATA ANALYSIS
The principal aim of this paper is to analyze quantitatively the role of the PRE as a preconditioning mechanism through the Rayleigh-Taylor instability process leading to the development of ionospheric plasma bubbles over SA equatorial stations. To reach this objective the TEC depletions detection using ABDA and si-multaneous vertical plasma drift and RTI radar maps (when avail-able) are analyzed.
The first step of the data analysis consists of calculating the equivalent vertical TEC for each one of the available GPS receivers close to the equatorial station (either Jicamarca and S˜ao Lu´ıs) using an analysis code that was developed at Boston College. In the following step, the TEC depletions caused by plasma bub-bles were automatically identified by examining the TEC traces from the GPS satellite passes over each station. The algorithm here is labeled as ABDA for Automatic Bubble Detection Algo-rithm. Detecting depletions in the TEC is an indirect way to find bubbles of tens to hundreds of kilometers scale size. This tech-nique is very well documented by Weber et al. (1996), Valladares et al. (2004) and recently by Seemala & Valladares (2011). This procedure detects TEC depletions (TECd) with periods between 10 to 120 minutes when the depletion amplitude falls below 1 TECU (1016 electrons/m2). The bubble detection is confirmed if the
ob-serving elevation angle is above 30◦and TEC recovers to a value closely similar to the starting TEC. The criterion to point bubble occurrence over an specific region requires more than five bub-bles signature traces over the region.
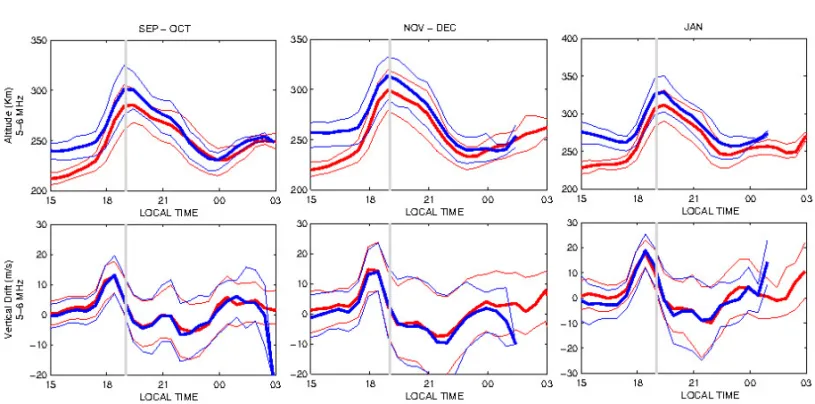
Figures 2 and 3 show the true height and vertical drift ve-locity (VZ) for S˜ao Lu´ıs and Jicamarca ionosonde stations,
re-spectively. The mean average was made for September-October 2009, November-December 2009 and January 2010 months. The red (blue) thick line represents 5 MHz (6 MHz), and the adja-cent thin lines correspond to the 25 (75) peradja-centile above (below). The gray vertical bars represent the local sunset time. Figures 2 and 3 present the typical patterns, of altitude and vertical drift, around the sunset period, containing a pronounced peak (PRE) after sunset.
According to Batista et al. (1986) the threshold altitude for h’F for spread F event generation around post-sunset hours
dur-ing solar maximum periods is 300 km, which gives confidence of using ionosonde measurements to infer vertical drifts around these hours. However, in the present work, it was considered both the true height of 250 km and the vertical drift velocity of 10 m/s as a threshold conditions for the PRE event, since the data are related to solar minimum conditions (Bittencourt 2012, personal communication). Even though in the figures it was presented true heights and vertical drift for 3 to 6 MHz frequencies, it was con-sidered in the analysis of these parameters just the frequency of 6 MHz. Additionally, for analysis, the VHF radar RTI images from both stations were used to determine whether the plasma irregu-larities were present.
As observed in Figure 2 (top panels), the mean true height at 6 MHz (blue thick line) around 19 LT increased from Sep-Oct to Nov-Dec and January months from 300 km to 330 km which was also observed by Muella et al. (2009) but for solar maximum. Around local midnight the true heights reach their minimum val-ues and another but not a substantial increase is observed in the 00-03 LT time interval. The 25-75 percentiles show that the day-to-day true height variability is larger after prereversal hours up to the local midnight. The peak of the mean vertical drift veloc-ities (bottom panels of Fig. 2) increases from 12 m/s to 18 m/s around local sunset period from September to January. The 25 to 75 percentiles ranges are about 10 m/s and up to 25 m/s after prereversal hours, showing a very large variability of drift velocity at these hours.
Figure 3 shows true height (top panels) and vertical drift velocity (bottom panels) for the Jicamarca digisonde. During September-October a well defined true height peak with altitude average over 300 km (around 20 LT) and vertical velocity peak of 10 m/s around 19 LT can be observed. During the November-December period the true height values present a peak around 20 LT, a small valley and another peak around local midnight. A continuous increase up to 22 LT during January is observed. Similar to S˜ao Lu´ıs larger data variability represented by their quartiles are observed after the prereversal hours lasting up to local midnight for both true height and vertical drifts parameters.
Study of PREversus Bubble Formation
The ABDA algorithm detects TEC depletions (TECd) in the iono-sphere, and the digisonde parameters give information about the ionosphere background conditions like F region altitude and PRE vertical drift velocity, which are related to bubble generation. Simultaneous VHF radar plume observations provide additional valuable information to confirm if the presence of the PRE was
i i
“main” — 2018/8/9 — 15:32 — page 32 — #6
i i
32
LONGITUDINAL AND DAY-TO-DAY VARIATIONS OF EQUATORIAL SPREAD F OCCURRENCE FROM OBSERVATIONS OVER SOUTH AMERICAFigure 2 – Shows the true height and vertical drift velocity (VZ) for S˜ao Lu´ıs ionosonde equatorial station. The mean average was made for September-October 2009,
November-December 2009 and January 2010 months. The red (blue) thick line represents 5 MHz (6 MHz), and the adjacent thin lines correspond to the 25 (75) percentile above (below). The gray vertical bars represent the local sunset time.
Figure 3 – Same as Figure 2 for Jicamarca digisonde.
favorable for equatorial plasma bubbles generation. The plasma irregularities with plume development, detected by the ABDA al-gorithm, expected during well developed PRE was mostly ob-served in September-November over Jicamarca and November-January over S˜ao Lu´ıs. However, this expected behavior is not observed in some cases even when the vertical plasma velocity, around local sunset, reaches velocities larger than 20 m/s. Ac-cording to Fejer et al. (1999) plumes can be inhibited even when
the PRE reaches large values if the vertical drift velocity after local sunset drops below negative velocities in less than 30 minutes. In the following sections, the longitudinal spread F variability events corresponding to 03 and 19 of November 2009, and 01 September 2009 will be presented.
For the TECd maps is important to clarify that the date is re-lated to UT schedule, and day 01 of September will be write in this map as 02 of September.
In this section we had considered recombination processes correction in the vertical drift using the Nogueira et al. (2011) methodology and references therein. Below a threshold height the apparent vertical velocity starts to depart significantly from the true ExB drift velocity; due to the importance of recombina-tion processes at these lower heights. Then, the apparent vertical drift represents the sum of the true vertical drift and a contribution due to the recombination processes.
Case 1: November 03, 2009 (DoY 307)
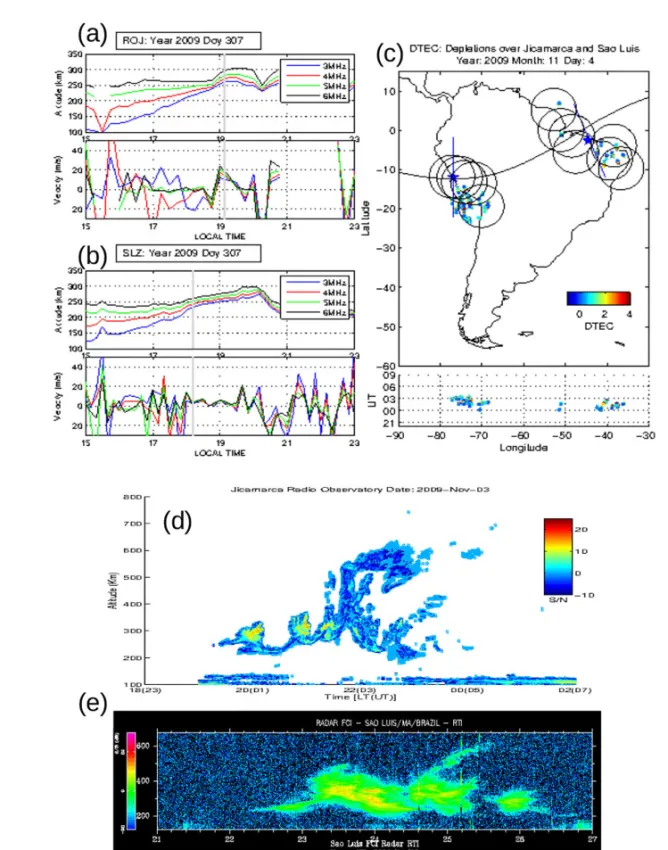
Pursuing the idea that the PRE is the most important condi-tion/mechanism for plasma bubble generation, then the panels (a) and (b) of Figure 4 show Jicamarca (JRO) and S˜ao Lu´ıs (SLZ) digisonde parameters, respectively. The panel (a) presents the Ji-camarca true heights for the frequencies of 3, 4, 5 and 6 MHz, and below their corresponding vertical drift velocities. The same for S˜ao Lu´ıs are shown in panel (b). In panel (c) a TEC depletion map generated with the ABDA algorithm is shown for November, 03, 2009. The color coded lines represent the unit of TEC de-pletions detected by the ABDA algorithm with their corresponding geographic location, when most red means 4 TEC units depletion. The UT depletion occurrence is shown below the map.
The Figure 4 shows that over Jicamarca the PRE was pro-nounced and reached PRE peak velocity at local subset of 22 m/s, and the true height was around 300 km. As expected from the theory TEC depletions were observed around Jicamarca equa-torial station, and mainly south of the station, which indicate that the PRE was the most probable mechanism for generation of hundreds of kilometers irregularities. The last is verified with the RTI image (panel d) available for JULIA radar with a well de-veloped plume around 22 LT hours. This event shows PRE as a bubble generator.
Meanwhile, over S˜ao Lu´ıs equatorial station the phenomena behaved different. In panel (b) is observed around the local sun-set that the vertical velocity oscillates around and less than 5 m/s, and the true height is increasing constantly with altitude of around 250 km at local sunset. However, In panel (c) we can observe de-tected depletions south and north of the equatorial station also confirmed with the RTI image over S˜ao Lu´ıs with plume devel-oped around 20 LT (23 UT). This event in the eastern region of SA gives evidence that only the PRE does not generate the necessary and sufficient condition for bubble occurrence. As proposed by Abdu et al. (2009b) and Tsunoda (2008; 2010a, b) in this case the trigger mechanism of RT instability could be Gravity Waves (GW) or Large-Scale Wave Structure (LSWS).
Case 2: November 19, 2009 (DoY 323)
For this case we have two different events in Figure 5. In panel (a) we observe over Jicamarca station well developed PRE as seen in altitude and velocity parameters, with peak altitude of 300 km and peak velocity of around 20 m/s which seems very good for solar minimum conditions. Meanwhile, there is no depletions detected in the ABDA map, neither in the RTI map (see panel (d)). Since the PRE phenomena is so evident is unexpected not to have bub-bles over the region, which probably means that another unclear mechanism inhibited the medium-scale size irregularities. Is good to clarify that GPS data is available for the receivers used in this analysis. As shown by Saito & Maruyama (2007) and Maruyama et al. (2007, 2009), ESF can be inhibited by the transequato-rial meridional wind even with strong post-sunset ionospheric height rise. For this event probably the transequatorial meridional wind could inhibited the ESF formation, requiring more studies for better conclusion.
Over the eastern region of SA continent we can observe a clus-ter of depletions detected (see panel (c)), and in the RTI image over S˜ao Lu´ıs there is a well developed plasma bubble after 20.5 LT (23.5 UT) hours. In a detailed analysis of the digisonde param-eters we can appreciate that the altitude paramparam-eters were around 270 km and the vertical velocity at the local sunset was below 10 m/s. Then around 20 LT hours the vertical drift was oscillating between 20 and –20 m/s. In other words, there is minimal or no condition for generating spread F in the F region, and seems that the small PRE played a significant role for spread F formation as observed in the VHF radar and GPS receivers.
On other hand, summer solstice in Brazil is identified as high GW activity months, and high presence of PRE conditions due to the STBA hypothesis. Then, de Paula et al. (2011) and Cueva et al. (2013), using numerical simulation and spread F echoes anal-ysis, suggest that large PRE and large GW activity seems to lead to plasma bubble development during summer solstice months. This fact is seems to be the reason in this event.
In Section 3.4 will be analyzed this event in more detail pur-suing the idea of periodic wave-like structure activity.
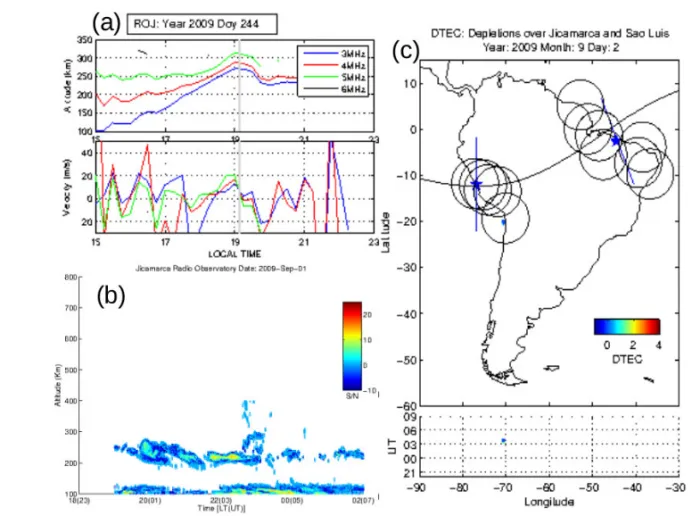
Case 3: September 01, 2009 (DoY 244)
In this case we have data just for westward of SA. In Figure 6 we can see the digisonde parameters showing a good prerever-sal enhancement, the altitude of the layer reached 300 km and the vertical velocity was around 20 m/s during the local sunset. This features are requirements for the development of spread F over the region, but instead we did not have depletions detected (panel
i i
“main” — 2018/8/9 — 15:32 — page 34 — #8
i i
34
LONGITUDINAL AND DAY-TO-DAY VARIATIONS OF EQUATORIAL SPREAD F OCCURRENCE FROM OBSERVATIONS OVER SOUTH AMERICAFigure 4 – Event on 11/03/2009. In panel (a), Jicamarca parameters (height and vertical velocity) and in panel (b), S˜ao Lu´ıs parameters (height and vertical velocity).
In panel (c), TEC depletion map with depletions over both eastern and western region, and below the time occurrence of depletions. Panels (d) and (e) show the RTI image for Jicamarca and S˜ao Lu´ıs, respectively.
(c)) neither vertical plume development in the RTI image (panel (b)). The PRE did not end in the development of plasma bubbles in the frequencies of the sounders. This could be happened prob-ably due to the fast decrease of the vertical drift velocity after this peak to 0 m/s and below –20 m/s, then in the RTI map we can observe just a bottom-type structure with no vertical development and lasting for hours along night. There is no S˜ao Lu´ıs
measure-ments for this event.
As explained by Hysell & Burcham (1998), a bottom-type layer that emerge and continue to reside in a westward-drifting stratum of the F region, never making the transition to a bottom-side layer and never producing topbottom-side irregularities, then the in-struments insensitive to the presence of bottom-type layers may report that no plasma instabilities occurred at all.
Figure 5 – Event on 11/19/2009. In panel (a), Jicamarca parameters (height and vertical velocity), and in panel (b), S˜ao Lu´ıs parameters (height and vertical velocity). In
panel (c), TEC depletion map with depletions over the eastern region, and below the time occurrence of depletions. Panels (d) and (e) show the RTI image for Jicamarca and S˜ao Lu´ıs, respectively.
Characteristics of PRE and TEC depletions
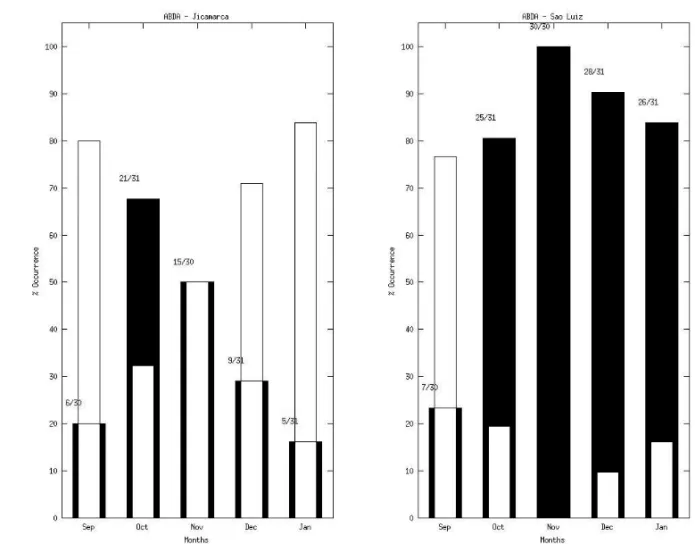
The seasonal variation of TEC depletions from September 2009 to January 2010 over Jicamarca (left panel) and S˜ao Lu´ıs (right panel) is presented in Figure 7, with black and white bars indicat-ing occurrence and non-occurrence of TECds detected with the ABDA algorithm, respectively. The number of days that had
pre-sented bubbles using the ABDA (as blue color over each black bar) is divided by the number of days available respectively for each month.
From Figure 7, it is clearly evident that high bubble oc-currence is detected by the ABDA in the September-November (November-December-January) period over the west/Jicamarca (east/S˜ao Lu´ıs) region of the continent. This figure indicates
i i
“main” — 2018/8/9 — 15:32 — page 36 — #10
i i
36
LONGITUDINAL AND DAY-TO-DAY VARIATIONS OF EQUATORIAL SPREAD F OCCURRENCE FROM OBSERVATIONS OVER SOUTH AMERICAFigure 6 – Event on 09/01/2009. In panel (a), Jicamarca parameters (height and vertical velocity), and in panel (b) RTI bottom-type structure from the Jicamarca
station. Panel (c) shows the TEC depletion map with no depletions over both regions.
that the TECds percentage of occurrence in the western re-gion/Jicamarca (left panel) during September is around 20%, and over 67% during October and November with 50% and during December and January with around 30 and 16% of occurrence, respectively. On the other hand, in the SA eastern region/S˜ao Lu´ıs (right panel) only September presents a low TECd percentage of occurrences, and from October to January there are more than 80% of occurrences. This means that over the eastern region the spread F occurrence was higher than the western region from October to January during this solar minimum period. Days with non-occurrence of the TECds for each station can be found in white bars.
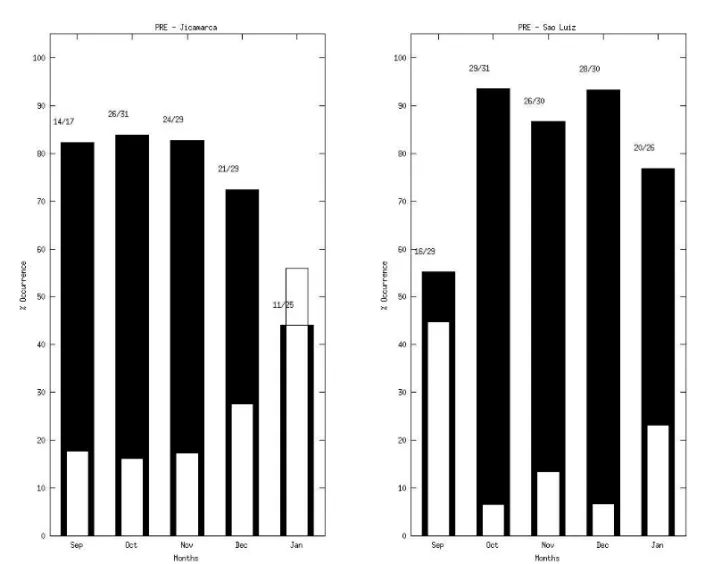
Figure 8 shows the plot for PRE similar to Figure 7. The PRE occurs frequently over Jicamarca (above 70%) during the low so-lar activity period studied, showing a slightly decreasing occur-rence from September to November and in January there is al-most 45% of occurrence, as presented in the left panel. In the right panel the PRE behavior over S˜ao Lu´ıs shows an increased occur-rence from equinox to summer solstice, that is, the occuroccur-rence increased from 50% in September to around 80% in November-January. Similar to the TEC depletion observations in Figure 7, there was a higher PRE occurrence in the eastern region than in
the western region. Is good to mention that the number of days available to calculate the PRE is different when comparing with previous figure, see blue text over the black bars which indicates the number of days with PRE divided by the number of days avail-able for the month.
These results are in agreement with Basu et al. (1980) for the Peruvian region, and de Paula et al. (2011) and Sobral et al. (2002) for the Brazilian region.
Quantitative analysis of how PRE is effective to generate spread F
When comparing the day-to-day occurrence of the PRE with TECd observations (ABDA) a high correlation is expected between them for confirming the efficiency of PRE as one of the precursor mech-anism for the formation of plasma bubbles. This could be right if PRE were the only mechanism acting in the equatorial plasma bubbles formation. However, as we know there are other factors acting as seed/precursor of plasma bubbles, like GW or LSWS (wave-like structures). In addition, there exist other factors that can inhibit the onset of spread F, such as a transequatorial merid-ional wind (Maruyama & Matuura, 1984).
Figure 7 – Percentage of TEC depletions occurrence detected with ABDA algorithm from September to December 2009 and January
2010. The black/white bars represent Bubbles/No Bubbles detected with the ABDA for Jicamarca (panel (a)) and S˜ao Lu´ıs (panel (b)).
In order to analyze quantitatively how efficient the PRE is as a spread F precursor mechanism, their occurrences need to be evaluated in the context of the TECd occurrence. Figure 9 presents of events with occurrence of PRE and TEC depletions from September 2009 to January 2010 for both equatorial stations.
As an attempt to answer the question about the effectiveness of PRE as an spread F precursor we compare PRE events against bubbles observations, so we decide to compare Figures 7 and 8 to analyze the occurrence of days with PRE and no PRE that had shown bubble formation. Is understood that PRE is the main pre-cursor of plasma bubbles formation, and when there is no PRE in the scenario sometimes we also observe bubble formation.
In the positive y-axis are represented as white bars the PRE events (same black bars in Fig. 8), in the negative y-axis are rep-resented as white bars the NO PRE events (same white bars from Fig. 8), then the total bar, means the sum of the positive and neg-ative bars, represent the total number of available days (see Ta-bles 2 and 3 for conference) for each month. The narrow black bars represent the number of days (in percentage) with PRE and TEC depletions observations (over zero y-axes), and days with NO PRE and TEC depletions (below the zero y-axes) observations.
Hereafter we will use P-TEC when PRE and TECd events are ob-served together (black bar overlapping white bar over the positive y-axis) and NP-TEC when NO PRE event and TECd events are ob-served together (black bar overlapping white bar over the negative y-axis). Also in the figure is presented the percentage of occur-rence of PRE/No PRE with TECd over each black bar (P-TEC and NP-TEC).
The high spread F occurrence period over the western region is predominantly during equinoxes, which is well observed in the analysis of results presented earlier (see left panel in Figs. 7 and 8) on TECd and PRE statistics, but the day-to-day comparison not always follows this observation (see Fig. 9). In the left panel of Figure 9, the occurrence of events over Jicamarca with P-TEC and NP-TEC are presented. Over the western region we can ob-serve that on September we have only 17 days with digisonde data and 14 of those days had PRE events, also we have 6 days with bubbles observed with bubbles detected (ABDA). These fac-tors determined that 14.3% of the PRE available events show also TEC depletions and from the 26 remaining days with no PRE no one presented TEC depletions in the TEC data neither in the RTI images, when available.
i i
“main” — 2018/8/9 — 15:32 — page 38 — #12
i i
38
LONGITUDINAL AND DAY-TO-DAY VARIATIONS OF EQUATORIAL SPREAD F OCCURRENCE FROM OBSERVATIONS OVER SOUTH AMERICAFigure 8 – Percentage of PRE occurrence from September to December 2009 and January 2010. The statistics were taken from digisonde
data. The black/white bars represent YES/NO PRE observation for each month.
In September the number of events with P-TEC is very low compared with the events that present PRE independently of TECd. The percentage of P-TEC is around 14.3% of the total PRE events for the September month either for Jicamarca or for S˜ao Lu´ıs (18.8%) equatorial station. On October and November months there are more than 60% of PRE events with TEC depletions, then December and January present decreasing percentage of P-TEC events, over Jicamarca station. The decrease in P-TEC events ob-served along months is related with the western irregularities be-havior of South American continent.
In this Peruvian sector, the percentages of NP-TEC are 0%, 60%, 40%, 25% and 14.3% from September to January, respec-tively. The high percentage of NP-TEC in October and November months means that another favoring/seeding spread F mechanism is acting instead of the PRE precursor. In January we can observe that there are almost same number of days with P-TEC and NP-TEC events. We can realize that NP-NP-TEC events are few and around 2-3 events per month.
In the right panel of Figure 9 the events of P-TEC are more over the eastern Brazilian region than over the Peruvian region.
Occurrences of P-TEC are 18.8%, 82.8%, 100% and 89.3% from September to December 2009, and 90% in January 2010. Oc-currences of NP-TEC are 15.4%, 50%, 100% and 100% from September to December 2009, and 83.3% in January 2010. The high spread F occurrence over the eastern region is during the November and December solstice, which is well represented in this plot (see P-TEC bars). From October-January almost all the events present P-TEC (more than 70%), with an increasing ten-dency from October to January. Moreover, occurrence of NP-TEC presents also a linear increasing tendency from September to January, and 100% of NP-TEC occurrence in November (4 days) and December (2 days).
The NP-TEC events point out that another seeding/precursor mechanism of plasma bubbles should be acting as mentioned be-fore, and following this reasoning it is important to look for an evidence of the mechanism in NP-TEC event. This is the subject for the next section.
Meanwhile, is good to mention that as well as NP-TEC and P-TEC we also have events for NP-NTEC, events for PRE and no data for determining the TEC depletions, TEC depletions data and
Figure 9 – Percentage of occurrence of PRE against TEC depletions (ABDA) from September to December 2009 and January 2010. The white
bars over/below the zero (see y-axes) represent YES/NO PRE observations for each month (same as in Figure 8) and the narrow black bars represent the percentage of PRE occurrence (over zero y-axes) or non PRE occurrence (below the zero y-axes) when TEC depletions are observed.
no data for PRE. This information represents the∼35% (∼35%) in September,∼2% (∼1%) in October, 0% (∼16%) November, ∼2% (∼22%) December and ∼20% (∼60%) January for S˜ao Lu´ıs (Jicamarca), respectively. This percentage of days are not included in Figure 9.
Evidence for Wave-like seeding
Here we support the conclusions of the previous section by showing two evidences, one for P-TEC and another for NP-TEC event. Here are presented two ways of observing wave-like seed-ing mechanisms usseed-ing two different techniques. The study of the NP-TEC event will be made with detrended TEC data from a few satellites over an equatorial station, and the study of the P-TEC event will be made using TECd and GW/TIDs maps (Valladares & Chau, 2012) of all South American continent, using data from all the GPS receivers available for this day.
From the database we selected the day 323, November 19, 2009 (same used in Fig. 5) with NP-TEC characteristics, since for the generation of irregularities a perturbation in the bottomside of the F layer is necessary. Figure 10 shows a wave-like structure
de-tected in the RTI map prior to onset of the plume structure (ESF). The panel (a) presents the detrended VTEC (vertical TEC) Devia-tion (TECu), in blue, for two satellites at each staDevia-tion (Imperatriz (IMPZ), Bel´em (BELE), S˜ao Lu´ıs (SALU) and Fortaleza (CEEU)) as a function of Universal Time for the same day, and the band-pass filtered oscillations in the TEC detrended values, the band-pass filtered oscillations include periods from 20 min to 40 min only, in red line. Sub-ionospheric pierce points were taken as 350 km and the observations were confined to the time interval 21.5 to 24.00 UT at all stations. The panel (b) shows two GPS satellites tracks over the field of view of four stations in the northeast of the Brazilian region, and the color-code represents the VTEC val-ues. The panel (c) shows the RTI map, with a bottom-type struc-ture from∼22 UT to 23.5 UT followed by a developed plume at 23.5 UT lasting for two hours. The satellites chosen for each sta-tion are PRN 4 and 15 for IMPZ, PRN 2 and 15 for BEL, PRN 4 and 2 for SALU and PRN 4 and 15 for CEEU. The pronounced TEC enhancement following the depleted region around 23.5 UT is re-lated with the onset of ESF, but is not observed at SALU PRN 2 and CEEU PRN 15.
i i
“main” — 2018/8/9 — 15:32 — page 40 — #14
i i
40
LONGITUDINAL AND DAY-TO-DAY VARIATIONS OF EQUATORIAL SPREAD F OCCURRENCE FROM OBSERVATIONS OVER SOUTH AMERICAFigure 10 – Wave-like structure detected during bottom-type layer on day 323, November 19, 2009. The panel (a) shows the detrended VTEC Deviation (TECu) stations
Fortaleza (CEEU), S˜ao Lu´ıs (SALU), Bel´em (BELE), and Imperatriz (IMPZ) as a function of Universal Time, as blue line. The red line represents the 20 min to 40 min filtered detrended TEC values. In the panel (b) there are few GPS satellites tracks over northeastern Brazilian region (see PRN numbers) with VTEC values, panel (c) shows the plume image for the same day at S˜ao Lu´ıs.
The remarkable feature of the plots is the presence of the periodic structure in the filtered detrended VTEC data prior to the onset of the developed plume (ESF). The possible precursor in this event occurred about 1.5 hours before the onset of ESF for PRN 4, 2, 4 and 4 at IMPZ, BELE, SALU and CEEU, respectively, and about 1 hour before for PRN 15, 15, 2 and 15 at IMPZ, BELE, SALU and CEEU, respectively. Moreover, oscillations with about 30 min period in each wave-like structure were observed (see periodic oscillation in red line). This oscillations have a north-eastward component observed in their track (panel b), and exist before the time of the plume. Is good to point out here that GW with small periods were found by Abdu et al. (2009b) and Fritts et al. (2008) over Brazilian region.
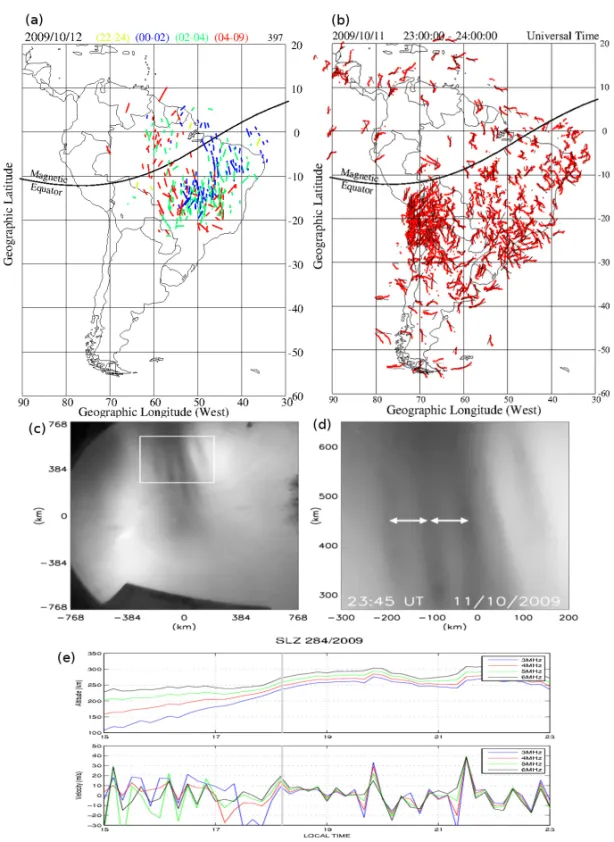
We also selected one P-TEC (eastern region) event on 11 Oc-tober, 2009. During this event the PRE was present around local sunset (as observed in Fig. 11, in the panel (e)) but no spread F was observed by the digisonde. Figure 11 shows Gravity Wave ev-idence in the GPS TEC data and in the OI 630 nm airglow image data. The panel (a) shows TEC depletions in the east of the con-tinent. TEC depletions are observed between 00:00 to 04:00 UT (see color code of the lines at the top). The panel (b) presents perturbations in the TEC detected in South America, and we can observe the perturbations in the west region and also in the north-east of Brazil. These TEC perturbations values, centered along the satellite track (thin black line), containing amplitudes higher than 0.4 TEC units and are plotted in red. The panel (b) presents
Figure 11 – Gravity Wave evidence over east region of South America. Day 11 of October, 2009 is a P-TEC event. The panel (a) shows TEC depletion map with
depletions in the east and west of the continent. The panel (b) presents TEC perturbations detected in SA. The middle panels present the GW signature in the all-sky imager of S˜ao Jo˜ao do Cariri, Para´ıba. The panel (c) shows the all-sky image of the depleted region, the panel (d) shows the expanded periodic structures, with arrows indicating each depletion. The panel (e) shows the altitude and vertical velocity parameters from the S˜ao Lu´ıs digisonde.
GW/TID signatures in the range of 23:00 to 24:00 UT on 11 Oc-tober, 2009, which is an evidence of ESF seeding that developed later as observed by the TEC depletion map.
None all the TIDs seed plasma bubbles. TEC perturbations observed at panel (b) in the eastern of SA traveled in the direction northeast from∼2100 UT to ∼2400 UT (plot not shown here) and could generate the conditions for bubble formation. Huang &
Kelley (1996) stated that the TIDs have to propagate eastward in order to initiate the Rayleigh-taylor instability in the bottomside F region. The TEC perturbations in the western region had traveled northward and does not have eastward component.
The panels (c) and (d) of Figure 11 show an OI630.0 nm image taken by the S˜ao Jo˜ao do Cariri (located at 7.4◦S, 36.5◦W, dip latitude 19◦S) imager at 23:45 UT, October 11, 2009. It shows
i i
“main” — 2018/8/9 — 15:32 — page 42 — #16
i i
42
LONGITUDINAL AND DAY-TO-DAY VARIATIONS OF EQUATORIAL SPREAD F OCCURRENCE FROM OBSERVATIONS OVER SOUTH AMERICAa geographic coordinated image with 1536 by 1536 km area. A white box on the top shows periodic structure within the plasma bubble. Here the depleted regions are represented by dark fin-gers partially elongated in the north-south direction. This box was zoomed and is shown in panel (d). Double arrows in panel (d) in-dicate the plasma bubble spacing of about 80 km. Since the bub-bles are confined to the northern sky of the Cariri observatory, they are still in a development phase. From the eastward drift of the bubbles, we estimated the drift velocity of∼160 m/s.
The panel (e) shows the altitude and vertical velocity param-eters from the S˜ao Lu´ıs digisonde, calculated from the frequen-cies of 3-4-5-6 MHz. At local sunset the vertical drift is around 20 m/s, later it became unstable and rapidly decayed to -20 m/s at 20:00 LT. After this time the vertical velocity turns positive after 21:00 LT, then reaches about 40 m/s at∼21:30 LT. In this event both seeding factors, PRE and GW/TIDs, are present and probably are contributing to the spread F development.
DISCUSSION AND CONCLUSIONS
In summary, TEC depletion events were mostly found on days when PRE is present which favors the bubbles generation dur-ing October equinox at Jicamarca and from October equinox and summer solstice at S˜ao Lu´ıs. Figure 9 shows that TECd appear to occur irrespective of PRE. The seasonal variations of the PRE and the TECd were presented in Figures 7 and 8, and they are in good agreement with their general observations for the western and eastern region in SA. During the period studied, there were a large number of events with P-TEC present in October at Jica-marca and October to January at S˜ao Lu´ıs. There were also many events with NP-TEC presence which mostly happening during October and November, and January at Jicamarca and from Oc-tober to January at S˜ao Lu´ıs. Due to the fact that during solar minimum conditions, the F layer is relatively at low-height, the upward propagating wave-like perturbations that can reach the lower part of the F layer can contribute to the RT instability and its cascading processes. These perturbations could be originated by Gravity Wave (GW) or they could be part of the Large-Scale Wave Structure (LSWS), either way serving as seeding/precursor mechanisms for equatorial spread F.
This paper also showed that the ABDA method when sup-ported/complemented with other observational techniques such as sounders (digisonde), optical imagers or VHF radars is a good technique to detect bubble signatures, principally when there is continental latitudinal and longitudinal coverage and can pro-vide a better knowledge of the local and regional ionospheric processes.
Events with NP-TEC characteristics prompt us to pursue the
idea of a periodic wave-like structures (as GW or LSWS) mecha-nism as seeding/precursor of equatorial spread F, as observed in Figures 4 and 5. This paper brings out two evidences of seeding by a wave-like structure on day 323, 2009 (November 19, Fig. 10) as a NP-TEC event. The seeding wave-like structure was found to have a period of∼30 minutes that is typical for gravity waves in each of the PRN detrended VTEC values, and it preceded the on-set of ESF by 1.5 hour/1 hour. Such timing since the wave-like structure is observed up to the developed plume will allow us to improve models of bubbles forecasting.
A P-TEC event was presented in the last section (see Fig. 11). This event after sunset was marked by a large downward increase in the vertical drift velocity (up to –20 m/s) which probably in-hibited the post sunset occurrence of an ESF event. From around ∼23:00 UT up to 00:00 UT there was evidence of GW as a pre-cursor for the TEC depletions that were detected around midnight and later. The presence of GW precursor was confirmed in the OI630 all-sky imager data as periodic plasma depletion structures at 23:45 UT, which later developed into plasma bubbles. In this event both PRE and GW are present and could be probably con-tributing to the spread F development.
Although the NP-TEC events are few each month, about 6 to 2 events per month, we are bringing up quantitatively that when the PRE is absent or even weak and depletions are well devel-oped we can attribute their formation to wave-like structures as gravity waves (as shows here in Figs. 10 and 11), or even other mechanisms.
ACKNOWLEDGEMENTS
Authors wish to acknowledge FAPESP under process 2008/ 00138-4 and 2012/25396-1 for supporting this research. Also we thanks to Jicamarca Radio Observatory team and INPE’s sci-entists and technicians for the digisonde/VHF radar data used in this report, specially A. Cunha Neto for great contribution to this report. Also we thank ISR-BC and the AFRL team for the sup-port and friendly partnership during this project. Also we appre-ciate help from Bob Sheehan. E.R. de Paula is grateful to AFOSR FA9550-10-1-0564 and CNPq 305684/2010-8 grants. One of the authors, Dr. Valladares, was partially supported by Air Force Re-search laboratory contract FA8718-09-C-0041 and NSF Grant ATM-0521487. Work done at Boston College was supported by the Air Force Office of Scientific Research. The Low Latitude Iono-spheric Sensor Network (LISN) is a project led by Boston Col-lege in collaboration with the Geophysical Institute of Peru, and other institutions that provide information for the benefit of the scientific community.
REFERENCES
ABDU MA. 2005. Equatorial ionosphere-thermosphere system: electro-dynamics and irregularities. Advances in Space Res., 35(5): 771–787, doi: 10.1016/j.asr.2005.03.150.
ABDU MA, BITTENCOURT JA & BATISTA IS. 1981. Magnetic declina-tion control of the equatorial F region dynamo electric field development and spread F. J. Geophys. Res., 86: 11443–11446.
ABDU MA, DE MEDEIROS RT & NAKAMURA Y. 1983a. Latitudinal and magnetic flux tube extension of the equatorial spread F irregularities. J. Geophys. Res., 88(A6): 4861–4868, doi: 10.1029/JA088iA06p04861. ABDU MA, DE MEDEIROS RT, SOBRAL JHA & BITTENCOURT JA. 1983b. Spread F plasma bubble vertical rise velocities determined from spaced ionosonde observations. J. Geophys. Res., 88(A11), doi: 10.1029/JA088iA11p09197.
ABDU MA, BATISTA IS & SOBRAL JHA. 1992. A new aspect of magnetic declination control of equatorial spread F and F region dynamo. J. Geo-phys. Res., 97(A10): 14,897–14,904, doi: 10.1029/92JA00826. ABDU MA, KHERANI EA, BATISTA IS & SOBRAL JHA. 2009a. Equato-rial evening prereversal vertical drift and spread F suppression by dis-turbance penetration electric fields. Geophys. Res. Lett., 36: L19103, doi: 10.1029/2009GL039919.
ABDU MA, KHERANI EA, BATISTA IS, DE PAULA ER, FRITTS DC & SOBRAL JHA. 2009b. Gravity Wave initiation of equatorial spread F/ plasma bubble irregularities based on observational data from Spread-FEx campaign. Ann. Geophys., 27: 2607–2622.
BASU S et al. 1996. Scintillation, plasma drift, and neutral winds in the equatorial ionosphere after sunset. J. Geophys. Res., 101(A12): 26,795– 26,809.
BASU S, BASU S, MULLEN JP & BUSHBY A. 1980. Long-term 1.5 GHz amplitude scintillation measurements at the magnetic equator. Geophys. Res. Lett., 7(4): 259–262, doi: 10.1029/GL007i004p00259.
BATISTA IS, ABDU MA & BITTENCOURT JA. 1986. Equatorial F re-gion vertical plasma drift: Seasonal and Longitudinal asymmetries in the American Sector. J. Geophys. Res., 91(A11): 12,055–12,064. BATISTA IS, ABDU MA & MEDRANO RA. 1990. Magnetic activity effects on range type spread-F and vertical plasma drift at Fortaleza and Huan-cayo as studied through ionosonde measurements and theoretical mod-eling. Annales Geophysicae, 8(5): 357–364.
BITTENCOURT J & ABDU MA. 1981. A theoretical comparison between apparent and real vertical ionization drift velocities in the equatorial F region. J. Geophys. Res., 86(A4), doi: 10.1029/JA086iA04p02451. BRUNINI CL, S´ANCHEZ L, DREWES H, COSTA S, MACKERN V, MART´INEZ W, SEEM ¨ULLER W & DA SILVA A. 2010. Improved analysis strategy and accessibility of the SIRGAS Reference Frame. Proceeding of
the 2009 IAG Symposium, Buenos Aires, Argentina. Geodesy for Planet Earth, pp3-10, doi: 10.1007/978-3-642-20338-1 1.
CHAPAGAIN NP, FEJER BG & CHAU JL. 2009. Climatology of postsun-set equatorial spread F over Jicamarca. J. Geophys. Res., 114: A07307, doi: 10.1029/2008JA013911.
CHEN WS et al. 2006. Digisonde spread F and GPS phase fluctuations in the equatorial ionosphere during solar maximum. J. Geophys. Res., 111: A12305, doi: 10.1029/2006JA011688.
CUEVA RYC, DE PAULA ER & KHERANI AE. 2013. Statistical analysis of radar observed F region irregularities from three longitudinal sectors. Ann. Geophys., 31: 2137–2146, doi: 10.5194/angeo-31-2137-2013. DE PAULA ER & HYSELL DL. 2004. The S˜ao Lu´ıs 30 MHz coherent scat-ter ionospheric radar: System description and initial results. Radio Sci., 39: RS1014, doi: 10.1029/2003RS002914.
DE PAULA ER, KHERANI EA, CUEVA RYC & CAMARGO LAP. 2011. Ob-servations of pre-midnight 5-m irregularities in the equatorial F region over S˜ao Lu´ıs, Brazil: Solar-flux dependence and seasonal variations. J. of Atmospheric and Solar-Terrestrial Physics, 73: 1544–1554. DOW JM, NEILAN RE & RIZOS C. 2009. The international GNSS Service in a changing landscape of Global Navigation Satellite Systems. Journal of Geodesy, 83: 191-198, doi: 10.1007/s00191-008-0300-3.
FARLEY DT, BALSLEY BB & WOODMAN RF. 1970. Equatorial spread F – Implications VHF radar observations. J. Geophys. Res., 75(34): 7199– 7216.
FARLEY DT, BONELLI E, FEJER BG & LARSEN MF. 1986. The Prere-versal Enhancement of the Zonal Electric Field in the Equatorial Iono-sphere. J. Geophys. Res., 91(A12): 13,723–13,728, doi: 10.1029/ JA091iA12p13723.
FEJER BG. 1997. The electrodynamics of the low latitude ionosphere: Recent results and future challenges. J. Atmos. Sol. Terr. Phys., 59: 1456–1482.
FEJER BG, SCHERLIESS L & DE PAULA ER. 1999. Effects of the ver-tical plasma drift velocity on the generation and evolution of equatorial spread F. J. Geophys. Res., 104(A9): 19,859–19,869.
FRITTS DC, VADAS SL, RIGGIN DM, ABDU MA, BATISTA IS, TAKAHASHI H, MEDEIROS A, KAMALABADI F, LIU H-L, FEJER BG & TAYLOR MJ. 2008. Gravity wave and tidal influences on equatorial spread F based on observations during the Spread F Experiment (SpreadFEx). Ann. Geo-phys., 26: 3235–3252.
HAERENDEL G, ECCLES JV & C¸AKIR S. 1992. Theory for model-ing the Equatorial Evenmodel-ing Ionosphere and the Origin of the Shear in the Horizontal Plasma Flow. J. Geophys. Res., 97(A2): 1209–1223, doi: 10.1029/91JA02226.
HUANG C-S & KELLEY MC. 1996. Nonlinear evolution of equatorial spread F: 4. Gravity waves, velocity shear, and day-to-day variability. J. Geophys. Res., 101(A11): 24,521–24,532, doi: 10.1029/96JA02332.
i i
“main” — 2018/8/9 — 15:32 — page 44 — #18
i i
44
LONGITUDINAL AND DAY-TO-DAY VARIATIONS OF EQUATORIAL SPREAD F OCCURRENCE FROM OBSERVATIONS OVER SOUTH AMERICA HYSELL DL & BURCHAM JP. 1998. JULIA radar studies of equatorialspread F. J. Geophys. Res., 103(A12): 29,155–29,167.
HYSELL DL et al. 1990. Seeding and layering of equatorial spread F by gravity waves. J. Geophys. Res., 95: 17253–17260.
KELLEY MC, LARSEN MF & LAHOZ C. 1981. Gravity Wave initiation of equatorial spread F: A case study. J. Geophys. Res., 86: 9087–9100, doi: 10.1029/JA086iA11p9087.
KESKINEN et al. 2009. Three-dimensional nonlinear evolution of equato-rial ionospheric bubbles with gravity waves seeding and tidal wind effects. Geophys. Res. Lett., 36: L12102, doi: 10.1029/2009GL037892. KHERANI EA et al. 2009. The impact of gravity waves rising from convec-tion in the lower atmosphere on the generaconvec-tion and nonlinear evoluconvec-tion of equatorial bubble. Ann. Geophys., 27: 1657–1668.
MARUYAMA T & MATUURA N. 1984. Longitudinal variability of annual changes in activity of equatorial spread F and plasma bubbles. J. Geo-phys. Res., 89: 10903.
MARUYAMA T et al. 2007. Low latitude ionosphere-thermosphere dy-namics studies with ionosonde chain in Southeast Asia. Annales Geo-physicae, 25: 1569–1577.
MARUYAMA T et al. 2009. Equinoctial asymmetry of a low-latitude ionosphere-thermosphere system and equatorial irregularities: evidence for meridional wind control. Annales Geophysicae, 27: 2027–2034. MUELLA MTAH et al. 2008. GPS L-band scintillations and iono-spheric irregularity zonal drifts inferred at equatorial and low-latitude regions. J. Atmos. Sol. Terr. Phys., 70: 1261–1272, doi: 10.1016/ j.jastp.2008.03.013.
MUELLA MTAH et al. 2009. Occurrence and zonal drifts of small-scale ionospheric irregularities over an equatorial station during solar max-imum – Magnetic quiet and disturbed conditions. Advances in Space Res., 43: 1957–1973, doi: 10.1016/j.asr.2009.03.017.
NARAYANAN VL et al. 2012. On the importance of wave-like structures in the occurrence of equatorial plasma bubbles: A case study. J. Geophys. Res., 117: A01306, doi: 10.1029/2011JA017054.
NOGUEIRA PAB, ABDU MA, BATISTA IS & DE SIQUEIRA PM. 2011. Equatorial ionization anomaly and thermospheric meridional winds dur-ing two major storms over Brazilian low latitudes. J. Atmos. Sol. Terr. Phys., 73: 1535–1543, doi: 10.1016/j.jastp.2011.02.008.
SAITO S & MARUYAMA T. 2007. Large-scale longitudinal varia-tion in ionospheric height and equatorial spread F occurrences ob-served by ionosondes. Geophys. Res. Lett., 34: L16109, doi: 10.1029/ 2007GL030618.
SEEMALA GK & VALLADARES CE. 2011. Statistics of TEC depletions observed over the South American continent for the year 2008. Radio Science, 46: RS5019, doi: 10.1029/2011RS004722.
SOBRAL JHA, ABDU MA, TAKAHASHI H, TAYLOR MJ, DE PAULA ER, ZAMLUTTI CJ, DE AQUINO MG & BORBA GL. 2002. Ionospheric plasma bubble climatology over Brazil based on 22 years (1977-1998) of 630nm airglow observations. J. Atmos. Solar-Terr. Phys., 64(12-14): 1517–1524.
TAKAHASHI H, ABDU MA, TAYLOR MJ, PAUTET P-D, DE PAULA E, KHERANI EA, MEDEIROS AF, WRASSE CM, BATISTA IS, SOBRAL JHA, GOBBI D, ARRUDA D, PAULINO I, VADAS S & FRITTS D. 2010. Equatorial ionosphere bottom-type spread F observed by OI 630.0 nm airglow imaging. Geophys. Res. Lett., 37: L03102, doi: 10.1029/2009GL041802.
THAMPI SV et al. 2009. First observations of large-scale wave struc-ture and equatorial spread F using CERTO radio beacon on the C/NOFS satellite. Geophys. Res. Lett., 36: L18111, doi: 10.1029/2009GL039887. TSUNODA RT. 2008. Satellite traces: An ionogram signature for large-scale wave structure and a precursor for equatorial spread F. Geophys. Res. Lett., 35: L20110, doi: 10.1029/2008GL035706.
TSUNODA RT. 2010a. On seeding equatorial spread F: Circular gravity waves. Geophys. Res. Lett., 37: L10104, doi: 10.1029/2010GL043422. TSUNODA RT. 2010b. On seeding equatorial spread F during solstices. Geophys. Res. Lett., 37: L05102, doi: 10.1029/2010GL042576. TSUNODA RT, BUBENIK DM, THAMPI SV & YAMAMOTO M. 2010. On large-scale wave structure and equatorial spread F without a post-sunset rise of the F layer. Geophys. Res. Lett., 37: L07105, doi: 10.1029/ 2009GL042357.
TSUNODA RT et al. 2011. On seeding, large-scale wave structure, equa-torial spread F, and scintillations over Vietnam. Geophys. Res. Lett., 38: L20102, doi: 10.1029/2011GL049173.
VALLADARES CE & CHAU JL. 2012. The Low-latitude Ionosphere Sensor Network (LISN): Initial results. Radio Sci., 47: RS0L17, doi: 10.1029/2011RS004978.
VALLADARES CE, VILLALOBOS J, SHEEHAN R & HAGAN MP. 2004. Latitudinal extension of low-latitude scintillations measured with a net-work of GPS receivers. Ann. Geophys., 22: 3155–3175.
WEBER EJ et al. 1996. Equatorial plasma depletion precursor signa-tures and onset observed at 11◦south of the magnetic equator. J. Geo-phys. Res., 101(A12): 26,829–26,838.
Recebido em 8 fevereiro, 2017 / Aceito em 25 agosto, 2017 Received on February 8, 2017 / Accepted on August 25, 2017