Escola de Ciências da Saúde
Vítor Emanuel Coutinho Teixeira
Thymic Activity and Regulatory CD4
+T
cells in the Immune Reconstitution of
HIV infected Individuals: Two
(In)Dependent Factors?
Atividade Tímica e Linfócitos T CD4
+Reguladores na Reconstituição Imune
de Indivíduos Infetados com VIH: Dois
Fatores (In)Dependentes?
Dissertação de Mestrado
Mestrado em Ciências da Saúde
Trabalho efectuado sob a orientação da
Professora Doutora Maria Margarida Teles
Vasconcelos Correia Neves
e co-orientação da
Doutora Cláudia Rubina Freitas Pereira de
Nóbrega
ii
Declaração
Nome: Vítor Emanuel Coutinho Teixeira
Endereço electrónico: [email protected] Número do Bilhete de Identidade: 13299539
Título da dissertação:
Thymic Activity and Regulatory CD4+ T cells in the Immune Reconstitution of HIV infected
Individuals: Two (In)Dependent Factors?
Atividade Tímica e Linfócitos T CD4+ Reguladores na Reconstituição Imune de Indivíduos
Infetados com VIH: Dois Fatores (In)Dependentes? Orientador:
Professora Doutora Maria Margarida Teles Vasconcelos Correia-Neves Co-Orientadora:
Doutora Cláudia Rubina Freitas Pereira de Nóbrega Ano de conclusão: 2012
Designação do Ramo de Conhecimento do Mestrado: Ciências da Saúde
DE ACORDO COM A LEGISLAÇÃO EM VIGOR, NÃO É PERMITIDA A REPRODUÇÃO DE QUALQUER PARTE DESTA TESE/TRABALHO
Universidade do Minho, 30 de Outubro de 2012
iii
The work presented in this thesis was done in the Laboratory of Immunology of Infection, Microbiology and Infection Research Domain of the Life and Health Sciences Research Institute (ICVS), School of Health Sciences, University of Minho, Braga, Portugal (ICVS/3B’s – PT Government Associate Laboratory, Braga/Guimarães, Portugal) in collaboration with the Hospital Joaquim Urbano, Porto, Portugal. The financial support to perform this project was conceded by the Fundação para a Ciência e a Tecnologia (PIC/IC/83313/2007).
v
vii
Acknowledgments
Esta tese representa o culminar de intensas e morosas horas de trabalho. Foi um desafio a que me propus, não só por ser uma ambição profissional, mas, sobretudo pessoal, de um objetivo de há vários anos que finalmente se cumpre, pelo que o contentemento é inmensurável!
E como “Um caminho nunca é longo demais quando um amigo nos acompanha”, ao longo desta caminhada, pude contar com o apoio de imensas pessoas, às quais devo prestar o devido tributo. Obrigado...
À Margarida, a chefe, que quando vê uns olhos a espreitar pela frincha da porta do gabinete sabe que é o Bitinha (O Ventilado)! Obrigado pelo apoio desde o primeiro momento, pela oportunidade de trabalhar neste projeto, pelo magnífico grupo de trabalho MCN, pelo exemplo de dinâmica, boa disposição e estímulo constante. Aproveito também para agradecer por muitas vezes ter “puxado” por mim e me ter posto à prova, e de que devemos encarar os desafios com um sorriso e boa disposição... ok, eu faço isso, mas ventilo um pouco (bastante) pelo meio! À Cláudia Nóbrega, a co-chefinha! Obrigado pelo apoio, pelo espírito crítico, por me teres “dado na cabeça” algumas vezes, pelo que me ensinaste e pela vontade de me ajudar sempre que precisei!
Ao Pedro, que com o seu espírito extrovertido lá nos fazia dar umas gargalhadas no lab e que, quando se chama por ele, diz “não está”! Passamos momentos de boa disposição é certo, mas agradeço-te também pelos conhecimentos que me transmitiste, pela ajuda e pelas conversas sobre HIV que fomos tendo ao longo deste percurso.
À Doutora Ana Horta, obrigado pela sua simpatia, pela ajuda me que deu em vários momentos e por partilhar comigo o seu conhecimento sobre a temática do HIV.
À Susana Roque, a tua boa disposição e espontaneidade ao te exprimires faz-nos rir a todos! E estes momentos são preciosos! Obrigado pelas críticas construtivas e pela enorme ajuda em vários momentos.
À Palmira, ao Bruno, à Daniela e à Alice pelo companherismo, pelas boas conversas e boa disposição.
viii
Ao Professor Patrício Costa, pelas dicas e conselhos na parte do tratamento estatístico dos dados. O meu sincero obrigado.
Obrigado a todos os MIRD pelo bom espírito que se vive no lab.
E também...
Aos meus “papás”! Obrigado pelo exemplo e educação e pela força inexcedível com que sempre me apoiaram. Obrigado também por confiarem sempre em mim, e por me terem deixado trilhar um caminho decidido pela minha própria cabeça.
À mana Matilde, que só se “lembrou” de aparecer quase 23 anos depois de eu cá ter chegado! Vale tanto a pena chegar a casa no final da semana, ser recebido pelo teu sorriso de malandra e te ver crescer a olhos vistos! Foste um novo estímulo para mim em vários momentos e serás sempre a menina dos meus olhos!
Aos meus avós e ao meu Tio Joaquim e Tia Andreia pela força que me foram dando durante este trajeto.
À Ana, foram tantas as vezes que trocamos palavras de apoio, de incentivo, de receio e de entuasiasmo! É bom saber que tenho alguém que gosta realmente de mim, que será sempre o meu porto de abrigo e de quem eu também gosto M&M!
Ao Zé, lembras-te do “driblar as dificuldades”, “saltar os obstáculos” e “terminar com um winner”? Pois é disto que nos devemos sempre lembrar! Obrigado por todos os momentos desta amizade de 10 anos.
Aos meus amigos do Porto, Rául, Diana, Rosalina, Rita, Telmo e Catarina. Mas que bons momentos passamos nós em conjunto! Espero que haja muitas mais páginas em branco de bons momentos para preenchermos.
Ao António, à Patrícia e ao Miguel, pela boa amizade que partilhamos e por terem tornado a adaptação a Braga muito mais fácil! Obrigado pelo vosso apoio e pelos bons momentos que passamos!
ix
Abstract
The Human Immunodeficiency Virus (HIV) infection is a major health problem worldwide estimated to affect about 34 million people. The hallmark of HIV pathogenesis is the gradual loss of the CD4+ T cell compartment along with a chronic state of immune hyperactivation. As
infection progresses, HIV weakens the immune system to a level of profound immune dysfunction, which leads to the onset of Acquired Immunodeficiency Syndrome (AIDS)-related and non-related illnesses and ultimately to death if not treated.
The introduction of Highly Active Antiretroviral Therapy (HAART) was an event of paramount importance for the treatment of AIDS. HAART allows, for the great majority of individuals, a substantial recovery of peripheral CD4+ T cell counts. As a result, morbidity and
mortality among HIV infected patients has diminished enormously. However, a certain proportion of HIV infected individuals receiving HAART present poor immunological reconstitution even having undetectable viral load. These individuals are mentioned to as immunological non-responders (InR) and, unlike full immunological-non-responders (IR), present increased risk of death.
Several mechanisms have been proposed to explain immune reconstitution failure in HIV infected individuals. We have previously shown that a high proportion of regulatory T cells (Tregs) is associated with poor immune reconstitution. Here we further explored this observation and investigated if thymic activity, known to influence immune reconstitution, is also associated with poor immune reconstitution. Moreover, we analysed the interplay between thymic activity and Tregs and how is the relationship between them correlated with immune reconstitution.
To analyse cells that have been recently exported by the thymus we defined a new gating strategy based on the CD31 expression by other cell types, namely granulocytes. Our results suggest that this strategy render the analysis of recent thymic emigrants (RTEs) more independent of the number and characteristics of CD4+ T cells. As expected, we observed that
incomplete immune reconstitution is associated with lower thymic output in HIV infected individuals on HAART for at least one year. This is also the case for individuals with high percentages of Tregs. Interestingly, high percentages of Tregs are associated with low numbers of RTEs. Furthermore, increased counts of Tregs seem to result from an accumulation of CD45RA-CD4+ Tregs counts in the periphery and not from recently produced Tregs from the
thymus. Dividing the cohort in three groups depending on the duration of the treatment and quality of the immune reconstitution, we observed that the IR show increased numbers of RTE as
x
compared with InR. Finally, Tregs seem to impact reconstitution during the first five years of treatment, specifically in individuals with higher percentages of Tregs.
Altogether, this work sheds light of new evidences of an interplay between thymic activity and Tregs, which could have major implications in the outcome of the immune reconstitution in HIV infected individuals.
Key words: HIV, HAART, Immune Reconstitution, Thymus, Recent Thymic Emigrants (RTEs), regulatory T cells (Tregs)
xi
Resumo
A infeção pelo Vírus da Imunodeficiência Humana (VIH) é um problema de saúde pública relevante, sendo estimado que 34 milhões de pessoas estejam infetadas a nível mundial. A patogénese do VIH é caracterizada pela redução progressiva no número de linfócitos T CD4+ em
concomitância com um estado excessivo de ativação imune. Durante a progressão da doença, o VIH enfraquece e induz a disfunção do sistema imunitário em indivíduos infetados, o que leva ao aparecimento de doenças características da Síndrome da Imunodeficiência Adquirida (SIDA) e à morte, se não tratados.
A introdução da Terapia Anti-Retroviral Altamente Ativa (TARV) foi um enorme progresso para o tratamento da SIDA. A TARV permitiu para a grande maioria dos indivíduos, uma recuperação substancial no número periférico de linfócitos T CD4+, o que resultou num
descréscimo acentuado da mortalidade e morbidade entre indivíduos infetados com VIH. Contudo, alguns indivíduos infetados e em tratemento apresentam fraca reconstituição imunitária, mesmo com uma carga viral em níveis indetetáveis. Estes indivíduos, contrariamente aos com reconstituição imunitária adequada, apresentam um maior risco de morte.
Vários fatores têm sido apontados como possíveis causas da fraca reconstituição imunitária em indivíduos infetados com VIH. Recentemente, o nosso laboratório verificou que elevadas percentagens de linfócitos T CD4+ reguladores (Tregs) estão associados à fraca
reconstituição. No presente estudo pretendemos não só confirmar esta observação prévia, como também explorar em que medida a atividade tímica está associada à reconstituição imunitária nos indivíduos com VIH. Adicionalmente, pretendemos também compreender como a atividade tímica e as Tregs se relacionam entre elas e influenciam conjuntamente a reconstituição.
As células recentemente exportadas pelo timo (RTEs) expressam à sua superfície elevados níveis de CD31. Para estudar esta população definimos uma nova estratégia de análise em citometria de fluxo, com base na expressão de CD31 em granulócitos. Os nossos resultados sugerem que esta estratégia torna a análise de RTEs mais independente do número e características específicas dos linfócitos T CD4+. Como previsto, uma fraca reconstitutição está
associada à baixa atividade tímica em indivíduos infetados com VIH com, pelo menos, um ano de terapia. Esta associação é também evidente em indivíduos com elevadas percentagens de Tregs. É interessante constatar ainda que elevadas percentagens de Tregs estão associadas a um baixo número de RTEs. Adicionalmente, verificamos que o aumento no número de Tregs
xii
parece estar relacionado com uma acumulação no número de Tregs CD45RA-CD4+ na periferia,
e não com o aumento de Tregs exportadas pelo timo. Após dividirmos o nosso coorte em três grupos, com base na duração do tratamento e na qualidade da reconstituição, observamos que os indivíduos com reconstituição imunitária adequada apresentam um número de RTEs aumentado, comparativamente com indivíduos com fraca reconstituição imunitária. Finalmente, as Tregs parecem influenciar a reconstituição durante os primeiros cinco anos do tratamento, nomeadamente em individuos com elevadas percentagens de Tregs.
Em conclusão, este estudo sugere novas evidências para uma interação entre a atividade tímica e as Tregs, o que pode ter implicações relevantes no decorrer do processo de reconstituição imunitário em indivíduos infetados com VIH.
Palavras-chave: VIH, TARV, Reconstituição Imune, Timo, Células Recentemente Exportadas pelo Timo (RTEs), linfócitos T CD4+ reguladores (Tregs)
xiii
Table of Contents
1. Introduction ... 1
1.1. The Human Immunodeficiency Virus (HIV) ... 1
1.1.1. A Brief Overview: HIV Structure, Life Cycle and Prevalence of Infection ... 1
1.1.2. From HIV Pathogenesis to AIDS: How the Immune System Gets Sick ... 3
1.1.3. Highly Active Antiretroviral Therapy (HAART): A Giant Leap for AIDS Treatment ... 5
1.1.4. Immune Reconstitution under HAART ... 6
1.2. The Thymus ... 8
1.2.1. A Brief Overview: Structure and Function ... 8
1.2.2. Age-Dependent Thymic Involution ... 8
1.2.3. Major Techniques to Assess Thymic Activity in Humans ... 9
1.3. Thymic Function in the Context of HIV Infection... 12
1.3.1. Effects of HIV on Thymic Structure and Activity ... 12
1.3.2. Immune Reconstitution under HAART: is the Thymus Part of the Business?... 13
1.4. Tregs in the Context of HIV Infection ... 14
1.4.1. Tregs in the Immune System: What’s their Purpose? ... 14
1.4.2. Regulatory T cells in Immune Reconstitution under HAART: Friends or Foes? ... 15
2. Aims ... 17
3. Material and Methods ... 19
3.1. Study Participants ... 19
3.2. Flow Cytometry Analysis ... 19
3.2.1. RTEs Characterization ... 19
3.2.2. Tregs Characterization ... 19
3.2.3. Flow Cytometry Data Analysis ... 20
3.3. Statistical Analysis ... 20
xiv
4.1. A Novel Gating Strategy to Define Recent Thymic Emigrants (RTEs) ... 21
4.2. Thymic Activity and Immune Reconstitution ... 25
4.3. Tregs Percentages and Immune Reconstitution ... 26
4.4. Thymic Activity and Tregs Percentages During Immune Reconstitution ... 30
4.5. Thymic Export and Peripheral Tregs ... 32
4.6. Thymic Activity and Tregs in Different Immune Reconstitution Groups ... 33
5. Discussion and Conclusions ... 39
5.1. A New Gating Strategy to Define RTEs ... 39
5.2. Immune reconstitution and Tregs – The Definition of Clusters ... 40
5.3. Thymic Activity and Immune Reconstitution ... 40
5.4. Tregs and Thymic Activity – Two (In)Dependent Factors Influencing Immune Reconstitution?... 41
5.5. Tregs and Thymic Activity in the Reconstitution Groups ... 42
xv
Abbreviations List
AIDS Acquired Immunodeficiency Syndrome CT Computer Tomography
FOXP3 Forkhead-Box Transcription Pactor P3 GALT Gut-associated Lymphoid Tissues HAART Highly Active Antiretroviral Therapy HIV Human Immunodeficiency Virus IL Interleukine
InR Immunological non-Responders IR Immunological Responders iTregs Induced Regulatory T Cells MHC Major Histocompatibility Complex nTregs Naturally occurring Regulatory T Cells PBMCs Peripheral Blood Mononuclear Cells RTES Recent thymic Emigrants
TCR T Cell Receptors
TRECs T Cell Receptor Excision Circles Tregs Regulatory T cells
UNAIDS Joint United Nations Programme on HIV/AIDS WHO World Health Organization
1
1. Introduction
1.1. The Human Immunodeficiency Virus (HIV)
1.1.1. A Brief Overview: HIV Structure, Life Cycle and Prevalence of Infection
The Human Immunodeficiency Virus (HIV) belongs to the Lentivirus genus of the Retroviridae family [1]. HIV was defined in 1983 as the etiological causative agent of the Acquired Immunodeficiency Syndrome (AIDS) disease and is classified into two major types: HIV-1 and HIV-2. HIV-1 is widely disseminated and accounts for the majority of infections worldwide (99%), being more virulent than HIV-2 whose disease progression occurs at a slower rate [1-3]. HIV-2 is more restricted to some areas in West Africa and some countries in Europe, with major incidence in Portugal, but its prevalence has been falling, maybe due to lower transmission efficiency [3].
The HIV virion structurally comprises two identical single-stranded RNA molecules and the
affiliated enzymes reverse transcriptase, integrase and protease, enclosed within a proteic nucleocapsid (consisting of an inner-core capsid (p24) and an outer-core matrix (p17) proteic
layers) (Figure 1). Surrounding these structural elements is a roughly spherical outer phospholipid bilayer membrane envelope, derived from the host cell membrane after budding and release of the virion from an infected cell. Additionally, the viral envelope includes the transmembrane env complex which consists of a trimeric structure of three gp120/gp41 pairs of glycoproteins. This complex is the mediator of HIV cell entry by binding to CD4 molecule on target cells, with concomitant binding to the main chemokine co-receptors for HIV, CCR5 and CXCR4 [1, 4].
2 All HIV strains have the ability to infect CD4+ T cells, the major viral-receptor, but the
ability of some strains to infect other cells relies on the specificity of gp120 variants to attach different chemokine receptors, which in turn determines the tropism of HIV strains as R5 (CCR5), X4 (CXCR4) or even R5/X4 tropic-viruses, for the virus that use one or both chemokine receptors [1, 6]. The major targets of HIV are CD4+ T cells, yet among other cells infected are
macrophages, monocytes and dendritic cells.
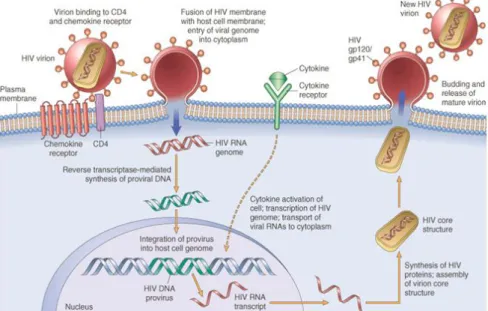
Once the virion fuses with host cell membrane, HIV RNA genome is released and reverse transcribed into double-stranded DNA by the enzyme reverse transcriptase (Figure 2). Then, both viral DNA and integrase enzyme enter the nucleus which leads to the integration of HIV DNA (provirus) into the cell host genome. The provirus can remain transcriptionally inactive during months or even years, establishing a latent infection [1].
Figure 2. HIV life cycle. Simplified view of the sequential steps of HIV life cycle, since HIV virion entrance into the host cell, until the release of a new virion. Extracted from the website [5].
When the infected cell is activated by an intrinsic (e.g. cytokines) or extrinsic (e.g. foreign antigen) stimuli, HIV gene transcription can be triggered leading to the production of HIV RNA transcripts. Thereafter, due to sequential and differential splicing events, first transcripts of regulatory genes and, afterwards, of structural genes are exported from the nucleus to the cytoplasm, translated into proteins and processed by the HIV protease. Finally, the assembly of new virions starts by packaging the HIV RNA transcripts and associated proteins within the nucleocapsid core, followed by the release of mature virions from the host cell by budding [1].
3 The most frequent route of HIV transmission is through sexual contact and occurs either between heterosexual couples or between male homosexual partners. Less frequent routes are vertical transmission from mother-to-child in utero, during childbirth or through breast-feeding; transmission among injection drug users that share needles; and contact/exposure to blood or blood products of HIV seropositive individuals during transfusions [1, 7].
At the end of 2010, the World Health Organization (WHO) and the Joint United Nations Programme on HIV/AIDS (UNAIDS) estimated that there were 34 million people living with HIV worldwide (Figure 3) [8]. The infection continuous to be highly prevalent in the Sub-Saharan Africa with an alarming estimation of 23 million people infected (2/3 of global infections). This numbers renders HIV one of the major epidemic diseases worldwide and case of serious health concern. Although the number of people living with HIV is steadily increasing, the number of new HIV infections is decreasing [8]. The explanation relies on population awareness on HIV transmission and on the currently available antiretroviral drugs that increase life-expectancy of infected individuals (see section 1.1.3).
In Portugal, at the end of 2011, the number of individuals reported to live with HIV/AIDS was 41 035, from which 80,9% were male and 19,1% female [9].
Figure 3. Estimated numbers of adults and children (all ages combined) infected and living with HIV in 2010. Figure extracted from the WHO Global Report 2011.
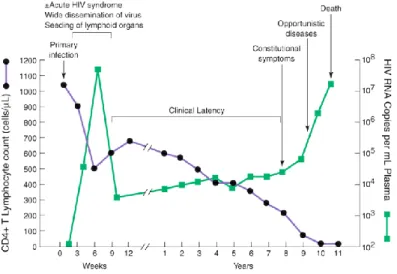
1.1.2. From HIV Pathogenesis to AIDS: How the Immune System Gets Sick HIV pathogenesis is characterized by the gradual loss of the CD4+ T cell compartment
(Figure 3) and by the chronic state of immune hyperactivation. By the time HIV establishes a productive cell infection (primary infection), the pathogenic progression of the disease begins with an acute infection phase characterized by high levels of viral replication, and a massive depletion
4 of CD4+ T cells, particularly in the gut-associated lymphoid tissues (GALT), where the majority of
cells are memory activated CD4+CCR5+ T cells. While viral dissemination continues, allowing the
seeding of other lymphoid tissues, especially the lymph nodes, both a humoral and cell-mediated immune responses retaliate against HIV [1, 2, 7, 10].
Figure 4. Typical course of HIV disease progression in an untreated HIV infected individual. Extracted from [11].
Despite partial control and drop of plasma viremia 12 weeks after infection, the immune system fails to eliminate the resilient virus. HIV establishes persistent viral reservoirs in lymphoid tissues and in latently infected resting CD4+ T cells, leading to the chronic phase of the disease.
This period can go on for several years, depending on the rate of disease progression, and is characterized by clinical latency of the disease. Regardless of some initial regenerative capacity, with rise in number of peripheral CD4+ T cells, ongoing viral replication, cell infection and death,
and chronic immune activation, lead to progressive immune deficiencies [1, 2, 7, 10].
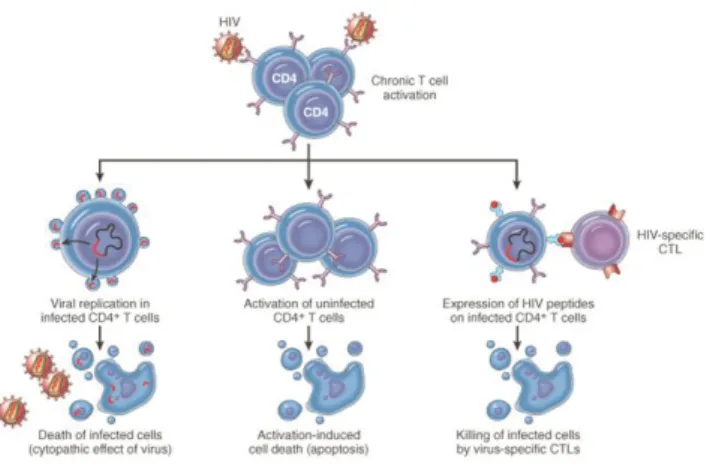
HIV-induced cell death of CD4+ T cells may be due to direct cythopathic effects of viral
replication in infected cells or to immune surveillance of HIV-specific CD8+ cytotoxic T cells that
kill infected cells (Figure 5), although natural killer (NK) cells can also exert some function [1, 2, 10]. Furthermore, progression of the disease in the chronic phase is also marked by high levels of cell immune activation, proliferation, and production of inflammatory cytokines. This, detrimentally leads also to bystander effects of HIV by indirect instigation of activation-induced cell death (apoptosis) in uninfected cells [2, 7, 10], as it was described for naïve T cell death in lymphoid tissues [10].
5
Figure 5. Schematic representation of different mechanisms involved in T cell death and turnover during HIV pathogenesis. Extracted from the website [5].
HIV preferentially infects CD4+ T cells which are key players in the adaptive immune
system [10]. By destroying these cells during the course of infection, HIV weakens the immune system to a level of profound injury and immune dysfunction and exhaustion, rendering the onset of clinical AIDS when CD4+ T cells fall below 200 cells/μL. As the CD4+ T cell compartment gets
compromised, eradication of opportunistic infections, and of a wide spectrum of characteristic diseases, is hampered [2]. However deleterious effects and immune dysfunction are extended to CD8+ T cells, NK cells, and B cells by mechanisms that induce nonspecific cell activation,
turnover and differentiation. Nonlymphoid cells like macrophages and dendritic cells are also functionally impaired in their capacity to phagocytise and present antigens due to indiscriminate activation [2, 7, 10]. In addition, HIV seems to be responsible for the loss of mucosal integrity and concomitant microbial translocation, which contribute to immune activation [7], to reduced export of progenitor cells from the bone marrow [12] and for structural and functional alterations both in the thymus [13, 14] and in the lymph nodes [15].
Altogether, these quantitative and qualitative alterations and the loss of homeostasis, since the beginning of the infection and throughout the course of pathogenesis, inevitably culminate in the functional disability and “immune incompetence” of the immune system.
1.1.3. Highly Active Antiretroviral Therapy (HAART): A Giant Leap for AIDS Treatment
The introduction of Highly Active Antiretroviral Therapy (HAART) was an event of paramount importance for the treatment of AIDS and of the pathogenic progression of HIV.
HAART regimens are usually a combination of drugs that, on one hand, inhibit viral replication by targeting viral proteins such as reverse transcriptase, protease and integrase and,
6 on the other hand blocks host’s membrane protein CCR5, impeding virus entrance into CD4+ T
cells [16, 17]. By reducing plasma HIV-RNA viral copies to amounts below the detection levels, HAART also allows, for the majority of treated individuals, a substantial recovery of peripheral CD4+ T cell counts [17]. Consequently, HAART has dramatically diminished morbidity and
mortality among HIV infected individuals [16]. Nevertheless, HAART also embraces some problems like undesirable toxic side-effects and the associated elevated costs [16].
When is the best time to initiate HAART? This question has been widely discussed, due to both problems resulting from short- and long-term toxic effects of commencing HAART during early-stages of disease, and to the harmfulness evidences of untreated HIV infection [16]. The current guidelines in Europe [18] and in the USA [19] indicate initiation of therapy when CD4+ T
cell numbers fall below 350 cells/μL. Nonetheless, this issue has been actively debated over time. In the beginning, the concept of hitting HIV early and hard, even when infected individuals were in early-stage disease (CD4+ T cell counts above 500 cells/μL), was considered to be the
best approach [20]. With time, the emergence of HAART side-effects lead physicians to reconsider this strategy, by postponing HAART initiation. Nowadays, the therapeutic strategies are again changing to a more aggressive approach, due to the fact that the currently antiretroviral drugs used are considered safe and are well tolerated by the vast majority of patients, and due to the evidences that HAART prevents transmission [16]. However, in specific circumstances, HAART can be initiated regardless of CD4+ cell counts, such as in pregnant women, in patients
with active viral hepatitis, coronary artery disease, history of an AIDS-defining illness and in HIV-associated nephropathy [16, 19].
1.1.4. Immune Reconstitution under HAART
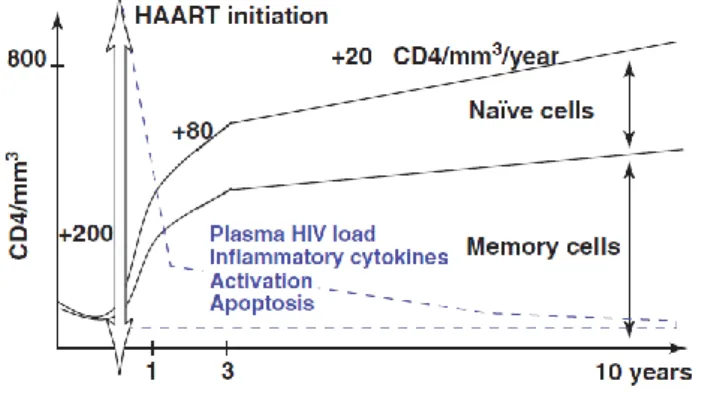
After commencing HAART, immune reconstitution of the CD4+ T cell compartment is
kinetically achieved, in most cases, in a biphasic fashion [17, 21]. During the first 2–3 months HIV viral load rapidly declines and CD4+ T cell numbers increase (Figure 6). This could be
explained by the release or redistribution of memory CD4+ T cells from lymphoid tissues, such as
the lymph nodes and GALT, due to decreased viral replication, which may contribute for cell entrapment. Simultaneously, the number of CD8+ T cells, of NK T cells and B cells augment and
the levels of inflammatory cytokines [e.g. tumor necrosis factor-alpha (TNF-α), interleukin (IL)-6], activation and apoptosis diminish [17]. The second phase proceeds for several years, and seems to rely on the regeneration of naïve CD4+ T cell compartment (Figure 6). This seems to be
7 explained by several processes, such as homeostatic peripheral expansion of pre-existing naïve and memory T cells, by increased cell life-span and by thymic export of new naïve T cells to the periphery, which is fundamental to augment the T cell repertoire diversity [17, 22]. Peripheral naïve CD4+ T cells also accumulate due to diminished conversion of naïve into memory cells, as
a result of decreased loss of memory CD4+ T cells and decreased immune activation.
Reconstitution continues beyond 10 years of HAART, although at a slower rate after 3 years of therapy [17].
Figure 6. Biphasic kinetics and mechanisms associated with the reconstitution of the CD4+ T cell compartment
after starting HAART. Extracted from [17].
Despite the successful introduction of HAART, a proportion of 17–40% of HIV infected individuals receiving HAART that are full viral responders, present poor immunological reconstitution, as measured by the gain in number of CD4+ T cells until reaching a plateau after
4–5 years of HAART [17, 23, 24]. These individuals are mentioned to as immunological non-responders (InR). The mechanisms underlying immune reconstitution failure remain to be fully explained. Among the causes that have been put forward to justify poor reconstitution [22, 23], are: impaired bone-barrow function; reduced thymic output; high percentages of CD4+ regulatory
T cells (Tregs); high immune activation; ongoing residual viral replication; advanced age; long duration of HIV infection before HAART; low baseline CD4+ T cell count before HAART;
co-infections (e.g. Hepatitis C Virus); and gut microbial translocation.
Our previous results suggest that the percentage of Tregs influences immune reconstitution (Horta et al. manuscript submitted for publication). Tregs might be from two origins: thymic origin (naturally occurring Tregs) or induced in the periphery (induced Tregs). Since the major goal of this work is to explore how Tregs and thymic activity correlate to each other in HIV infected individuals, from now on, the role of thymic activity and Tregs, the
8 relationship between these parameters and on how they could be influencing the immune reconstitution of HIV-1 infected individuals, are object of more detailed introduction.
1.2. The Thymus
1.2.1. A Brief Overview: Structure and Function
The thymus is a mediastinal organ where new T cell differentiation takes place. This lobulated organ comprises two core elements, the thymic epithelial space and the non-epithelial perivascular space, both within the thymic capsule. The thymic epithelial space is an epithelial network, consisting on an inner medulla and an outer cortex, and it is where T cell differentiation (thymopoiesis) occurs. The perivascular space is the non-thymopoietic portion of the thymus located between the thymic epithelial space and the thymic capsule. It contains blood vessels and presents infiltrates of peripheral memory CD4+ and CD8+ T cells and of B cells [25-27].
T cell lymphopoiesis starts by the migration of hematopoietic progenitor cells from bone-marrow (or from the fetal liver during development) to the thymus, which provides a microenvironment of well-orchestrated stimuli that induces T-cell lineage commitment and differentiation [25, 28, 29]. During this process, T cell receptor (TCR) genes undergo sequential chromosomal rearrangements, so that functional and highly diverse TCRs are generated. Subsequently, thymocytes that express a mature TCR are selected to discriminate between self and non-self-antigens, first by recognizing antigens presented in the context of self-major histocompatibility complex (MHC, positive selection), and then thymocytes auto-reactive to self-antigens are eliminated (negative selection) [27, 29]. The final mature thymocytes are exported to the periphery as newly generated naïve T cells [27], also called recent thymic emigrants (RTEs), to set up and enrich in diversity the peripheral T cell pool.
1.2.2. Age-Dependent Thymic Involution
The thymus is essential for setting up the peripheral T cell pool before birth and early in life, as children borned with congenital absence of the thymus (complete DiGeorge Syndrome) present severe defects in T cell production and function [26, 30].
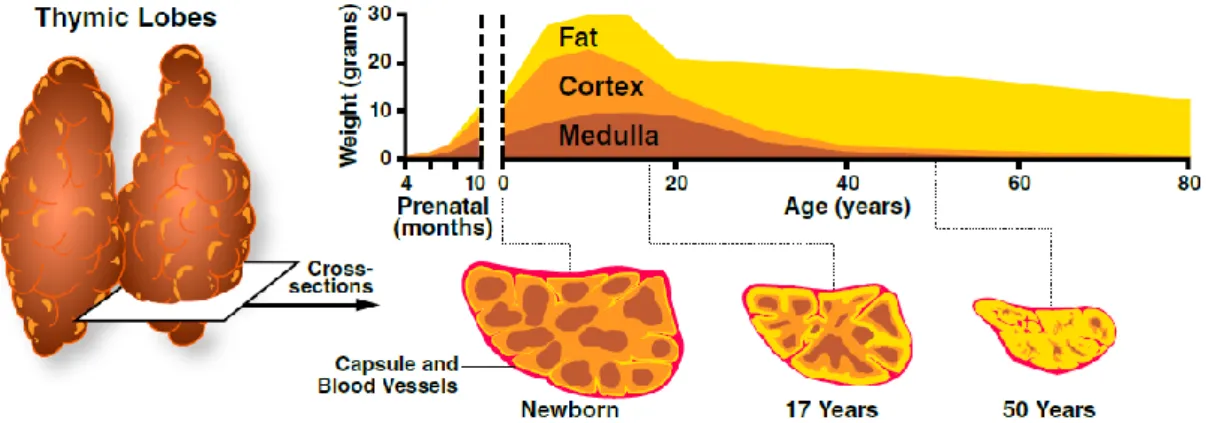
The thymus undergoes an age-dependent involution associated with a decline in function and consequently, in thymopoiesis. Previously, it was thought that the end of puberty was a marker of the beginning of thymic involution, but currently it is known that the thymus begins its
9 age-associated involution after one year of age, at a rate of 3% of volume shrinkage until middle age (35-45 years of age), and of roughly 1% throughout the rest of the life. As age advances, the perivascular space becomes gradually expanded due to fat (adipocytes) accumulation, leading to the shrinkage of thymic epithelial space (medulla and cortex) (Figure 7) [25, 26].
Figure 7. Age-associated thymic involution. As individuals’ age advances, the thymic epithelial space that comprises both
medulla (brown) and cortex (orange), which is responsible for thymopoiesis, starts to shrink due to the gradual and increasing accumulation of adipocytes (yellow) in the perivascular space. This process leads to a diminishment of the total thymic volume, of the thymic epithelial space and, consequently of the production and export of naïve T cells to the periphery over time. Extracted from the website [31].
Although thymic activity descreases over time, it was reported the existence of thymic activity at least until the eight decade of life due to the presence of thymic epithelial islands of cortex and medulla in a 78 years-old woman [25]. In addition, since the late 1990’s, evidence emerged that there is an interplay between an age-dependent contribution of the thymus, by producing RTEs, and the peripheral expansion/proliferation of post-thymic T cells for the regeneration and preservation of the peripheral T cell pool. Thymus contibution seems to predominate mostly early in life, and peripheral expansion at later ages [14, 26].
1.2.3. Major Techniques to Assess Thymic Activity in Humans
Thymopoiesis in humans has been evaluated by several methods, mainly to assess thymic contribution during peripheral T cell reconstitution in some clinical settings, like during HIV infection. Frequently, the combination of different methods has been used to overcome technical limitations that each method comprises.
A widely used technique for assessment of thymic activity is the quantification of signal-joint T cell receptor excision circles (sjTRECs) by real-time quantitative polymerase chain reaction [14, 32-34]. TRECs are portions of episomal DNA excised during chromosomal rearrangements, when the TCR is formed in developing thymocytes, and are present only among naïve T cells.
10 TRECs are stable and do not duplicate during cell division/proliferation, so the higher the TREC frequency in a given population, the more immature are T cells and less proliferation they experienced [14]. Among the different TRECs formed, the sjTRECs (Figure 8A) are present in nearly 70% of RTEs, thus they have been used as surrogate markers of thymic output [14, 32-34].
Figure 8. Generation of TREC molecules and the sj/βTREC ratio. The sjTRECs are circular DNA molecules excised during chromosomal rearrangement of T cell receptor genes, at the TCRα locus, when the T cell receptors are being formed in the process of thymocyte maturation (A). DJβTRECs are generated early in thymopoiesis, previously to sjTRECs formation, and are diluted during intrathymic maturation of thymocytes undergoing clonal expansion, between late triple-negative (TN) and early double-positive (DP) stages (B). The sjTRECs generated later in thymopoiesis, in the DP stage. The thymocytes in the single-positive stage (SP) harbour both types of TRECs that are quantified in the periphery by Real-time PCR to calculate the sj/β TREC ratio. Adapted from [35].
Nevertheless, in clinical cases such as in HIV infection, due to increased T cell proliferation in the periphery, TREC molecules dilute faster, resulting in an impaired association between sjTRECs frequency and thymic output, regardless of thymic activity. To overcome this problem Dion et al. [36] proposed the sj/β TREC ratio as a reliable estimate of intrathymic proliferation and thus of thymopoiesis, by taking into account the quantification of both sjTRECs and DJβ TRECs frequencies in the periphery (Figure 8B). Supporting this reliability is the fact that the sj/β TREC ratio is not significantly affected by extrathymic proliferation, and alike sjTRECs decreases with age [36].
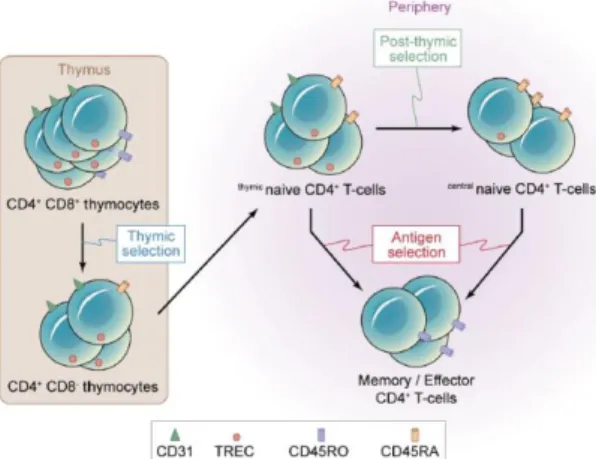
Identification of cell surface molecules on RTEs by flow cytometry is another extensively used technique for routine assessment of thymic activity in the periphery or within thymic dissociated tissue [14, 32, 37-41]. At the end of last century, beginning of the XXI century, thymic activity was quantified by the percentage or number of naïve T cells, using CD45RA and CD62L as markers [14, 32]. However, naïve T cells are the sum of both thymic output and peripheral expansion. Nevertheless, in 2002 Kimmig et al. [38] first stated the use of CD31 [also known as platelet endothelial cell-adhesion molecule (PECAM-1)], within the naïve pool (CD45RA+) of CD4+ T cells as a correlate of thymic activity in the periphery (Figure 9).
11
Figure 9. Representation of mechanisms of post-thymic proliferation in human naïve CD4+ T cells. Extracted from
[42].
CD4+ T cells that co-express CD31 and CD45RA have an average TREC frequency 8
times higher than that of CD45RA+ CD4+ T cells lacking CD31 expression in healthy individuals
[38]. This also highlighted the advantage of using CD31 instead of CD27 and CD62L (markers are expressed by the majority of CD45RA+ CD4+ T cells) to characterize naïve CD4+ T cells. By
the level of CD31 expression two different subpopulations can be distinguished within the naïve CD4+ T cell pool: one that already underwent homeostasis-driven peripheral expansion and lacks
CD31; and another that has a more recent thymic origin due to higher TREC content and is CD31+ [38].
More recently it was also described the use of protein tyrosine-kinase 7 (PTK7) as a cell surface marker for RTEs within peripheral naïve CD4+ T cells, for which antibodies are also
available [43, 44]. However, the reports from two different groups showed substantially different results, concerning the percentages of PTK7 and so the potential of this marker to characterize RTEs needs to be further addressed.
Analysis of T cell repertoire diversity might also be considered, although indirectly, as a way to evaluate thymic output, since a diverse peripheral T cell repertoire is indicative of thymic activity. This has been done via spectratype analysis of the complementary determining region 3 (CDR3) length for each Vβ family of the TCR by PCR methods [30, 45]. Flow cytometry is also used to analyze diversity by determining TCRVβ usage [45].
Chest Computed Tomography (CT) scans are used to evaluate both thymic volume [46, 47] and size [34, 48], since it has been shown a correlation between these parameters and thymic activity. However, this association has to be made with caution, as it does not furnish full insight about thymopoietic activity [13, 30]. Positron Emission Tomography (PET) is based on the
12 measurement of metabolic activity, by uptake of radiolabeled glucose, which has been also correlated with metabolically thymic activity [25].
1.3. Thymic Function in the Context of HIV Infection
HIV induces lymphopenia by depleting the CD4+ T compartment in HIV infected
individuals. Since the thymus is the primary organ of T lymphopoiesis, it is of interest to address its’ role in the setting of HIV infection. The last 15 years provided a wealth of information regarding the role of thymus during HIV infection, but despite so much progress, the exact role of this organ during the process of immune reconstitution in HIV infected individuals remains a matter of controversy and investigation.
1.3.1. Effects of HIV on Thymic Structure and Activity
Besides the profound CD4+ T cell lymphopenia and chronic immune activation, thymic
function seems also to be impaired during HIV infection, with reduced export of new T cells and changes in thymic structure. The thymic perivascular space is filled up and expands due to inflammatory infiltrates of macrophages, B cells, and CD8+ effector T cells, as shown by
immunohistological analysis of thymuses from five HIV infected individuals, both treatment-naïve and on HAART [13]. Calcification of Hassall’s bodies and collapsed thymic epithelium, with extended areas lacking thymopoiesis on two of five individuals, also seem to be the result of HIV-induced changes in thymic morphology [13]. Consequently, thymus atrophy increases at an accelerated rate, in comparison with natural age-related thymic involution. HIV-infected cells were also detected inside thymus, both early and in late stages of the disease [13, 32].
Impaired thymic function in HAART-naïve individuals was demonstrated by estimation of sj/β TREC ratio [36]. A rapid and profound suppression of intrathymic thymocyte proliferation was shown in the acute phase of the disease, in comparison to age-matched healthy individuals [36]. Similarly, relatively early in the progression of the disease in HAART-naïve individuals, TREC levels among peripheral CD4+ and CD8+ T cells and in the lymph nodes decrease, in comparison
to age-matched healthy individuals [14]. In the absence of HAART, the thymus seems to be active during the infection, but only until peripheral CD4+ T cell numbers fall below 200 cells/μL
13 1.3.2. Immune Reconstitution under HAART: is the Thymus Part of the
Business?
The thymus has been shown to contribute for immune reconstitution after chemotherapy and bone-marrow transplantation [26, 30]. Likewise, rises in peripheral CD4+ T cell counts after
HAART in HIV infected individuals are linked to regained thymic activity [14]. Meanwhile, a percentage of HIV infected individuals show poor reconstitution, regardless of viral suppression. One explanation put forward is impaired thymic activity [49]. So, it is imperative to understand the role the thymus is playing during HIV infection and immune reconstitution, especially among immunological non-responders.
Although data regarding to negligible contribution of the thymus to reconstitution are also reported [13], several others have suggested a link between immune recovery and thymic activity after HAART. Indeed, thymic structure seems to recover upon HAART initiation, even after moderate to severe HIV disease before HAART [32, 34]. Correlations between thymic size and immune reconstitution, measured by increases in the absolute number of CD4+ T cells, were
detected in HIV infected individuals [48]. Baseline thymic volume may also predict the magnitude of CD4+ T cell number recovery, in short and long-term HAART [46]. However, in another study,
despite CT of one individual on HAART revealed the presence of thymic tissue two days before death, the immunohistological analysis of the thymus in the same patient after death showed absence of active thymopoiesis [13]. Therefore, correlations between thymus size and presence of thymic activity should be made with caution. Nevertheless, another report assessed thymic volume as predictor of CD4+ T cell loss after halting HAART, and individuals with bigger thymic
volume presented a slower rate of CD4+ T cell drop after treatment interruption [47]. Additionally,
thymic volume also correlated positively with the number of TRECs in CD4+ T cells in HIV
infected individuals under HAART [34].
Actually, in what concerns TRECs, HIV infected individuals under HAART with lower thymic tissue have been shown to present lower numbers of CD4+ T cells bearing TRECs than
the ones that have abundant thymic tissue, independently of age and duration of HAART [48]. In agreement, TREC levels have been shown to be increased in naïve CD4+ T cells after HAART,
which indicates that the increase in the CD4+ T cell counts seems not to be due to the release of sequestered cells in the lymph nodes, but instead of RTEs output by the thymus [14]. Similarly,
14 sj/β TREC ratio was also shown to be increased after HAART, which suggests a thymopoietic contribution for immune reconstitution [36].
A possible negative correlation between T cell repertoire perturbation and thymic size was also described in HIV infected individuals on HAART [48]. Individuals with minimal thymic tissue have a tendency to present reduced repertoire diversity, with a mean degree of perturbation of the CD4+ T cell repertoire higher than HIV-infected individuals with abundant thymic tissue [48].
CD31 expressing naïve T cells have been widely used as a correlate of thymic activity during HIV infection [37, 39, 40, 49]. A positive correlation was shown between the percentage of CD31+ naïve CD4+ T cells and thymic volume, percentage of naïve T cells, and with TREC
frequency among CD4+ T cells [39]. The numbers of CD31bright naïve CD4+ T cells after one year
of HAART were significantly increased. These cells were enriched in 80% more TREC numbers than CD31+ naïve T cells, meaning they are less proliferation experienced and have a more
recent thymic origin [40]. Moreover, InR individuals also have less percentage of CD31+ naïve T
cells than immunological responders (IR) after long-term HAART, setting impaired thymic output as a determinant of immune reconstitution failure [49].
1.4. Tregs in the Context of HIV Infection
1.4.1. Tregs in the Immune System: What’s their Purpose?
Tregs are key regulators of the immune system, and essential for the maintenance of homeostasis and prevalence of self-tolerance. If somehow any dysfunction inflicts this delicate equilibrium, immunopathology, allergy or even autoimmune illnesses may arise [50].
In humans, Tregs can be phenotypically characterized by the constitutive expression of CD25 (the IL-2 receptor-α) and by the master control gene forkhead-box transcription factor P3 (Foxp3), which is responsible for Tregs differentiation and function on CD4+ T cells. More
recently, CD127 (the IL-7receptor-α) has been also used to discriminate Tregs from conventional activated CD4+ T cells that can transiently express Foxp3 [50, 51].
There are two types of Treg, peripheral induced-Treg (iTreg) and naturally occurring Treg (nTreg) [52]. Concerning to nTreg, ontogenetically it was demonstrated that they are formed in the thymus, specifically in the double-positive stage of thymocyte development [53]. Functionally
15 they are both capable of suppressing proliferation, T cell priming, inhibit activation, induce cytolysis or apoptosis in a direct cell-to-cell contact fashion, or by producing cytokines [50].
1.4.2. Regulatory T cells in Immune Reconstitution under HAART: Friends or Foes?
The role of Tregs has been addressed in the context of several chronic viral infections, such as herpes simplex virus, hepatitis C virus and HIV [54]. With respect to HIV, since the immune system is subjected to a constant state of hyperactivation, due to the pro-inflammatory nature of HIV, an intricate balance between a fighting immune response and prevention of immunopathology may arise. Tregs seem to be crucial to modulate this equilibrium, but the role Tregs play in the setting of HIV infection is so far ill understood and controversial [51, 54]. On one hand, Tregs are reported to have detrimental impact by limiting HIV-specific CD8+ T cell
responses and by promoting fibrosis in lymphoid tissues [15, 51]. On the other hand, Tregs seem also to have a beneficial effect dampening HIV-induced aberrant immune activation that results in immunopathology [51].
There is evidence that Tregs themselves are susceptible to be infected and depleted during HIV infection, presenting decreased peripheral numbers during HIV infection [54]. Nonetheless, the peripheral percentages of Treg seem to be augmented as disease progresses, with expansion of both naïve and memory subsets [55], and persist elevated even after HAART [39, 55, 56]. One of the advanced explanations is related to the increased production by the thymus of nTreg since a correlation between naïve Tregs numbers and TREC frequencies among CD4+ T cells was observed in a longitudinal assessment of HIV infected individuals under HAART
[57]. In agreement with this observation, is a recent report showing increased frequencies of developing Tregs in thymuses of HIV infected individuals, in comparison to healthy controls [41]. Another report also shows that CD31 may mark Tregs as being from recent thymic origin in the context of HIV [39]. Using only Foxp3 to define Tregs, it was reported that the percentages of CD31+CD45RA+ Tregs are positively correlated with the sjTRECs content among CD4+ T cells
and with numbers of circulating CD45RA+ CD4+ T cells, in HIV infected individuals under HAART
[39]. On the contrary, a recent report showed that the percentages of Tregs, in individuals under HAART, seem to inversely correlate with both percentages and numbers of peripheral naïve CD4+ T cell, in particular in individuals with low level of reconstitution [58].
16 Both elevated Treg percentages and impaired thymic activity have been proposed as possible explanations for poor immune reconstitution [22, 23]. However, the relationship between these two factors and how they influence immune reconstitution during HIV infection remains to be elucidated.
17
2. Aims
Thymic activity and Tregs play a role during the immune reconstitution of HIV infected individuals. However, the relationship between these parameters during immune reconstitution caresses of further clarification. Thus, the aim of this cross-sectional study in HIV infected individuals on HAART and with suppressed viral replication is to assess how thymic function and Tregs correlate with the quality of immune reconstitution and how much these two variables are associated with each other. More specifically, we will:
1. Evaluate how the relationship between Tregs percentages and thymic activity correlates with the immune reconstitution;
2. Assess the role of the thymus in Tregs output;
3. Assess how Tregs and thymic activity influence immune reconstitution on the IR and InR reconstitution groups.
19
3. Material and Methods
3.1. Study Participants
In this cross-sectional study were enrolled 54 HIV infected individuals attending at the Hospital Joaquim Urbano (HJU), Centro Hospitalar do Porto (Porto, Portugal) (44 ± 8 years-old, range 31 to 62 years-old; 78% were males) under the following criteria: 1) infection with HIV-1; 2) receiving HAART for at least one year; 3) being on regular HAART compliance (with no history of irregular compliance on the past), and; 4) plasma viral loads below 50 copies of HIV RNA/mL. The study was approved by the ethics committee of HJU and the individuals were enrolled in the study after provided signed informed consent on volunteer basis. CD4+ T cell counts were
obtained from a reference laboratory. CD4+ T cell count progression was calculated by
subtracting baseline CD4+ T cell count (before HAART initiation) from the CD4+ T cell count at
the moment of blood collection for each individual.
3.2. Flow Cytometry Analysis
Blood was collected to heparinized tube and processed for multiparametric flow cytometry analysis on the day of collection.
3.2.1. RTEs Characterization
200 μL of whole blood was incubated for 15 min, at room temperature, with the following combination of monoclonal antibodies: PE-conjugated α-CD3 (clone OKT3), Pacific Blue-conjugated α-CD8 (clone RPA-T8), FITC-Blue-conjugated α-CD45RA (clone HI100), PE-Cy7-Blue-conjugated α-CD31 (clone WM59; all purchased from Biolegend, San Diego, CA, USA) and APC-H7-conjugated α-CD4 (clone RPA-T4, from BD Biosciences, San Jose, CA, USA). Afterwards, erythrocytes were removed upon for 15 min, at room temperature, in FACS Lysis Buffer (BD Biosciences, San Jose, CA, USA) and washed on FACS buffer. Each antibody was titrated using serial dilutions until the optimal concentration was determined.
3.2.2. Tregs Characterization
Peripheral blood mononuclear cells (PBMCs) were obtained by gradient centrifugation using Histopaque 1077 (Sigma-Aldrich, St. Louis, MO, USA) for 30 min, at room temperature, according to the manufacturer's instructions. Cells were collected, washed twice with sterile PBS
20 and enumerated using trypan blue exclusion dye. 2 million fresh PBMCs were cell surface stained upon incubation for 15 min, at room temperature, with V500-conjugated α-CD3 (clone UCHT1), APC-H7-conjugated α-CD4 (clone RPA-T4, both from BD Biosciences, San Jose, CA, USA), Pacific Blue-conjugated α-CD45RA (clone HI100), PE-Cy7-conjugated α-CD31 (clone WM59), PerCP-Cy5.5-conjugated α-CD127 (clone PHCD127) and APC-conjugated α-CD25 (clone BC96, all from Biolegend, San Diego, CA, USA). The intracellular staining of Foxp3 was performed using Foxp3 Staining Buffer Set from eBioscience (San Diego, CA, USA), accordingly to the manufature’s instructions using the PE-conjugated α-FOXP3 (clone PCH101, eBioscience, San Diego, CA, USA). Each antibody was titrated using serial dilutions until the optimal concentration was determined.
3.2.3. Flow Cytometry Data Analysis
All samples were acquired on a BD LSR II flow cytometer using FACS DIVA software and data were analyzed using FlowJo Software (Tree Star, OR, USA)
3.3. Statistical Analysis
The distribution of different variables was assessed for all individuals and in the different reconstitution groups by the Shapiro-Wilk normality test. Comparisons between the groups of Low and High %Tregs were made using Mann-Whitney’s test or unpaired t-test, depending on whether or not the variables have a normal distribution. Comparisons between the different reconstitution groups were made by using Mann-Whitney’s test or Kruskal-Wallis test followed Dunn multiple comparison tests. Spearman’s rank test was performed to assess correlations between two variables. The p - values were considered statistically significant when p < 0.05.
The k-means cluster analysis was performed in the Statistical Package for the Social Sciences (SPSS) version 20 (IBM corporation, Armonk, New York). Individuals were clustered in two groups based on Tregs percentages, in which the distance between cluster centers of the two desired groups is maximized in an iterative process (maximum number of iterations set to 25) (Low %Tregs group, mean = 6.20; High %Tregs group, mean = 13.33). The two groups were named as individuals with Low %Tregs and High %Tregs, if they belong to the group with low or high percentages of Tregs, respectively (Tregs range on Table 3, section 4.3.).
21
4. Results
4.1. A Novel Gating Strategy to Define Recent Thymic Emigrants (RTEs)
The thymus has been shown to play a role during the immune reconstitution of HIV infected individuals, mainly subsequently to HAART initiation [49, 59]. In this regard, CD31 expression among peripheral naïve CD45RA+CD4+ T cells has been associated with thymic
activity in the setting of HIV infection [37, 39, 40, 49]. Although double-positive CD31+CD45RA+
cells have been used as a correlate of thymic activity, a report showed that CD31 is not necessarily lost during cell proliferation, namely during IL-7-induced proliferation [60]. This shows that some cells might maintain CD31 expression long time after leaving the thymus. Thus, some groups proposed to assess RTEs as naïve CD45RA+CD4+ T cells that express high levels of CD31
and, in fact, the level of CD31 expression was strongly associated with higher TREC content in these cells, as compared with cells with dim to low expression of CD31 [37, 40].
The gating strategy to select CD31+ CD45RA+CD4+ T cells is easy to define, but selecting
CD31high CD45RA+CD4+ T cells is more complex, as it is not obvious where to set a threshold
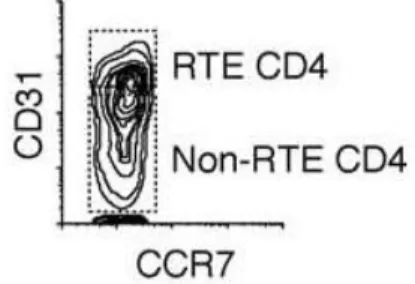
that clearly define CD31high from CD31+ cells. One gating strategy proposed by other authors to
define CD31high naïve CD45RA+CD4+ T cells, as shown in Figure 10, selects the CD31+ T cells
above the area of high density of cells among naïve CD45RA+CD4+ [37]. However, we noticed
that the percentage of CD31highCD45RA+CD4+ T cells selected using this gating strategy seems
to be influenced by the individual’s percentages of naïve CD45RA+CD4+ T cells. So, in an attempt
to define RTEs in our study, we observed that monocytes, granulocytes, and the CD45RA- and
CD45RA+ subsets of CD4+ T lymphocytes show different expression levels of CD31 both for
healthy controls (Figure 11A) and for HIV infected individuals (Figure 11B)).
Figure 10. Flow cytometry gating strategy used to select cells that express high levels of CD31 among naïve
CD4+ T cells. RTE CD4 were selected among CD31+CCR7+CD45RA+CD4+ T cells, by gating cells that express high levels of
22
Figure 11. Different profiles of CD31 expression among CD4+ T lymphocytes, granulocytes and monocytes. In
flow cytometry dot plots of whole blood samples from a representative healthy control (A) and from a representative HIV infected individual (B) we assessed the profile of CD31 expression on monocytes (green), granulocytes (orange) and on the CD45RA- (red) and CD45RA+ (blue) subsets of CD4+ T cells.
Monocytes are the cells with the highest level of CD31 expression followed, sequentially, by granulocytes, CD45RA+ CD4+ T lymphocytes and CD45RA- CD4+ T lymphocytes (Figure 11A
and B), which has been previously shown in the literature [61, 62]. In addition, the profile and order by which each cell population express CD31 is very similar both for the healthy controls (Figure 11A) and for HIV infected individuals (Figure 11B). Additionally, we also observed a partial overlap between the peaks of CD31 expression of both granulocytes and CD45RA+CD4+ T cells.
This observation prompted us to set a threshold to define CD31high cells among naïve
CD45RA+CD4+ T cells, taking into account the CD31 expression among granulocytes. We defined
the threshold (red line) for cells that express CD31 among granulocytes, tangentially to the area with higher density of cells, both for healthy controls (Figure 12A) and for HIV infected individuals (Figure 12B). Then, we applied this threshold to the CD4+ T cell compartment by plotting
SSC FSC Co u n ts CD31 PE-Cy7 B HIV A Control o SSC FSC Co u n ts CD31 PE-Cy7
23 CD45RA against CD31 to further identify CD31high cells (cells inside the red box). The peak of
CD31 expression on CD31highCD45RA+CD4+ T cells as expected, laid between the peaks both
CD45RA+CD4+ T cells and granulocytes for healthy controls (Figure 12A) and for HIV infected
individuals (Figure 12B).
Figure 12. Gating strategy defined to select CD31highCD45RA+CD4+ T cells (RTEs) in our study. CD31 expression
among granulocytes was considered to define a threshold for selecting CD31highCD45RA+CD4+ T cells. A threshold (red line on
the left dot plots from each panel) for cells that express CD31 among granulocytes was set near the area of high density of cells both for a healthy control (A) and for a HIV infected individual (B). This threshold was then applied to the CD4+ T cell
compartment, and only cells that were CD45RA+CD31high on the right-side of threshold line were selected as RTEs (red box,
middle plots from each panel). The peak of CD31 expression of these cells (black) laid between the peaks of both CD45RA+CD4+
T cells (blue) and granulocytes (orange) for the healthy control (right panel in A) and for the HIV infected individual (right panel in B).
We consider that using this gating strategy could be advantageous since, by considering CD31 expression among granulocytes on a case by case basis, we would have an internal control for CD31 expression/staining for each individual. Moreover, the previously described gating strategy considers that all individuals have a defined population of CD31high cells, which should
not be the case for individuals with no or minimal thymic output. In Figure 13 we show the novel
CD31high CD31high B HIV CD 4 5 RA F IT C CD31 PE-Cy7 Co u n ts CD31 PE-Cy7 CD 4 5 RA F IT C CD31 PE-Cy7 Co u n ts CD31 PE-Cy7
Gated on Granulocytes Gated on CD4+ T cells
A Control
24 gating strategy defined by us, taking into account the expression of CD31 among granulocytes, in comparison to the one proposed by others earlier (Figure 10) [37].
Figure 13. Comparison between the two gating strategies. Representative analysis of CD31high RTEs for four HIV
infected individuals with high (± 50%; A) and low (± 20%; B) percentages of naïve CD4+ T cells using the two gating strategies for
each individual. The gating strategy define by us was based on the levels of CD31 expression on granulocytes (left panels) and the gating strategy previously reported [37] selects CD31high cells above the area with high density of CD45RA cells (right panels).
A B 0.92% 7.38% 7.88% 18.57% 0.49% 8.30% 1.93% 7.42% CD 4 5 RA F IT C CD31 PE-Cy7
HIV - Low % naïve CD4+ T cells
Gating Strategy - Granulocytes Gating Strategy - High Density of CD45RA+ cells
Gated on Granulocytes Gated on CD4+ T cells Gated on CD45RA+CD4+ T cells Gated on CD4+ T cells
CD 4 5 RA F IT C CD31 PE-Cy7
HIV - High % naïve CD4+ T cells
Gating Strategy - Granulocytes Gating Strategy - High Density of CD45RA+ cells
Gated on Granulocytes Gated on CD4+ T cells Gated on CD45RA+CD4+ T cells Gated on CD4+ T cells
In d iv id u a l 4 In d iv id u a l 3 In d iv id u a l 2 In d iv id u a l 1
25 As can be seen, the different gating strategies yield very different percentages of CD31highCD45RA+CD4+ T cells for the same individual (Figure 13A and B). These different
percentages of CD31high cells also proportionally represent very different percentages of
CD31high cells among the CD31+CD45RA+CD4+ T cells, mainly for individuals with low
percentages of naïve CD4+ T cells (Table 2). In this case, when the gating strategy is the one that
selects CD31high cells above the area of high density of CD45RA+ cells, the CD31high cells
represent more than 50% of CD31+ among naïve CD45RA+CD4+ T cells. Interestingly, this is the
case for both individuals analyzed with low percentages of naïve CD45RA+CD4+ T cells (Table 2).
Moreover, taking into consideration that the blood of all these individuals were stained for flow cytometry analysis on the same day, with the same mix of antibodies, the shift on the threshold to determine the CD31high is quite impressive among the individuals with low percentages of CD45RA+CD4+ T (Figure 13B). So, in this study we defined RTEs as CD31high cells among
CD45RA+CD4+ T cells by taking into account CD31 expression on granulocytes for each
individual, as an internal control.
Table 2. Comparison of the percentages of RTE obtained by the two gating strategies. Respective age and percentages of CD45RA+, of CD31+CD45RA+, of CD31high and of CD31high among CD31+CD45RA+ cells for each patient
analyzed in Figure 13. The ratios between the gating strategy using the area of high density of CD45RA+ cells (A) and the one that
takes into consideration the granulocytes (B) is also shown.
Gating Strategy (High Density of CD45RA+ Cells)
Gating Strategy (Granulocytes) Individual Age %CD45RA+ CD4+ T cells %CD31+CD45RA+ CD4+ T cells %CD31high among CD31+CD45RA+ T cells %CD31high CD45RA+CD4+ T cells %CD31high among CD31+CD45RA+ T cells %CD31high CD45RA+CD4+ T cells 1 62 47,23 23,84 30,95 7,38 3,86 0,92 2 41 44,97 36,22 51,27 18,57 21,76 7,88 3 39 22,56 12,47 66,55 8,30 3,93 0,49 4 33 20,28 13,10 56,64 7,42 14,73 1,93
4.2. Thymic Activity and Immune Reconstitution
After defining a strategy for gating RTEs, we assessed how is thymic activity associated with the immune reconstitution of the HIV infected individuals on HAART from our cohort. We assessed not only the peripheral counts of CD31high CD45RA+CD4+ T cells but also of CD31+
CD45RA+CD4+ T cells (Figure 14), since double-positive cells have been previously used by the
majority of the reports to assess thymic activity [39, 49]. As data shows, the increase in peripheral CD4+ T cell counts is positively correlated with both peripheral counts of CD31high (r =
0.5056, p < 0.0001) (Figure 14A) and of CD31+ CD45RA+CD4+ T cells (r = 0.7905, p < 0.0001)
![Figure 1. Structure of HIV - 1 virion and major constituents. Extracted from the website [5]](https://thumb-eu.123doks.com/thumbv2/123dok_br/17799480.840713/17.892.330.607.865.1113/figure-structure-hiv-virion-major-constituents-extracted-website.webp)