Deposited in Repositório ISCTE-IUL:
2018-11-06
Deposited version:
Post-print
Peer-review status of attached file:
Peer-reviewed
Citation for published item:
Simões, F., Calheiros, M. M. & Alarcão, M. M. A. (2018). Socioeconomic status,multiple autonomy support attunement, and early adolescents' social development. Journal of Community Psychology. 46 (6), 790-805
Further information on publisher's website:
10.1002/jcop.21973
Publisher's copyright statement:
This is the peer reviewed version of the following article: Simões, F., Calheiros, M. M. & Alarcão, M. M. A. (2018). Socioeconomic status,multiple autonomy support attunement, and early adolescents' social development. Journal of Community Psychology. 46 (6), 790-805, which has been published in final form at https://dx.doi.org/10.1002/jcop.21973. This article may be used for non-commercial purposes in accordance with the Publisher's Terms and Conditions for self-archiving.
Use policy
Creative Commons CC BY 4.0
The full-text may be used and/or reproduced, and given to third parties in any format or medium, without prior permission or charge, for personal research or study, educational, or not-for-profit purposes provided that:
• a full bibliographic reference is made to the original source • a link is made to the metadata record in the Repository • the full-text is not changed in any way
Socioeconomic status, multiple social support attunement and early adolescents’ social development.
Running head: SES and multiple autonomy support attunement
T
HIS IS A PRE-
PUBLICATION COPY(BEFORE THE PROOFREADING PROCESS - IT MIGHT CONTAIN MINOR ERRORS Corresponding author:
Francisco Alexandre Melo Simões
Centre for Social Research and Intervention
University Institute of Lisbon, Av. das Forças Armadas, 1649-026 Lisboa, Portugal [email protected]
Maria Manuela Calheiros
Centre for Social Research and Intervention University Institute of Lisbon, Lisboa, Portugal
Centro de Investigação em Ciência Psicológica, Faculdade de Psicologia, Universidade de Lisboa, Portugal.
Madalena Moutinho Alarcão e Silva University of Coimbra, Coimbra, Portugal Acknowledgments
This work was funded by a research grant from the Foundation for Science and Technology (SFRH/BPD/99616/2014)
Abstract
This study explores the relationship between socioeconomic status (SES), Multiple Autonomy Support Attunement (MASA) and social development indicators (antisocial behavior, prosociality, and self-regulation), considering the concurrent effects of structural (gender and age) and social factors (social networks’ size and orientation). MASA describes patterns of autonomy support provided by different sources, which in this case were parents, teachers, and mentors. Participants were 645 adolescents (M = 12.30; SD = .60; 55.35% girls).
Using Latent Class Analysis LCA), a four-class solution for MASA presented the best fit. A Generalized Linear Model (GLM) approach revealed that lower SES was associated with greater antisocial behavior, while MASA was linked to improved prosociality and self-regulation when youths were included in a high-attuned multiple autonomy support class, compared to other MASA classes. Thus, optimal levels of MASA can represent an asset for training, implementation, and assessment stages of interventions aimed at improving early adolescents’ positive social development.
Keywords: socioeconomic status; autonomy support antisocial behavior; prosocial behavior;
Studies on multiple autonomy support, meaning the autonomy support provided by two or more support sources (Rueger, Malecki & Demaray, 2010), have often focused on each support source’s relative influence on social development indicators. In contrast, the potential
connections between autonomy support patterns provided by key familial or non-familial adults, socioeconomic conditions and social development outcomes remain understudied. This study seeks to clarify the relationships between socioeconomic status (SES), Multiple Autonomy Support Attunement (MASA) and social development in early adolescence, taking into account the concurrent effects of structural (gender and age) and social factors (social networks’ size and orientation). MASA represents the interindividual differences in the perception of autonomy support patterns provided by multiple sources (blind, for review). In other words, an individual may perceive different patterns of multiple autonomy support providers from the same or
different life contexts (family, friends, school, workplace, or community). Some of these patterns may be attuned (where sources provide similar levels of autonomy support) or unattuned (where sources offer different levels of autonomy support).
SES is a measure of one’s social position within a power hierarchy, based on objective indicators including wealth, prestige, or access to resources such as income, professional status, and/or educational level (Diemer, Mistry, Wadsworth, López, & Reimers, 2013; Letourneau, Duffett-Leger, Levac, Watson, & Young-Morris, 2013). Social development refers to the acquisition of social skills that enable children and adolescents to become
members of families, peer groups, communities, or cultures (Killen & Copland, 2011). In this study, social development is classified according to three indicators: social rule-breaking, generally labeled as antisocial behavior (Pitrowoska, Stride, Croft, & Rowe 2015); spontaneous helping intended to benefit others, also known as prosocial behavior (Roth, 2008); and cognitive, emotional, and behavioral management in order to adapt to
environmental demands, defined as self-regulation (Schuithema, Peetsma, & Van der Veen, 2016).
Two rationales underpin the proposed research goal. First, the current literature shows that adolescents of lower SES face greater social development risks, especially a higher chance of being involved in antisocial behavior, compared with those of mid- to higher SES (Piotrowska et al., 2015). The influence of adolescents’ SES on their social development may interact with other factors, including parental mental health, parental practices, and adolescent resilience (Devenish, Hooley, & Mellor, 2017). To date, the impact on the social development outcomes of the relationships between SES and specific forms and patterns of social support, such as autonomy support and MASA, remains unresolved. Second, an understanding of MASA’s role in the transition to adolescence is necessary because multiple autonomy support goes through important changes in early adolescence. During this period, parenting becomes less central as involvement with peers and non-familial adults, such as teachers and natural mentors, increases (Cotterell, 2007; Milyavskaya et al., 2009). These changes can lead to different MASA patterns that may affect social development, across different socioeconomic levels.
SES, underlying theoretical perspectives, and social development
SES effects on social development can be conceptualized along three theoretical lines. The social causation perspective suggests that SES has a direct influence on children’s and adolescents’ social development (Letourneau et al., 2013). The social selection perspective proposes that structural factors, such as gender and age, affect children’s social circumstances (including their SES) and consequently their development and well-being (Conger, Conger, & Martin, 2010). Finally, the interactionist perspective argues that SES effects in adolescence may be direct, interact, or concur with the influence of early SES, children’s structural
attributes (e.g. gender), family processes (e.g. family support), and social factors (e.g. the size of social networks), that will ultimately affect adolescents’ social development as well as their future SES (Conger et al., 2010; Devenish et al., 2017).
This study adheres to an interactionist perspective of SES impact on early adolescents’ social development. It examines the relationship between SES and MASA, as well as its potential interaction, in shaping antisocial behavior, prosocial behavior, and self-regulation, taking into consideration the effects of structural and social factors.
Multiple autonomy support attunement and social development
Social support has been defined as a mix of supportive behaviors involving help, protection, and encouragement (Sarason & Sarason, 2009). It comprises a wide variety of support dimensions (emotional, informational, tangible and instrumental), which some authors (e.g. Ryan & Deci, 2009) have summarized in terms of the satisfaction of basic psychological needs of relatedness, competence, and autonomy.
Autonomy support corresponds to a set of interpersonal attitudes and behaviors that promote the identification and promotion of another’s needs of choice, self-regulation, and motivation (Reeve, 2009). These attitudes and behaviors include providing freedom of choice, offering appropriate (informative) feedback to facilitate decision-making, considering others’ feelings and opinions, and providing opportunities for personal initiative (Ryan & Deci, 2009). Autonomy support allows self-initiated actions and choices, as opposed to control, which is based on the restriction of opportunities and informative feedback (Reeve, 2009).
Multiple autonomy support corresponds to the autonomy support provided by two or more sources, and may be analyzed according to three distinct approaches. The first focuses on the relative influence of each source of autonomy support on an outcome of interest; here, the goal is to understand the effect of each autonomy support provider above and beyond the
influence of other sources (Rueger et al., 2010). The second approach tests how total autonomy support, meaning the total amount of autonomy support provided by all sources, affects a certain result variable. Here autonomy support is measured as the sum of all autonomy providers’ support rates, which can then be used as a predictor of social
development indicators (blind, for review). The third perspective focuses on how patterns of autonomy support, organized in terms of the degree of perceived consistency between multiple autonomy support providers, based on each provider’s autonomy scores, will affect an outcome (Levitt, Levitt, Crooks, Hodgetts, & Milevsky, 2005). This approach, labeled MASA, is based on the concept of attunement as a sense of unity in relationships (Erskine, 1998). This attunement definition is applied to dyadic relationships in contexts such as psychotherapy (Erskine, 1998) and mentoring (Pryce, 2012), and has recently been extended to the social support literature to describe patterns of multiple supportive relationships, irrespectively of the form (perceived or received) or dimension (e.g. autonomy support) of social support. Patterns of autonomy support providers may take one of at least three forms: low-attuned multiple autonomy support involves low levels of support from all sources; unattuned multiple autonomy support occurs when the level of support is unbalanced across different providers; and high-attuned multiple autonomy support occurs when all providers offer high levels of support (blind, for review).
MASA, and all forms of social support attunement, can be seen as perceived patterns of intangible resources for social networks. They correspond to a more attuned or unattuned mobilization of social resources, which in part resemble the definitions of social capital (Bourdieu, 1986). However, there are two main distinctions between support attunement and social capital. First, social capital definitions are often focused on the amount of mobilized social resources, with the exception of some authors (e.g. Coleman, 1990), who allude to the importance of reciprocity or consistency between social support sources. Second, while social
capital denotes the mobilization of the entire range of social resources in a personal social network, support attunement assesses social support patterns involving a group of providers that may be relevant to a certain output.
The exploration of patterns of multiple autonomy support in connection with SES from an interactionist perspective is innovative. To date, the direct influence of each autonomy support provider on social development indicators has been the predominant approach in the literature. From this perspective, greater parental, teacher, and mentoring autonomy support have been linked to lower antisocial behavior (Schwartz et al., 2013; Vansteenkiste et al., 2012), greater prosociality (Roth, 2008; Roth, Kanat-Maymon, & Bibi, 2011), and greater self-regulation (Schuithema et al., 2016; Vansteenkiste et al., 2012) among adolescents. Thus, the links between SES and MASA remain untested.
Age, gender, and social development
In accordance with the interactionist perspective, the influence of SES, MASA and their potential connections in producing social development outcomes must consider the influence of structural factors, such as gender and age.
Antisocial behavior tends to be stronger among boys, according to meta-analytical reviews (Letourneau et al., 2013). Piotrowska et al. (2015) found, however, that connections between SES and antisocial behavior are independent of gender. Prosociality, conversely, tends to be higher among girls. This is credited to social expectations that pressure girls into exhibiting helping behaviors more often, and to their higher standards of moral reasoning (Carlo, McGinley, Zamboanga, & Jarvis, 2010), as well as to boys’ slower pubertal development and lower self-regulatory skills, which make them less able to identify and display helping attitudes (Carlo, Crockett, Wolff, & Beal, 2012). However, prosocial
exhibit public prosocial behaviors (Carlo et al., 2010). Girls also tend to exhibit higher levels of self-regulation in terms of social development and learning (Schunk & Pajares, 2005). However, gender differences in regulation development are shaped by the type of self-regulation involved, the nature of a given task (Kurman, 2004), or culture (von Suchodoletz et al., 2013).
Age tends to have an incremental effect on antisocial behavior (Pitrowoska et al., 2015), but different patterns have been established: some individuals show antisocial behavior during childhood only; for others, social rule-breaking is limited to adolescence, while a more
concerning but rare trajectory of life-persistent antisocial behavior is associated with psychopathology (Briley & Tucker-Drob, 2014). Prosociality seems to be a personal
disposition that is consistent over time (Eisenberg et al., 2011). However, prosocial enactment shows an increase between early childhood and adolescence, stabilizing during early
adulthood (Carlo et al., 2010). Self-regulation also increases until early adolescence, declining during adolescence before stabilizing in adult life (Schunk & Pajares, 2005).
Social networks and social development
According to the interactionist perspective, the connections between SES, MASA, and their potential interactions in producing social development outcomes must also take into account social factors, such as social networks. Social networks can be differentiated according to criteria, such as the size or number of a network’s significant ties/relationships (Sluzki, 2010) or its orientation (i.e. predominant or more recurrent types of significant relationships, whether familial, friendships, or others) (Portugal, 2014).
Social network size and orientation are acknowledged to be significant sources of influence on social development outcomes. Larger adolescent social networks showing a greater diversity of relationships increase the opportunities and the need for prosocial
enactment, as well as the development of abilities, such as self-regulation (Bekkers, Mollenhorst, & Völker, 2005). In turn, adolescent social networks orientated towards friendships have a greater potential to induce antisocial behaviors and lower self-regulation (Milyavskaya et al., 2009), especially when those friendships display deviant tendencies (Cotterell, 2007).
Present study
This study was intended to explore the relationships between SES, MASA and three early adolescence social development indicators: antisocial behavior, prosocial behavior, and self-regulation. This means that potential interactions between SES and MASA, as well as the concurrent effects of structural (gender and age) and social factors (social networks’ size and orientation) were tested, following an interactionist perspective on SES effects on social development. In this study, MASA pertains to patterns of autonomy support regarding the parent seen as being the most involved in behavior regulation; the most important teacher with a similar behavior regulation role; and the natural mentor. The natural mentor was described as an important adult who was neither part of the family, nor a teacher, with whom the participants met frequently (at least once a week) for the 12 months prior to the study. SES was measured in terms of parents’ professional status and educational level.
Four hypotheses were tested: (a) distinct patterns of MASA (attuned/unattuned) would be found among the participants; (b) lower SES would be associated with participants’ higher antisocial behavior and lower prosocial behavior and self-regulation, after accounting for structural and social covariates; (c) MASA, namely, high-attuned multiple autonomy support, would predict lower antisocial behavior, and higher prosociality and self-regulation, after accounting for structural and social covariates; and (d) MASA would moderate the relationship between SES and participants’ social development in terms of antisocial
behavior, prosocial behavior, and self-regulation. Specifically, higher SES would be more strongly related to lower rates of antisocial behavior and higher rates of prosocial behavior and self-regulation in early adolescents reporting high-attuned multiple autonomy support compared with participants reporting low-attuned or unattuned multiple autonomy support.
Method Participants
A cohort of seventh graders from 19 public schools was invited to participate in the study, in a Portuguese intermediate region according to international standards (between 106 and 201 inhabitants by square kilometer) (Organization for Economic Cooperation and
Development, 2011). Six hundred and forty-five adolescents (50.27%) aged 12 to 14 years old (M = 12.30; SD = .60; 55.35% girls) were included, because they provided both the parents’ educational level and professional status and also presented scores for all the significant adults (parent, teacher, and natural mentor). The participants were somewhat evenly distributed by low (n = 149; 23.11%), moderately low (n = 173; 26.82%), moderately high (n = 124; 19.23%), and high SES (n = 199; 30.85%). Their social networks were mostly large (> 18 people) (n = 551; 85.43%) and with a predominant orientation for the family (n = 381; 59.07%) or friendships (n = 182; 28.22%).
Measures
Antisocial behavior.
Antisocial behavior was assessed using the Portuguese version (Fonseca & Monteiro, 1999) of the Antisocial Behavior Subscale of the Youth Self-Report (YSR) (Achenbach & Rescorla, 2004). This subscale includes 15 items covering a wide range of antisocial behaviors, from minor rule breaking such as swearing (sample item: I use bad words or
improper language) to serious violation of social norms, such as stealing (sample item: I steal things at school). Response options range from 0 (not true) to 2 (true most of the time). The reliability score for the original Antisocial Subscale of the YSR is adequate (α = .81), being similar to the reliability of the Portuguese version (α = .76) (Fonseca & Monteiro, 1999). In this study, the reliability score for this subscale was acceptable (α = .72).
Prosocial behavior.
Prosocial behavior was measured using the Portuguese version (Simões & Calheiros, 2016) of the Prosocial Tendencies Measure-Revised (PTM-R) (Carlo, Hausmann,
Christiansen, & Randall, 2003). This questionnaire includes 21 items divided into six subscales. Each subscale depicts a form of prosocial behavior: altruism (four reverse coded items; sample item: “I feel that if I help someone, they should help me in the future”); public (three items; sample item: “I can help others best when people are watching me”); emotional (five items; sample item: “I tend to help others, especially when they are really emotional”); compliance (two items; sample item: “I never wait to help others when they ask for it” ); anonymous (four items; sample item: “I prefer to help others without anyone knowing”), and dire (three items; sample item: “I usually help others when they are very upset”). Response options range from 1 (does not describe me at all) to 5 (describes me greatly). Reliability scores for the original subscales of the PTM-R range from α = .62 (compliance) to α = .84 (emotional) (Carlo et al., 2003), while in the Portuguese version these scores range from a minimally acceptable internal consistency value for dire subscale (α = .67), to an adequate rate for the anonymous subscale (α = .78) (Simões & Calheiros, 2016). In this study, the PTM-R was used as a whole measure of prosociality, showing an adequate reliability score (α = .82).
Self-regulation.
The participants’ self-regulation was assessed using the Portuguese version (Motta, Rijo, Petiz, Souza, & Pereira, in press) of the Abbreviated Dysregulation Inventory (ADI) (Mezzich, Tarter, Giancola, & Kirisci, 2001). This instrument encompasses three subscales: cognitive dysregulation (10 reverse coded items; sample item: “I develop a plan for all my important goals”), affective dysregulation (10 items; sample item: “When I am angry, I lose control over my actions”), and behavioral dysregulation (10 items; sample item: “I get into arguments when people disagree with me”). Ratings range from 0 (never true) to 3 (always true). Higher rates on affective and behavioral dysregulation subscales indicate lower levels of self-regulation. Conversely, higher rates on cognitive dysregulation subscales mean higher rates of cognitive self-regulation. Thus, the behavioral and affective subscales were reverse coded so that higher rates for all subscales could reflect higher self-regulation for the entire scale. Reliability scores for the original subscales of the ADI range from α = .63 (cognitive dysregulation) to α= .85 (affective dysregulation) (Mezzich et al., 2001). Reliability scores for its Portuguese version vary from α = .84 (affective dysregulation) to α = .86 (cognitive
dysregulation) (Motta et al., in press). In this study, this instrument was used as a total measure of self-regulation, with a reliability score of α = .82.
Autonomy support.
MASA was measured using a modified version of the autonomy subscale of the Portuguese version (Sousa, Ribeiro, Palmeira, Teixeira, & Silva, 2012) of the Basic Needs Satisfaction in General Scale (BNSGS) (La Guardia, Ryan, Couchman, & Deci, 2000). The subscale includes five items (sample item: With my father/mother (or teacher or mentor), I feel free to express my feelings). Ratings range from 1 (never) to 5 (always). Items were slightly reworded to enable the participants to assess autonomy support within each of the
accounted relationships. However, the items were identical for all of the assessed
relationships. Lower total rates depict relationship control perceptions, while higher rates indicate autonomy supportive relationship perceptions. Marginally acceptable reliability scores have been found for the Portuguese version (α= .67) (Sousa et al., 2012). In this study, reliability scores were adequate for parental (α= .75), teacher (α= .80), and mentor autonomy support (α= .78).
SES.
SES was assessed using a composite measure of parents’ professional status and educational level. The mother and father’s professional status was classified separately and regrouped in three categories, according to the International Standard Classification of Occupations-08 (International Labour Office, 2012): (a) specialized workers (managers, professionals, and technicians and associate professionals), intermediate workers (clerical support workers, service and sales workers, and plant and machine operators), and non-specialized workers (farmers, fisherman, and elementary occupations). Then, the mother and father’s occupational status was regrouped and recategorized according to four possible situations: 0 = at least one of the parents was unemployed; 1 = at least one of the parents was a non-specialized worker; 2 = at least one of the parents was an intermediate worker; and 3 = at least one of the parents was a specialized worker.
The mother and father’s educational levels were classified separately, according the Portuguese educational certification system. Afterwards, both parents’ educational level was regrouped in four categories and coded as follows: 0 = both parents did not complete middle school (< 9th grade); 1 = at least one of the parents completed middle school (9th grade); 2 = at
least one of the parents completed high school; and 3 = at least one of the parents completed university.
Finally, a new variable was created to aggregate parents’ occupational status and school level into a SES whole measure divided in quartiles (1 = low; 2 = moderately low; 3 =
moderately high; and 4 = high).
Gender and age.
Participants were categorized according to their gender (0 = male; 1 = female), and age (ranging from 12 to 14 years old).
Social network size and orientation.
Social network size and orientation was assessed using the social personal network map (Sluzki 2010). It consists of a graphic representation of individuals’ significant relationships. Each person is invited to list their significant relationships and to represent each of them in one of four different domains: family, friendships, work colleagues/school friends, and within their community, which may include informal relationships with people such as neighbors or with formal representatives from institutions. In this study, the map described the social network’s size (according to the number of relationships represented) and orientation (its largest domain).
Procedures
This study was approved by the Ethics Committee of the University Institute of Lisbon and by the Department of Education of the region where the research took place. Every school in the region was invited to participate. After parental informed consent was obtained, a collective administration of the study’s protocol was conducted by class, in the classroom. Data collection involved explanation of research goals, asking the participants for their
consent to participate, and reading the instructions for each instrument. The participants had 60 minutes to complete the survey.
Data Analyses
After descriptive and correlational analyses, a confirmatory factor analysis (CFA) was conducted to test if autonomy support measures corresponded to different factors and to check factor loadings according to Tabachnick and Fidell (2013) threshold for minimum item
loadings (>.60). The solutions compared were a one-factor, three-correlated factors, and a three non-correlated autonomy support factors.
To categorize the participants regarding MASA, Latent Class Analysis (LCA) was employed. LCA is, originally, a clustering mixture model in which the observed variables are independent categorical variables (Celeux & Govaert, 2016). Recent developments have made it possible to perform LCA easing these assumptions. Latent Gold (version 5.1) is a software to conduct rigorous LCA, with a number of advantages over other software packages: (a) modeling may include ordinal, continuous, and/or nominal variables; (b) local independence assumption between variables is not required to perform LCA in this program; and (c)
exploring patterns of group membership may include all covariates at the same time, contrary to other programs; this means that classification and class membership prediction is
simultaneously conducted in Latent Gold, avoiding prediction and measurement models reestimation (Vermunt, 2010). In this study, LCA involved a three-step approach using the software utilities and recommendations (Vermunt, 2010). First, an LCA model was built based on autonomy support measures. Second, participants were assigned to classes based on their posterior class membership probabilities, meaning that covariates of autonomy support measures identified in the zero-order correlations matrix were included in the process. Fit indices (Bayesian information criteria (BIC), sample-size-adjusted BIC, and entropy statistics)
were compared to identify the model with the best fit. The validation of differences between MASA groups was made through post-hoc mean comparisons tests between social support measures for all regarded sources. Percentiles 25, 50, and 75 were estimated for each source of autonomy support, based on the participants’ original ratings for parent, teacher, and mentor autonomy support, to facilitate class membership interpretation. Ratings > 25%ile indicated low autonomy support; ratings between 25%ile indicated low autonomy support and
49%ile indicated medium-low autonomy support; ratings between 50%ile and 74%ile
indicated medium-high autonomy support; ratings < 75%ile showed high autonomy support. Finally, the association between SES, MASA groups, and outcome variables was investigated. A Generalized Linear Model (GLM) approach, including SES, MASA as factors, as well as their covariates, was employed for each of the outcome variables. The independence between SES and MASA was tested through an omnibus test. A second GLM model was examined, including SES, MAS, and the interaction term between MASA and SES as factors, as well as their covariates, for each of the indicators of social development. All models included model fit and parameter estimates analysis.
Results Descriptive and correlational analysis
SES showed the following distribution: (a) low SES (n = 149; 69.10% cases in which at least one of the parents was a non-specialized worker; 90.60% cases in which neither parent had concluded middle school); (b) medium-low SES (n = 173; 75.14% cases in which at least one of the parents was a non-specialized worker; 52.60% cases in which one of the parents had only concluded middle school); (c) medium high (n = 124; 47.60% cases in which at least one of the parents was an intermediate worker; 50.81% cases in which one of the parents had concluded high school); and (d) high SES (n = 199; 53.27% cases in which at least one of the
parents was a specialized worker; 66.83% cases in which at least one of the parents achieved a university degree).
Percentiles were calculated to depict autonomy support means distribution, with the following results: (a) parental autonomy support (25%ile = 17.00; 50%ile = 20.00; 75%ile = 22.00); (b) teacher (25%ile = 13.00; 50%ile = 17.00; 75%ile = 20.00); and (c) mentor (25%ile = 18.00; 50%ile = 21.00; 75%ile = 23.00).
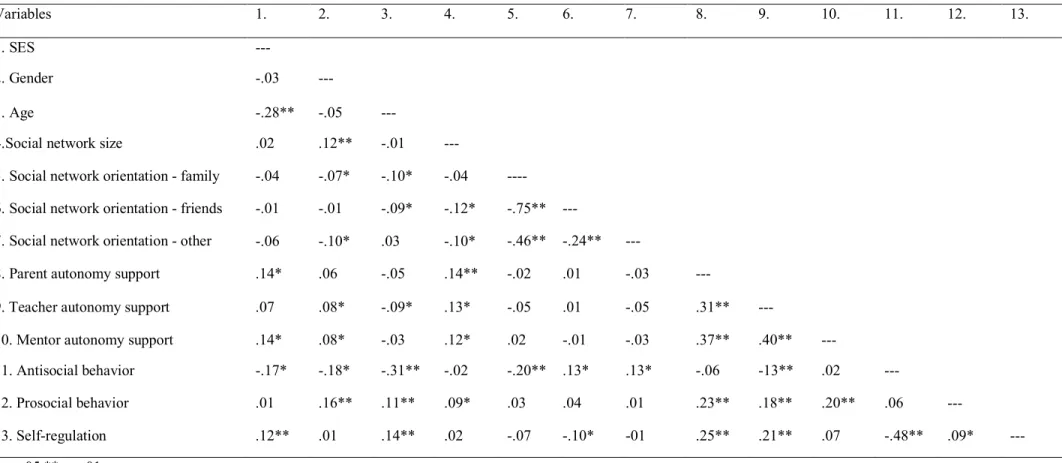
Table 1 depicts the zero-order correlations between the study variables. Parent and mentor autonomy support levels were greater among girls (p <.05); parent autonomy support was also higher among those with a larger social network (p <.01). Teacher autonomy support was greater among boys (p <.05), older participants (p <.05), and participants with a larger social network (p <.05). Mentor autonomy support was associated with greater SES (p <.05), and larger social networks (p <.05). It is also important to notice that autonomy support factors showed medium positive correlations between each other (p <.01) and that the result variables showed several associations with different factors.
[Table 1]
Confirmatory factor analysis
A 3-factor solution with correlated autonomy support factors presented distinct loadings above .60 and demonstrated a better fit, χ2 (87, 558) = 8.34, p < .001, CFI = .87, RMSEA = .063, SRMR = .06, was as well as a better relative fit (AIC = 791.85; ECVI = .97), compared to a 1-factor solution, χ2 (91, 562) = 21.85, p < .001, CFI = .51, RMSEA = .16, SRMR = .14, or a 3-factor solution with uncorrelated autonomy support factors, χ2 (90, 563) = 11.04, p < .001, CFI = .78, RMSEA = .11, SRMR = .16. Relative fix indexes were also lower for a 3-factor solution of correlated autonomy support measures (AIC = 791.85; ECVI = .97),
compared to a 1-factor (AIC = 2156.64, ECVI = 2.64) and 3-factor solution with uncorrelated autonomy factors (AIC = 1053.77; ECVI = 1.290).
Latent class analysis
According to Table 2, a four-class model had the best fit to the data, with a BIC of 10670.72, a sample–size-adjusted BIC of 1442.85, and an entropy score of .67, which was very similar to two- (.68) and three-class solutions (.65) entropy values. Chi-square tests demonstrated that MASA classes differed in terms of age, χ2 (6, 639) = 56.38, p < .001, and network size, χ2 (6, 639) = 47.83, p < .001.
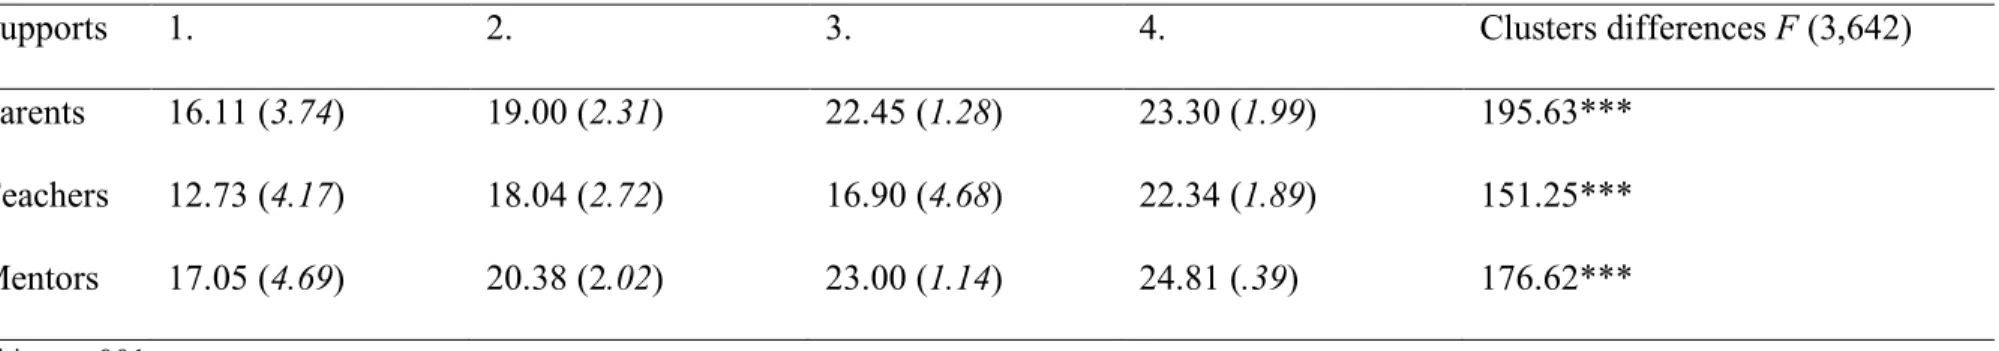
According to Table 3, Class 1 (low-attuned multiple autonomy support) (n = 216; 33.50%) was characterized by youth reports of low autonomy support (<25%ile) from parents (M = 16.11; SD = 3.74), teacher (M = 12.73; SD = 4.17), and mentor (M = 17.05; SD = 4.69); this class showed a higher proportion of participants who were boys (n = 110; 50.90%), aged 12 (63.00%), from a low SES condition (33.30%), with large social networks (95.80%) orientated for the family (57.40%). Class 2 (medium low-attuned multiple autonomy support) (n = 214; 33.20%) was characterized by youth reports of medium-low autonomy support (<50%ile) from parents (M = 19.00; SD = 2.31), teacher (M = 18.04; SD = 2.72), and mentor (M = 20.38; SD = 2.02); this class showed a higher proportion of participants who were girls (56.50%), aged 12 (91.60%), from a high SES condition (36.90%), with large social networks (95.80%) orientated for the family (58.90%). Class 3 (low teacher autonomy support) (n =141; 21.86%) was characterized by youth reports of low teacher autonomy support
(<25%ile) (M = 16.90; SD = 4.68), and high parent (M = 22.45; SD = 1.28), and mentor (M = 23.00; SD = 1.14) autonomy support (<75%ile); this class showed a higher proportion of participants who were girls (57.40%), aged 12 (78.00%), from a high SES condition (39.70%), with large social networks (86.50%) orientated for the family (57.40%). Finally, class 4 (high-attuned multiple autonomy support) (n =74; 11.47%) was characterized by youth reports of high support (>75%ile) from parents (M = 23.30; SD = 1.99) teachers (M = 22.34;
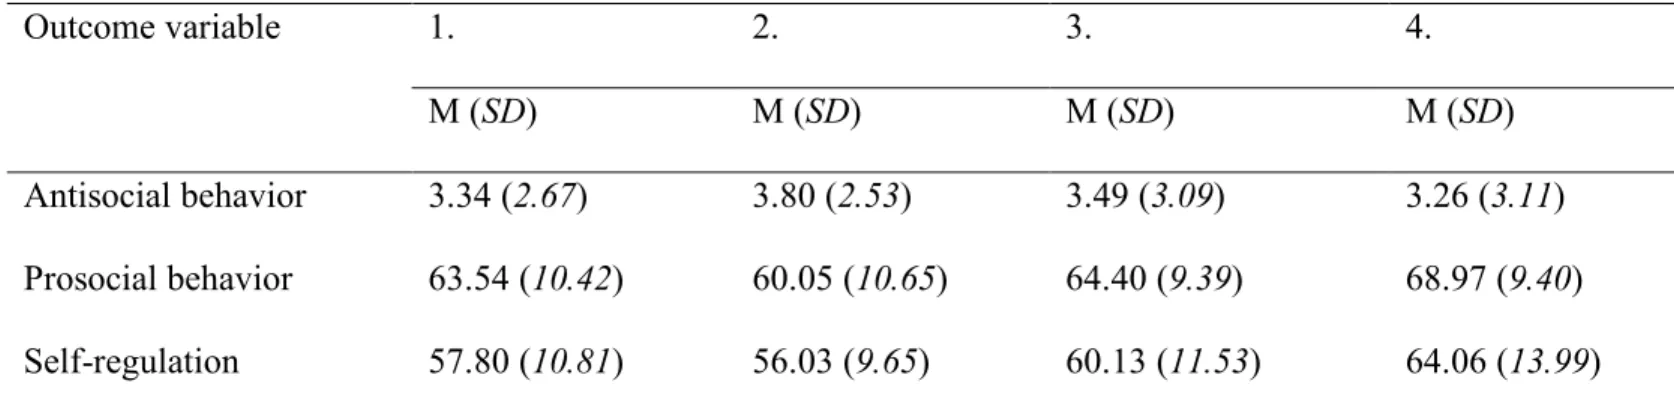
proportion of participants who were girls (66.20%), aged 12 (77.00%), from an intermediate low SES condition (29.70%), with large social networks (89.20%) orientated for the family (67.70%). Table 4 shows that participants reporting high-attuned multiple autonomy support presented lower antisocial behavior average rates and higher prosocial behavior and self-regulation average rates compared to the other MASA classes.
[Tables 2 to 4]
General Linear Models
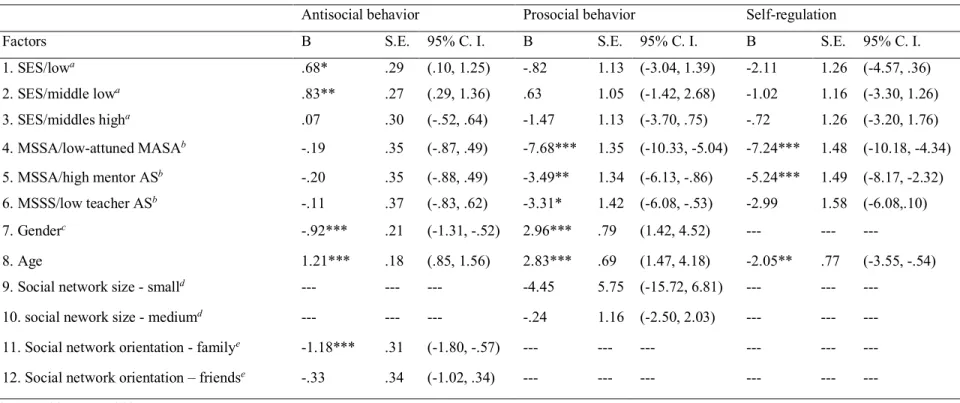
A GLM including SES and MASA as factors, with gender, age, and social network orientation as covariates, revealed a significant model, Pearson χ2 (9, 635) = 6.636, p < .05. The omnibus test of independence between SES and MASA was significant, χ2 (9, 635) = 116.55, p < .000, revealing that SES had a significant association with antisocial behavior (p <. 001), contrary to MASA. Parameter estimates revealed that participants in low (p <.05) and middle low SES categories (p < .01) denoted higher rates of antisocial behavior compared to participants with a high SES. In addition, girls (p < .001), older participants (p <.001), and those with social networks orientated towards the family (p <.001) showed lower antisocial behavior rates.An identical GLM adding the interaction term between SES and MASA as a factor revealed a significant model, Pearson χ2 (18, 626) = 6.641, p < .000. The omnibus test of independence between the different sets of factors was significant, χ2 (18, 626) = 125.28, p < .000, revealing that SES had a significant association with antisocial behavior (p <.05), contrary to MASA or the interaction between SES and MASA.
A GLM including prosocial behavior as an outcome variable, with SES and MASA entering in the model as factors, with gender, age, and social network as covariates, revealed a significant model, Pearson χ2 (9, 635) = 97.98, p < .000. Parameter estimates revealed that participants in low-attuned multiple autonomy support (p <.001), medium-low multiple autonomy support (p < .01), and low-teacher autonomy support (p <.05) denoted lower
prosocial behavior rates compared to participants in a high-attuned condition. In addition, girls (p <.001) and older participants (p <.001) displayed higher prosocial behavior rates. An identical GLM adding the interaction term between SES and MASA as a factor revealed a significant model revealed a significant model, Pearson χ2 (18, 626) = 97.50, p < .000. The omnibus test of independence between the different sets of factors was significant, χ2 (18, 626) = 83.94, p < .000, revealing that MASA had a significant association with prosocial behavior (p <.001), contrary to SES or the interaction term.
A GLM, including self-regulation as an outcome variable, with SES, MASA, and their interaction entering in the model as factors and age as a covariate, revealed a significant model, Pearson χ2 (9, 635) = 121.39, p < .000. Parameter estimates showed that participants in low-attuned multiple autonomy support (p <.001) and medium-low multiple autonomy support (p < .01) denoted lower self-regulation rates compared to participants in a high-attuned condition. In addition, older participants displayed lower self-regulation rates (p <.001).The same GLM adding the interaction term between SES and MASA as a factor revealed a significant model, Pearson χ2 (16, 628) = 121.711, p < .000. The omnibus test of independence between the different sets of factors was also significant, χ2 (16, 628) = 53.63,
p < .000, revealing that MASA had a significant association with prosocial behavior (p
<.001), contrary to SES or the interaction between SES and MASA interaction.
Table 5 presents the unstandardized estimates for the models testing the associations between SES, MASA, and covariates with each of the result variables.
[Table 5]
Discussion
The present study explored four hypotheses focused on the relationships between SES and MASA and their influence on three early adolescence social development indicators,
considering the concurrent effects of gender, age, and social networks’ size and orientation leading to an identical number of findings.
First, a four-class solution combining parent, teacher, and mentor autonomy support was the most accurate and interpretable one. As hypothesized, patterns of attuned and unattuned MASA were found. Three groups elicited similar MASA perceptions across the three support providers (a first class labeled as low-attuned multiple autonomy support, a second class called medium-low attuned multiple autonomy support, and a third one called high-attuned multiple autonomy support). The remaining class displayed an unattuned pattern, as a result of lower teacher autonomy support compared to parents’ and mentors’ autonomy support. The existence of different support patterns in early adolescence has been found in other studies (e.g. Levitt et al., 2005), meaning that MASA may also present different interindividual configurations. Such differentiation is expected, given the changes of social support needs and the developmental task demands taking place during this stage (Cantin & Boivin, 2004). It is important to remark, however, that two thirds of the participants reported low or medium-low autonomy support attunement. This may reflect a general disposition to acknowledge
controlling behavior among significant adults in early adolescence, because of ambivalent feelings regarding these relationships at this stage, or actual controlling behaviors from parents, teachers, and mentors, exerted by critical life situations or the participants’ exposure to unsafe environments (Cotterell, 2007).
Second, lower SES was associated with greater antisocial behavior rates, but not with worst prosocial behavior and self-regulation rates as expected, after controlling for MASA and the influence of potential covariates. Meta-analytical findings support the idea that lower SES is associated with a higher prevalence of antisocial behavior (Letourneau et al., 2013). Risks such as greater exposure to family/community violence, harsh or inconsistent parenting (Diemer et al., 2017), greater predisposition for association with deviant peers (Milyavskaya
et al., 2009), or early discrimination in schooling (Cotterell, 2007) are common among groups with a lower SES, contributing for a greater probability of socially and economically
disadvantaged youths developing deviant behaviors.
Third, high-attuned multiple autonomy support denoted a significant relationship with an improvement of positive social development indicators, compared to conditions of low or unattuned multiple autonomy support. The connection between an optimal autonomy support pattern and better prosociality and self-regulation prospects in this study extends previous findings, showing that patterns of consistently high support across significant adults
contribute to the well-being and social development of youths (Levitt et al. 2005). Autonomy support configurations in early adolescence are expected to change significantly compared to the patterns established in early and late childhood. The diversification of autonomy support sources, greater openness to the influence of non-familial adults, and lesser parental centrality in social behavior regulation may lead to low or unbalanced autonomy support (Cotterell, 2007), with implications for adolescents’ social development. Consequently, this finding stresses the need to consider MASA’s role in the context of early adolescence social network and social support changes, because autonomy support patterns connections with positive social development are independent of SES effects.
Finally, SES and MASA interactions were not significant, as expected. However, both factors covaried with structural and/or social factors in their relations with social development indicators. Compared with younger adolescents, older adolescents exhibit higher antisocial behavior rates (Piotrowska et al., 2015) and higher prosociality (Eisenberg et al., 2011), as well as lower self-regulation that tends to decline early in adolescence (Schunk & Pajares, 2005). In addition, girls displayed lower antisocial behavior and higher prosocial rates, which again is in line with previous findings (Carlo et al., 2010; Letourneau et al., 2013). Taken together, these results uphold that social development is a complex process, which is
consistent with an interactionist perspective on SES influence on personal and social development (Conger et al., 2010).
Implications and limitations
This study stresses that youths from lower SES are in greater danger of developing antisocial behavior. Thus, the need to mobilize social and economic resources, through policies and programmed interventions is warranted to prevent behavioral deviance risks in early adolescents. This research also underlines the role of optimal, high-attuned multiple autonomy support in improving positive social development, across all SES ranks. Although the quality of support has been shown to buffer the effects of risk on the lives of more vulnerable youths, multiple-sourced support, and particular optimal MASA may need to be better integrated by professionals as a requirement to improve opportunities for youths’ positive development, irrespectively of SES. This may be particularly relevant for those working in community settings or using (multi)systemic therapeutic approaches, which are often challenged by the need to adjust the efforts of different sources of support.
From a research standpoint, the relationship patterns between SES and MASA study should be tested from a longitudinal perspective. New research approaches that analyze the links between SES and MASA involving friendships, or use specific indicators of
rule-breaking, such as aggression or substance-use, are also recommended. Qualitative approaches that can determine the key factors leading to multiple low-attuned or medium low-attuned perceptions may also be valuable in helping to reveal why these classes are so large.
The study has a number of limitations. SES was assessed using a composite measure of parents’ (or legal guardians’) professional status and educational level. Others have
recommended that the (in)direct effects of SES factors should be assessed separately (Diemer et al., 2013). However, given the strong correlation between professional status and school
level, this recommendation seems less relevant here. Finally, this study was based exclusively on participants’ self-reported perceptions of autonomy support and behavior. Although adolescents have been found to be consistent sources of information about parental practices and their own behavior, reliance on a single source may be a pertinent cause of bias.
Conclusion
This study shows that lower SES is associated with greater antisocial behavior among early adolescents. In turn, MASA is linked to improved positive social development
prospects, when youths report high-attuned multiple autonomy support. MASA does not moderate SES effects on social development indicators as expected. However, in accordance with an interactionist standpoint, SES association with social development is a complex process, in which structural and social factors play a significant concurrent contribution.
References
Achenbach, T. M., & Rescorla, L. A. (2004). The Achenbach system of empirically based
Assessment (ASEBA) for ages 1.5 to 18 Years. The use of psychological testing for treatment planning and outcomes assessment. Volume 2: Instruments for children and
adolescents (3rd Ed.). Retrieved from
http://ovidsp.ovid.com/ovidweb.cgi?T=JS&PAGE=reference&D=psyc4&NEWS=N&A N=2004-14949-007
Bekkers, R., Mollenhorst, & G. Völker, B. (2005). Social networks and prosocial behavior. Marktdag Sociologie, Marktdag Sociologie, Free University Brussels, 2.
Briley, D. A., & Tucker-Drob, E. M. (2014). Genetic and environmental continuity in personality development: A meta-analysis. Psychological Bulletin, 140(5), 1303–1331. http://doi.org/10.1037/a0037091
Bourdieu. P. (1986). The forms of capital. In J. Richardson (Ed.). Handbook of theory and
research for the sociology of education (pp. 241-258). Westport, CT: Greenword.
Camara, M., Bacigalupe, G., & Padilla, P. (2014). The role of social support in adolescents: Are you helping me or stressing me out? International Journal of Adolescence and
Youth, 18(1), 1–14.
Cantin, S., & Boivin, M. (2004). Change and stability in early adolescents’ social networks and self-perception during transition from elementary to junior high school.
International Journal of Behavioral Development, 28(6), 561-570.
Carlo G., Crockett L. J., Wolff J. M., & Beal S. J. (2012). The role of emotional reactivity, self-regulation, and puberty in adolescents’ prosocial behaviors. Social Development,
21, 667–685. http://doi.org/10.1111/j.1467-9507.2012.00660.x
Carlo G., Knight G. P., McGinley M., Zamboanga B. L., & Jarvis L. H. (2010). The multidimensionality of prosocial behaviors and evidence of measurement equivalence
in Mexican American and European American early adolescents: Multidimensional prosocial behaviors. Journal of Research on Adolescence, 20, 334–358.
http://doi.org/10.1111/j.1532-7795.2010.00637.x
Celeux, G. & Govaert, G. (2016.) Latent class models for categorical data. In C. Hennig, M. Meila, F. Murtagh, & R. Rocci (Eds). The handbook of cluster analysis. New York: Taylor and Francis Group.
Coleman, J. S. (1990). Foundations of social theory. Harvard: Harvard University Press. Conger, R. D., Conger, K. J., & Martin, M. J. (2010). Socioeconomic status, family
processes, and individual development. Journal of Marriage and Family. http://doi.org/10.1111/j.1741-3737.2010.00725.x
Cotterell, J. (2007). Social networks in youth and adolescence. New York: Routledge. Devenish, B., Hooley, M., & Mellor, D. (2017). The pathways between socioeconomic
status and adolescent outcomes: A systematic review. American Journal of Community
Psychology.
Diemer M. A., Mistry, R. S., Wadsworth, M. E., López, I., & Reimers, F. (2013). Best practices in conceptualizing and measuring social class in psychological research.
Analyses of Social Issues and Social Policy, 13 (1), 77-113.
Eisenberg N., Guthrie I. K., Murphy B. C., Shepard S. A., Cumberland A., & Carlo G. (2011). Consistency and development of prosocial dispositions: A longitudinal study. In M. Killen & R. J. Coplan (Eds.), Social development in childhood and adolescence. (pp. 218–232). Oxford, UK: Wiley-Blackwell.
Erskine, R. (1998). Attunement and involvement: Therapeutic responses to relational needs.
Evans, G. W., & Kim, P. (2013). Childhood poverty, chronic stress, self-regulation, and coping. Child Development Perspectives, 7(1), 43–48.
http://doi.org/10.1111/cdep.12013
Fonseca, A. C., Monteiro, C.M., (1999). Um inventário de problemas de comportamento para crianças e adolescentes: o Youth Self-Report de Achenbach (YSR) [An inventory of children and youth behavior problems: Achenbach’s Youth Self-Report].
Psychologica, 21, 79-96.
International Labour Office (2012). International standard classification of occupations:
Structure, group definitions, and correspondence tables. Geneva: International Labour
Office.
Killen, M., & Coplan, R. J. (2011). Social development: Concepts, theory, and overview. In M. Killen & R. J. Coplan (Eds.), Social development in childhood and adolescence. (pp. 3–11). Oxford, UK: Wiley-Blackwell.
Kurman J. (2004). Gender, self-enhancement, and self-regulation of learning behaviors in junior high school. Sex Roles, 50, 725–735. http://dx.doi.org/10.1023/B:SERS. 0000027573.36376.69
La Guardia, J. L., Ryan, R. M., Couchman, C. E., & Deci, E. L. (2000). Within-person variation in security of attachment: A self-determination theory perspective on attachment, need fulfillment, and well-being. Journal of Personality and Social
Psychology, 79(3), 367–384. http://doi.org/10.1037//0022-3514.79.3367
Letourneau, N.L., Duffet-Leger, L., Levac, L., Watson, B., & Young-Morris, C. (2013). Socioeconomic status and child development: A meta-analysis. Journal of Emotional
and Behavioral Disorders, 21(3), 211–224.
Mezzich, A. C., Tarter, R. E., Giancola, P. R., & Kirisci, L. (2001). The dysregulation inventory: A new scale to assess the risk for substance use disorder. Journal of Child &
Adolescent Substance Abuse, 10(4), 35–43
Milyavskaya, M., Gingras, I., Mageau, G., Koestner, R., Gagnon, H., Fang, J., & Fourier, J. (2009). Balance across contexts: Importance of balanced need satisfaction across various life domains. Personality and Social Psychology Bulletin, 35(8), 1031–1045. http://doi.org/10.1177/0146167209337036
Motta, C., Rijo, D., Petiz, M., Souza, B & Pereira, M. (in press). The abbreviated
dysregulation inventory: Dimensionality and psychometric properties for Portuguese adolescents.
Piff, P. K., Kraus, M. W., Côté, S., Cheng, B. H., & Keltner, D. (2010). Having less, giving more: The influence of social class on prosocial behavior. Journal of Personality and
Social Psychology, 99(5), 771–784. http://doi.org/10.1037/a0020092
Piotrowska, P. J., Stride, C. B., Croft, S. E., & Rowe, R. (2015). Socioeconomic status and antisocial behaviour among children and adolescents: A systematic review and meta-analysis. Clinical Psychology Review, 45, 37-55.
http://doi.org/10.1016/j.cpr.2014.11.003
Portugal, S. (2014). Famílias e redes sociais: Ligações fortes na produção de bem-estar. Coimbra: Almedina [Families and social networks: Strong ties on welfare production]. Pryce, J. (2012). Mentor attunement: An approach to successful school-based mentoring
relationships. Child and Adolescent Social Work Journal, 29(4), 285–305. http://doi.org/10.1007/s10560-012-0260-6
Reeve, J. (2009). Why teachers adopt a controlling motivating style toward students and how they can become more autonomy supportive. Educational Psychologist, 44(3), 159–175. http://doi.org/10.1080/00461520903028990
Roth, G. (2008). Perceived parental conditional regard and autonomy support as predictors of young adults’ self- versus other-oriented prosocial tendencies. Journal of Personality,
76(3), 513–534. http://doi.org/10.1111/j.1467-6494.2008.00494.x
Roth, G., Kanat-Maymon, Y, & Bibi, U. (2011). Prevention of school bullying: The
important role of autonomy-supportive teaching and internalization of prosocial values.
British Journal of Educational Psychology, 81(4), 654-666.
Rueger, S. Y., Malecki, C. K., & Demaray, M. K. (2010). Relationship between multiple sources of perceived social support and psychological and academic adjustment in early adolescence: Comparisons across gender. Journal of Youth and Adolescence, 39(1), 47– 61. http://doi.org/10.1007/s10964-008-9368-6
Ryan, R. M., & Deci, E. L. (2009). Promoting self-determined school engagement: Motivation, learning, and well-being. In K. R. Wentzel, & A. Wigfield (Eds.), Handbook on motivation at school (pp. 171–196). New York: Routledge.
Sarason, I. G., & Sarason, B. R. (2009). Social support: Mapping the construct. Journal of
Social and Personal Relationships, 26(1), 113–120.
http://doi.org/10.1177/0265407509105526
Schuitema, J., Peetsma, T., & van der Veen, I. (2016). Longitudinal relations between perceived autonomy and social support from teachers and students’ self-regulated learning and achievement. Learning and Individual Differences, 49, 32–45. http://doi.org/10.1016/j.lindif.2016.05.006
Schunk D. H., & Pajares F. (2005). Competence perceptions and academic functioning. In A. J. Elliot & C. S. Dweck (Eds.), Handbook of competence and motivation (pp. 85– 104). New York, NY: Guilford Press.
Schwartz, S. E. O., Rhodes, J. E., Spencer, R., & Grossman, J. B. (2013). Youth initiated mentoring: Investigating a new approach to working with vulnerable adolescents.
American Journal of Community Psychology, 52(2), 151-159.
Simões, F. & Calheiros, M. M. (2016). The relations between prosocial behaviors and self-regulation: Evidences from the validation of the PTM-R for Portuguese early
adolescents, Journal of Spanish Psychology, 19, 1-14. http://dx.doi.org/10.1017/sjp.2016.70.
Sluzki, C. E. (2010). Personal social networks and health: conceptual and clinical implications of their reciprocal impact. Family, Systems and Health, 28(1), 1–18. American Psychological Association, DOI: 10.1037/a0019061
Sousa, S. S., Pais Ribeiro, J. L., Palmeira, A. L., Teixeira, P. J., & Silva, M. N. (2012). Estudo da Basic Satisfaction in General Scale para a língua portuguesa [Validation study of basic psychological needs in general scale for the Portuguese language].
Psicologia, Saúde & Doenças, 13(2), 209-219.
Tabachnick, B. G. & Fidell, L. S. (2013). Using multivariate statistics (6th edition). Los
Angeles. Pearson Education Inc..
Vansteenkiste, M., Sierens, E., Goossens, L., Soenens, B., Dochy, F., Mouratidis, A., Aelterman, A., Haerens, L., & Beyers, W. (2012). Identifying configurations of perceived teacher autonomy support and structure: Associations with self-regulated learning, motivation and problem behavior. Learning and Instruction, 22(6), 431–439. http://doi.org/10.1016/j.learninstruc.2012.04.002
von Suchodoletz A., Gestsdottir S., Wanless S. B., McClelland M. M., Birgisdottir F., Gunzenhauser C., & Ragnarsdottir H. (2013). Behavioral self-regulation and relations to emergent academic skills among children in Germany and Iceland. Early Childhood
Vemunt, J. K. (2010). Latent class modeling with covariates: Two improved three-step approaches. Political Analysis, 18(4), 450-469.
Table 1. Zero-order correlations between study variables
Variables 1. 2. 3. 4. 5. 6. 7. 8. 9. 10. 11. 12. 13.
1. SES ---
2. Gender -.03 ---
3. Age -.28** -.05 ---
4.Social network size .02 .12** -.01 ---
5. Social network orientation - family -.04 -.07* -.10* -.04 ----
6. Social network orientation - friends -.01 -.01 -.09* -.12* -.75** ---
7. Social network orientation - other -.06 -.10* .03 -.10* -.46** -.24** ---
8. Parent autonomy support .14* .06 -.05 .14** -.02 .01 -.03 ---
9. Teacher autonomy support .07 .08* -.09* .13* -.05 .01 -.05 .31** ---
10. Mentor autonomy support .14* .08* -.03 .12* .02 -.01 -.03 .37** .40** ---
11. Antisocial behavior -.17* -.18* -.31** -.02 -.20** .13* .13* -.06 -13** .02 ---
12. Prosocial behavior .01 .16** .11** .09* .03 .04 .01 .23** .18** .20** .06
---13. Self-regulation .12** .01 .14** .02 -.07 -.10* -01 .25** .21** .07 -.48** .09*
Table 2. Fit indices for one-, two-, three- and four-latent class solutions for latent class analysis
Fit indices One class Two classes Three classes Four classes
BIC 11051.76 10711.78 10674.52 10670.78
Sample-size adjusted BIC 11024.94 10617.92 10513.62 10442.85
Entropy .68 .65 .66
Note: BIC – Bayesian Information Criteria
Table 3. Means (and standardized errors) for autonomy support variables for the four-clusters latent class analysis solution
Supports 1. 2. 3. 4. Clusters differences F (3,642)
Parents 16.11 (3.74) 19.00 (2.31) 22.45 (1.28) 23.30 (1.99) 195.63*** Teachers 12.73 (4.17) 18.04 (2.72) 16.90 (4.68) 22.34 (1.89) 151.25*** Mentors 17.05 (4.69) 20.38 (2.02) 23.00 (1.14) 24.81 (.39) 176.62***
*** p < .001
1.Low-attuned multiple autonomy support; 2. Medium-low attuned multiple autonomy support; 3. Low teacher autonomy support; 4. High-attuned multiple autonomy support.
Table 4. Means and standard deviations for each cluster of multiple social support attunement Outcome variable 1. 2. 3. 4. M (SD) M (SD) M (SD) M (SD) Antisocial behavior 3.34 (2.67) 3.80 (2.53) 3.49 (3.09) 3.26 (3.11) Prosocial behavior 63.54 (10.42) 60.05 (10.65) 64.40 (9.39) 68.97 (9.40) Self-regulation 57.80 (10.81) 56.03 (9.65) 60.13 (11.53) 64.06 (13.99) 1.Low-attuned multiple autonomy support; 2. Medium-low attuned multiple autonomy support; 3. Low teacher autonomy support; 4. High-attuned multiple autonomy support.
Table 5. Unstandardized parameter estimates of the associations of SES and MASA with social development indicators including covariates
Antisocial behavior Prosocial behavior Self-regulation
Factors B S.E. 95% C. I. B S.E. 95% C. I. B S.E. 95% C. I.
1. SES/lowa .68* .29 (.10, 1.25) -.82 1.13 (-3.04, 1.39) -2.11 1.26 (-4.57, .36) 2. SES/middle lowa .83** .27 (.29, 1.36) .63 1.05 (-1.42, 2.68) -1.02 1.16 (-3.30, 1.26) 3. SES/middles higha .07 .30 (-.52, .64) -1.47 1.13 (-3.70, .75) -.72 1.26 (-3.20, 1.76) 4. MSSA/low-attuned MASAb -.19 .35 (-.87, .49) -7.68*** 1.35 (-10.33, -5.04) -7.24*** 1.48 (-10.18, -4.34) 5. MSSA/high mentor ASb -.20 .35 (-.88, .49) -3.49** 1.34 (-6.13, -.86) -5.24*** 1.49 (-8.17, -2.32) 6. MSSS/low teacher ASb -.11 .37 (-.83, .62) -3.31* 1.42 (-6.08, -.53) -2.99 1.58 (-6.08,.10) 7. Genderc -.92*** .21 (-1.31, -.52) 2.96*** .79 (1.42, 4.52) --- --- ---8. Age 1.21*** .18 (.85, 1.56) 2.83*** .69 (1.47, 4.18) -2.05** .77 (-3.55, -.54)
9. Social network size - smalld --- --- --- -4.45 5.75 (-15.72, 6.81) --- ---
---10. social nework size - mediumd --- --- --- -.24 1.16 (-2.50, 2.03) --- ---
---11. Social network orientation - familye -1.18*** .31 (-1.80, -.57) --- --- --- --- ---
---12. Social network orientation – friendse -.33 .34 (-1.02, .34) --- --- --- --- ---
*p <.05 ** p <.01; ***p <.001