Revista Brasileira de
Engenharia Agrícola e Ambiental
Campina Grande, PB, UAEA/UFCG – http://www.agriambi.com.br
v.21, n.7, p.499-504, 2017
Water seasonality in granting permits and impact of irrigation
in the Dourados River basin, MS, Brazil
Diovany D. Ramos
1, Silvio B. Pereira
2, Fabiane K. Arai
3, Felipe A. dos Santos
4& Thiago de O. Carnevali
5 DOI: http://dx.doi.org/10.1590/1807-1929/agriambi.v21n7p499-504A B S T R A C T
The objective of this study was to evaluate water seasonality in the process of granting permits and the impact of irrigation in the Dourados River basin. For that, the hydrological
behavior of the basin was analyzed. The minimal streamflows (Q7,10 and Q95), irrigation
withdrawal flow (Qr) and the percent variation of the grant flows relative to monthly seasonal period in relation to the monthly withdrawal flow were obtained. The results allowed to verify that using criteria based on the monthly streamflow allows for better management of water use, because it allows for greater utilization of this resource in times with high water availability and imposes a realistic restriction during critical periods. The average annual water withdrawal for irrigation in the basin during the studied period was on the order of 2.99 m3 s-1, and the withdrawal flow in the month of highest demand (August) was 5.95 m3 s-1.
Sazonalidade hídrica na concessão de outorga e impacto
da irrigação na Bacia do Rio Dourados, MS, Brasil
R E S U M O
O objetivo deste trabalho foi avaliar a sazonalidade hídrica no processo de concessão de outorga e o impacto da irrigação na Bacia do Rio Dourados. Para tanto, procedeu-se à análise do comportamento hidrológico na bacia. Foram obtidas as vazões mínimas de referência (Q7,10 e Q95), vazões de retirada pela irrigação (Qr), e variação percentual das vazões de outorga relativo ao período sazonal mensal em relação à vazão de retirada mensal. Os resultados permitiram constatar que a concessão de outorga de uso dos recursos hídricos quando adotada a escala mensal garante um plano melhor de utilização da água, à medida que permite seu uso no período em que há disponibilidade hídrica e restringe no período de escassez hídrica. A vazão média anual de retirada pela irrigação na bacia no período em
estudo, foi da ordem de 2,99 m3 s-1, sendo a vazão de retirada no mês de maior demanda
(agosto) de 5,95 m3 s-1. Key words:
water resources hydrological behavior water management
Palavras-chave:
recursos hídricos
comportamento hidrológico gestão da água
1 Universidade Federal do Mato Grosso do Sul/Faculdade de Educação. Campo Grande, MS. E-mail: diovany3@hotmail.com (Corresponding author) 2 Universidade Federal de Viçosa/Departamento de Engenharia Agrícola. Viçosa, MG. E-mail: silviopereira@ufv.br
3 Universidade Federal da Grande Dourados/Faculdade de Ciências Agrárias. Dourados, MS. E-mail: fabiane.kazue.arai@gmail.com 4 Universidade Estadual Paulista/Faculdade de Ciências e Engenharia. Tupã, SP. E-mail: feandresantos@gmail.com
5 Universidade Federal do Pará/Faculdade de Engenharia Agronômica. Altamira, PA. E-mail: thiagocarnevali@live.com
Introduction
The last decades have been characterized by a substantial increase in the water demand for various purposes. The competition between users has increased due to population growth, alteration in spatial and temporal water availability, variations of the natural conditions and deterioration of water quality (Alves et al., 2009; Wang & Huang, 2011).
The natural water availability in a water basin is represented by the average and minimum streamflows, and knowing them is of great importance for an adequate planning of usage and shared management of the water resources (Novaes et al., 2009). Precise streamflow estimates are, therefore, essential for adequate planning and management of the water resources (Pruski et al., 2007; Li et al., 2010; Masih et al., 2010; Arai et al., 2012).
The minimum streamflows Q7,10 and Q95 have been used to
define the limit of authorization of water use by water resources management policies (Brodie et al., 2008). Q7,10 is based on the historical series of average minimum flows with 7 days of duration and return period of 10 years, while Q95 utilizes
values of the permanence curve to establish reference flows on a daily, monthly or annual basis (Belico et al., 2013). The minimum reference flows estimated were the minimum flows of seven days of duration and return period of 10 years (Q7,10) and the minimum flow associated with 95% of permanence in time (Q95). These criteria are widely used by the National
Water Agency of Brazil (ANA).
The Dourados River basin is located in the sub-basin of the Ivinhema River, which in turn is inserted in the Paraná River basin. The region has great potential for agricultural development and, with the increase in irrigated agriculture, according to the Food and Agriculture Organization, irrigated agriculture must increase by up to 30% until 2030 (Bof et al., 2013). In this context, the knowledge on the hydrological characteristics and the demand for water resources by irrigation in the Dourados River basin are of great importance. Thus, this study aimed to evaluate water seasonality in the process of granting permits and the impact of irrigation in the Dourados River basin.
Material and Methods
The Dourados River basin is located between the geographic coordinates 21º 56’ S - 22º 38’ S and 53º 59’ W - 55º 57’ W, and occupies an area of approximately 9,240 km2. The climate of
the region, according to Köppen’s classification, is Aw (Peel et al., 2007) with annual means for rainfall and temperature of 1,425 mm and 23.6 ºC, respectively.
The study analyzed the data from the fluviometric stations of Dourados (64609000) and Porto Wilma (64610000), both belonging to the ANA network and situated in the Dourados River, with drainage areas of 5,817 and 9,059 km2, respectively.
For that, data whose years showed more than 95% of the data encompassing the period from 1973 to 2007 were analyzed. The drainage areas were obtained through the digital elevation model generated in the GIS. For the Porto Wilma station, the drainage area represents 98.4% of the basin, thus reflecting its behavior.
To estimate the annual and monthly series of minimum flows with seven days of duration (Q7), for each station, the following Log-Normal probability distribution functions with two and three parameters were analyzed: Pearson III, Log-Pearson III and Weibull. The probability distribution adjustable to each historical series was selected using the Kolmogorov-Smirnov test, at 0.2 probability level, and the parameters of each distribution were fitted through the moments method. After selecting the probabilistic distribution with best fit, the values of Q7,10 were obtained. In the calculation of the Q7,10 for the utilized seasonal periods, Q7 events were obtained by
restricting the data set only to the seasonal period in question. These flows were calculated using the program SisCAH 1.0 (Sousa et al., 2009).
Q95 was obtained from the permanence curve of each
fluviometric station based on daily data, representing the time interval in which certain flow is equaled or exceeded during the analyzed period. For that, the data series were organized in decreasing order and the frequency associated with each flow value was determined using Eq. 1.
f N
NT
i qi
= 100
where:
Nqi - number of events higher than or equal to the flow
of order i; and,
NT -total number of data of the sample.
SisCAH 1.0 was used to obtain Q95 on monthly and annual
scales for each historical series, according to the described methodology. Permanence curves on monthly basis were determined using the same procedure for the annual estimate, but restricting the data set to the monthly scale.
The estimates of minimum reference flows were used to compare the flows of the monthly periods with those of the annual period. This comparison verified the relative difference of the water availability in the flow available for granting, considering the adoption of the minimum reference flows of the monthly scales adopted with the annual period, according to Eq. 2.
Dr Q Q
Q
seasonal annual
annual
= − 100
where:
Dr - relative difference of water availability, %;
Qseasonal- streamflow estimated on monthly basis, m3 s-1; and,
Qannual- streamflow estimated on annual basis, m3 s-1.
For both fluviometric stations used in the study, Q7,10
and Q95 values on monthly and annual basis were compared, along with the criteria: 50% Q7,10, 50% Q95, 70% Q7,10 and 70% Q95, on the different temporal scales analyzed. The monthly
behavior of the estimates and the magnitude of the grantable flow according to the temporal scale were analyzed, comparing them with the annual flows.
(1)
The relative difference between the criteria of maximum allowable flows for permits on annual and monthly basis, based on the volume, was calculated according to Eq. 3 (Bof, 2010).
The value adopted for Ea in the central pivot irrigations was 0.78, considered as the mean value of twelve evaluations of central pivot irrigation systems located in the basin. Effective precipitation was obtained by the method proposed by the FAO bulletin nº 24 (Doorenbos & Pruitt, 1977).
It was considered that the crop would not be irrigated if the effective precipitation were higher than the actual evapotranspiration of the crop, while the losses through percolation and runoff were estimated by Eq. 6.
Dr V V
V
criterion
Q Q
Q
= 70 95− 50 7 10 50 7 10
100
% % .
% .
where:
Drcriterion- relative difference between the criteria, %;
V70%Q95 - maximum water volume allowable for permits,
ANA criterion, m3 year-1; and,
V50%Q7,10 - maximum water volume allowable for permits due to the adoption of the criterion of 50% Q7,10, m
3 year-1.
To calculate the maximum water volume allowable for permits, the value of the grant flow was multiplied by the number of seconds in one year, to obtain the water volume that flows during one year. For the criterion of monthly grant, the mean value of the monthly grant flows was multiplied by the number of seconds in one month.
The difference of maximum volume allowable for permits (Bof, 2010) in the change from annual to monthly basis was also analyzed, expressed by Eq. 4.
Dr V V
V b
monthly annual
annual
= − 100
where:
Drb - relative difference between the monthly criterion and annual criterion, %.
The withdrawal flows to quantify the flow required by irrigation was obtained according to the methodology of Pruski et al. (2007), estimated based on the required irrigation and on the irrigated area of the basin for each crop in each month (Eq. 5).
Qr ETc Pe
Ea Ai Pp
= −
(
−)
∑
86400 10 Prnfwhere:
Qr - flow withdrawal for irrigation, m3 s-1;
ETc - crop evapotranspiration, mm d-1;
Pe - effective precipitation, mm d-1;
Ea - efficiency of application, dimensionless; Ai - irrigated area, ha;
Pp - losses through percolation, dimensionless; and, Prnf - losses through runoff, dimensionless.
For that, sprinkler irrigation, the most frequently used method, was associated with the central pivot. The evapotranspiration of each crop was estimated based on the evapotranspiration of the reference crop, calculated by the Penman-Monteith method, in the coefficients of the crop (Kc)
and of soil moisture (Ks). Considering the results obtained by Ramos & Pruski (2003) in studies on the quantification and analysis of water use efficiency in the agricultural sector in the São Francisco River basin, values of 0.90 were adopted for Ks.
Pp−Prnf= −1 Pevp Ea−
where:
Pevp - losses through evaporation and drift, dimensionless.
For central pivot irrigation systems, a value of 6.10% was adopted for the losses through evaporation and drift, a mean value from the twelve evaluations performed in the basin.
Results and Discussion
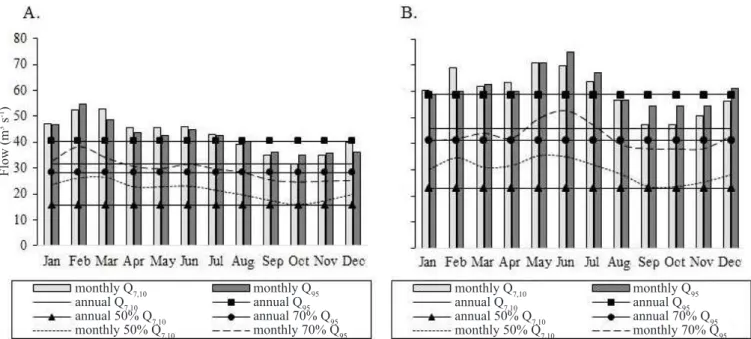
The results showed that the Dourados station has higher seasonal flows in February and March (Figure 1A.), while the Porto Wilma station has higher seasonal flows in May and June (Figure 1B.).
The minimum reference flows for granting permits exhibit expressive differences (Figure 1A and 1B.). Annual Q95 was, on average, 28.59% higher in relation to the annual Q7,10.
Considering the projections of the use of different criteria of maximum flows allowable for granting permits in both stations, there was a variation up to 33.1% higher in the comparison of the criteria of 50% monthly Q7,10 in relation to 50% annual Q7,10, and 4.54% higher in the comparison of the criteria of 70%
monthly Q95 in relation to 70% annual Q95. The use of annual Q7,10 tends to be restrictive during the entire year, because it
limits the flow allowable for granting to a restriction evidenced in a specific period.
For the evaluated stations, the criterion corresponding to the permit granting of 70% annual Q95, compared with the monthly criteria, has the characteristic of being very allowable in months with low water availability (September, October and November), risk of occurrence of complete drought of the river, and highly restrictive in the months with greater water availability (Figures 1A and 1B).
Analyzing the months of September, October and November, which correspond to the most critical period regarding water availability, the values of 70% annual Q95
become close to those of monthly Q7,10, but with the utilization of the criterion of 70% monthly Q95 this risk decreases.
Therefore, the utilization of the criterion based on monthly flows potentiates a better plan of water usage, as it allows greater use of water in the period in which there is availability and imposes a more realistic restriction in the critical period of water availability. Silva et al. (2011) claim that the seasonality in the permit granting process becomes increasingly essential in basins with high growth rates and potential conflict between users.
Considering the permit granting criterion of 50% annual Q7,10, it is observed that this criterion limits the use of water (3)
(4)
(5)
resources during the entire year, in periods of both high and low water availability. The change to the criterion of 50% monthly Q7,10 allows to provide greater grant flows in periods
with water surplus and lower values in months with lower water availability (Figures 1A and 1B.).
The analysis of the criteria of 70% annual Q95 and 70%
monthly Q95 has the same behavior of the projection of use
of the criterion of 50% annual and monthly Q7,10, with the difference that the allowable flows are grantable and higher, because Q95 is a flow with higher probability of occurrence compared with Q7,10.
In addition, considering that the water volume allowable for granting is represented by the area under the curve (or line) relative to the adopted grant criterion, in the Porto Wilma station (Figure 1B.), through the criterion corresponding to 50% annual Q7,10, the allowed grant volume would be 719.2 hm
3, whereas for
the criteria corresponding to 70% annual Q95 it would be 1,294.7
hm3, 50% monthly Q
7,10 possibly reaching 1.116,4 hm
3 (variation
from 741.4 to 1,116.4 hm3) and in the criterion of 70% monthly
Q95, a maximum value of 1,658.5 hm3; these values are 0.80, 0.55
and 1.31 times higher than the maximum volume allowed by the criterion used for permit granting of 50% annual Q7,10 (criterion
adopted in various states of Brazil).
According to the percent relative difference (Drc%) of the total annual water volume allowable for granting, between the criterion 50% Q7,10/70% Q95, on annual and monthly basis, in
both fluviometric stations evaluated, the water volume granted by 70% Q95 is larger than that of the 50% Q7,10, considering the annual basis (80%). On the monthly basis, the difference between criteria vary from 38.3 to 43.8%, because the differences between the values of monthly Q7,10 and monthly Q95 are lower than the annual values. This fact demonstrates greater proximity between the values of monthly Q7,10 and monthly Q95.
The change in the allowable grant criterion from annual to monthly basis showed a larger variation in the criterion of change from 50% annual Q7,10 to 50% monthly Q7,10, in which
the monthly flows can be increased by up to 36.1 and 30.8%
in the Dourados and Porto Wilma stations, respectively. The analysis of the grant criterion from 70% annual Q95 to 70%
monthly Q95 resulted in a variation of up to 4.5% in the granted
volume in both stations. These values indicate that there is variation between the values of annual and monthly grants, and the former are more restrict, because the granted values are based on the period of greatest water scarcity in the year. In the monthly analysis, it will represent the intrinsic characteristics of the flows of each month. The variation of Drb% using the criterion of 70% annual to monthly Q95 was lower, because in
some months the flows of the monthly Q95 were lower. The survey of the irrigated area in the basin showed 110 pivots in operation. Based on these data, the area effectively irrigated is 12,549 ha. Considering the main crops irrigated in the basin, corn and soybean, the average annual flow withdrawn for irrigation was estimated to be on the order of 2.99 m3 s-1.
Figure 2 shows the variables of flows withdrawn for irrigation, crop evapotranspiration, pluvial precipitation and effective precipitation, monthly means of long duration (period from 2002 to 2011), in the Dourados River Basin.
Figure 1. Monthly and annual minimum reference flows (Q7,10 and Q95) and projection of the use of different criteria of
maximum flows allowable for permits in the Dourados (A.) and Porto Wilma (B.) stations, from 1973 to 2007
Figure 2. Withdrawal streamflows - Qr (m3 s-1), crop
evapotranspiration - ETc (mm d-1), pluvial precipitation - Ppt
(mm d-1) and effective precipitation - Pe (mm d-1), relative to
the period from 2002 to 2011 in the Dourados River Basin
Flow (m
3 s -1)
monthly Q7,10 annual Q7,10 annual 50% Q7,10 monthly 50% Q7,10
monthly Q95 annual Q95 annual 70% Q95 monthly 70% Q95
monthly Q7,10 annual Q7,10 annual 50% Q7,10 monthly 50% Q7,10
ETc varied from 2.6 mm d-1 (June) to 5.6 mm d-1 (November).
The effective precipitation, which refers only to the portion of the precipitation used to meet the evapotranspiration demand of the crops, showed values lower than those observed in the pluvial precipitation. In the months of lowest precipitations (March, August and September), the effective precipitation was close to the pluvial precipitation. As the pluvial precipitation increased, the effective precipitation also increased; however, the difference between these variables was higher.
The highest flow withdrawn for irrigation was observed in August (5.95 m3 s-1), the month with greatest difference
between ETc and Pe. According to Figure 2, even in the months with higher pluvial precipitation, ETc remained always higher than Pe, demonstrating the importance of the need for irrigation in the analyzed period.
Considering the criterion cited by Garrido (2003), as being the adopted one in rivers of the country (corresponding to 70% Q95), the streamflow that can be currently granted in the Dourados River Basin corresponds to 34.36 m3 s-1. Therefore,
the streamflow used by irrigation, average annual value relative to the period from 2002 to 2011 (2.99 m3 s-1), corresponds to
8.7% Q95, or 18.3% for the highest demand observed in the
streamflow withdrawn for irrigation (5.95 m3 s-1), relative
to August. Adopting the criterion of 50% annual Q7,10, it is
observed that the streamflow that can be granted is 18.18 m3
s-1, which is, therefore, more restrictive. Hence, the impacts
of the grantable streamflow become 16.4% for the average streamflow withdrawn and 32.7% for the peak of use of water resources by irrigation.
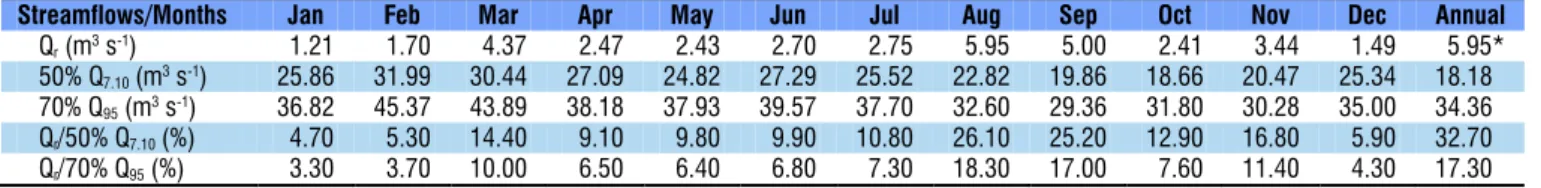
Analyzing the monthly scale (Table 1), the highest percentage of streamflow withdrawn for irrigation (5.95 m3
s-1) in relation to the observed Q
7,10 was 26.1%, evidenced in
August. This percentage was higher than that of the maximum streamflow granted for permits adopting the annual criteria, which was equal to 32.7%, thus highlighting a better protection of the water resources in the adoption of the monthly scale. These values indicate that there is a large variation between the annual and monthly permits, and the annual values are more restrict. The utilization of criteria based on the use of minimum monthly flows aims at a more rational use of the water resources. This occurs because of the greater supply in the amount of water in months with water surplus and lower supply in months with water deficit, without leading to environmental damage to the basin.
Conclusions
1. The granting of permits for the use of water resources, adopting the monthly scale, guarantees a better plan of water
usage compared with the annual scale, since it provides larger grant streamflows in periods with water surplus and lower values in months with lower water availability.
2. In the most extreme situation in the monthly scale, the streamflow withdrawn for irrigation in the month of highest demand (August) represented 26.1% of the observed Q7,10 and 17.3% of the Q95.
3. The average annual streamflow withdrawn for irrigation in the Dourados River Basin, in the studied period, was on the order of 2.99 m3 s-1, and the withdrawal streamflow in the
month of highest demand (August) was equal to 5.95 m3 s-1.
Literature Cited
Alves, E. C. R. F.; Silvino, A. N. de O.; Andrade, N. L. R. de; Silveira, A. Gestão dos recursos hídricos no Estado de Mato Grosso. Revista Brasileira de Recursos Hídricos, v.14, p.69-80, 2009. https://doi. org/10.21168/rbrh.v14n3.p69-80
Arai, F. K.; Pereira, S. B.; Gonçalves, G. G. G. Characterization of water availability in a hydrographic basin. Engenharia Agrícola, v.32, p.591-601, 2012. https://doi.org/10.1590/S0100-69162012000300018
Belico, J. C. B.; Lisboa, L.; Guedes, H. S.; Silva, D. D. da. Comparação
entre vazões mínimas de referência para o rio Formoso-MG. Enciclopédia Biosfera, v.9, p.718-733, 2013.
Bof, L. H. N. Análise de critérios de outorga de direito de uso de recursos hídricos. Viçosa: UFV, 2010. 99p. Dissertação de Mestrado
Bof, L. H. N.; Pruski, F. F.; Silva, L. M. C. da.; Justino, F. Analysis
of appropriate timescales for water diversion permits in Brasil. Environmental Management, v.51, 2013. p.492-500. https://doi. org/10.1007/s00267-012-9982-7
Brodie, R. S.; Hostetler, S.; Slatter, E. Comparison of daily percentiles of streamflow and rainfall to investigate stream–aquifer connectivity. Journal of Hydrology, v.349, p.56-67, 2008. https:// doi.org/10.1016/j.jhydrol.2007.10.056
Doorenbos, J.; Pruitt, W. O. Las necessidades de agua de los cultivos.
Roma: FAO, 1977. 144p.
Garrido, R. J. S. Avaliação dos mecanismos financeiros para o
gerenciamento sustentável da bacia do São Francisco. In: Projeto de gerenciamento integrado das atividades desenvolvidas em terra na bacia do São Francisco. Brasília: ANA, 2003. 335p.
Li, M.; Shao, Q.; Zhang, L.; Chiew, F. H. S. A new regionalization approach and its application to predict flow duration curve in
ungauged basin. Journal of Hydrology, v.389, p.137-145, 2010.
https://doi.org/10.1016/j.jhydrol.2010.05.039
Masih, I.; Uhlenbrook, S.; Maskey, S.; Ahmad, M. D. Regionalization of a conceptual rainfall–runoff model based on similarity of the flow duration curve: A case study from the semi-arid Karkheh basin, Iran. Journal of Hydrology, v.391, p.188-201, 2010. https:// doi.org/10.1016/j.jhydrol.2010.07.018
Table 1. Streamflow withdrawn for irrigation (Qr), minimum reference flows for granting permits (Q7,10 and Q95) and
percent variation of grant flows relative to the monthly seasonal period in relation to the monthly withdrawal flow
Streamflows/Months Jan Feb Mar Apr May Jun Jul Aug Sep Oct Nov Dec Annual
Qr(m3s-1) 01.21 01.70 04.37 02.47 02.43 02.70 02.75 05.95 05.00 02.41 03.44 01.49 05.95*
50% Q7.10(m3s-1) 25.86 31.99 30.44 27.09 24.82 27.29 25.52 22.82 19.86 18.66 20.47 25.34 18.18*
70% Q95(m3s-1) 36.82 45.37 43.89 38.18 37.93 39.57 37.70 32.60 29.36 31.80 30.28 35.00 34.36*
Qr/50% Q7.10(%) 04.70 05.30 14.40 09.10 09.80 09.90 10.80 26.10 25.20 12.90 16.80 05.90 32.70*
Qr/70% Q95(%) 03.30 03.70 10.00 06.50 06.40 06.80 07.30 18.30 17.00 07.60 11.40 04.30 17.30*
Novaes, L. F. de; Pruski, F. F.; Queiroz, D. O. de; Rodriguez, R. del G.; Silva, D. D. da; Ramos, M. M. Modelo para a quantificação da disponibilidade hídrica: Parte 1 - Obtenção da equação de recessão. Revista Brasileira de Recursos Hídricos, v.14, p.15-26, 2009. https://doi.org/10.21168/rbrh.v14n1.p15-26
Peel, M. C.; Finlayson, B. L.; McMahon, T. A. Updated world map of Köppen-Geiger climate classification. Hydrology and Earth System Sciences, v.11, p.1633-1644, 2007. https://doi.org/10.5194/ hess-11-1633-2007
Pruski, F. F.; Rodriguez, R. del G.; Novaes, L. F. de; Silva, D. D. da; Ramos, M. M.; Teixeira, A. de F. Impacto das vazões demandadas pela irrigação e pelos abastecimentos animal e humano, na bacia do Paracatu. Revista Brasileira de Engenharia Agrícola e Ambiental, v.11, p.199-210, 2007. https://doi.org/10.1590/S1415-43662007000200011
Ramos, M. M.; Pruski, F. F. Quantificação e análise da eficiência do uso da água pelo setor agrícola na bacia do São Francisco. In: Projeto gerenciamento integrado das atividades desenvolvidas em terra na bacia do São Francisco. Viçosa: UFV, 2003. 190p.
Silva, D. D. da; Marques, F. de A.; Lemos, A. F. Flexibilidade das vazões mínimas de referência com a adoção do período trimestral. Engenharia na Agricultura. v.19, p.244-254, 2011. https://doi. org/10.13083/1414-3984.v19n03a07
Sousa, H. T.; Pruski, F. F.; Bof, L. H. N.; Cecon, P. R.; Souza, J. R.
C. SisCAH: Sistema computacional para análises hidrológicas. Brasília: ANA, 2009. 60p.