WATER RETENTION AND AVAILABILITY IN SOILS OF THE
STATE OF SANTA CATARINA-BRAZIL: EFFECT OF
TEXTURAL CLASSES, SOIL CLASSES AND LITHOLOGY
(1)André da Costa(2), Jackson Adriano Albuquerque(3), Adriano da Costa(4), Patricia Pértile(5) & Franciani Rodrigues da Silva(6)
SUMMARY
The retention and availability of water in the soil vary according to the soil characteristics and determine plant growth. Thus, the aim of this study was to evaluate water retention and availability in the soils of the State of Santa Catarina, Brazil, according to the textural class, soil class and lithology. The surface and subsurface horizons of 44 profiles were sampled in different regions of the State and different cover crops to determine field capacity, permanent wilting point, available water content, particle size, and organic matter content. Water retention and availability between the horizons were compared in a mixed model, considering the textural classes, the soil classes and lithology as fixed factors and profiles as random factors. It may be concluded that water retention is greater in silty or clayey soils and that the organic matter content is higher, especially in Humic Cambisols, Nitisols and Ferralsol developed from igneous or sedimentary rocks. Water availability is greater in loam-textured soils, with high organic matter content, especially in soils of humic character. It is lower in the sandy texture class, especially in Arenosols formed from recent alluvial deposits or in gravelly soils derived from granite. The greater water availability in the surface horizons, with more organic matter than in the subsurface layers, illustrates the importance of organic matter for water retention and availability.
Index terms: field capacity, permanent wilting point, available water capacity, particle size, mixed models.
(1) Part of the Doctoral Thesis of the first author. Received for publication on October 04, 2012 and approved on August 02, 2013. (2) Post-graduate student in Soil Physics at the Federal University of Santa Maria, Santa Maria (RS), Brazil. PNPD Scholarship
holder, Capes. E-mail: [email protected]
(3) Professor, Soil Department, State University of Santa Catarina, Centro de Ciências Agroveterinárias. UDESC-CAV. Av. Luís de Camões, 2.090. Conta Dinheiro. Lages (SC), Brazil. CEP 88.520-000. CNPq Researcher. E-mail: [email protected] (4) Master's student in Soil Management, UDESC-CAV. E-mail: [email protected]
RESUMO:RETENÇÃO E DISPONIBILIDADE DE ÁGUA EM SOLOS DE SANTA CATARINA: EFEITO DAS CLASSES TEXTURAIS, CLASSES DE SOLO E LITOLOGIAS
A retenção e a disponibilidade de água variam com os atributos do solo e determinam o crescimento das plantas. Nesse sentido, este estudo objetivou avaliar a retenção e a disponibilidade de água nos solos de Santa Catarina, em razão da classe textural, classe de solo e litologia. Foram amostrados os horizontes superficiais e subsuperficiais de 44 perfis de solo, em áreas de diferentes regiões do Estado e coberturas vegetais, para a determinação da capacidade de campo, ponto de murcha permanente, água disponível, granulometria e teor de matéria orgânica. A retenção e a disponibilidade de água foram comparadas entre os horizontes por meio de um modelo misto, considerando as classes texturais, classes de solo e litologias, como fatores fixos, e os perfis, como fatores aleatórios. A retenção de água foi maior em solos argilosos ou siltosos e com maior teor de matéria orgânica, especialmente nos Cambissolos Húmicos, Nitossolos e Latossolos desenvolvidos de rochas ígneas afaníticas ou sedimentares, como folhelhos, argilitos e siltitos. A disponibilidade de água foi maior em solos de textura franca, com elevados teores de matéria orgânica, principalmente nos com caráter húmico; e menor em solos da classe textural areia, principalmente nos Neossolos Quartzarênicos, formados a partir de depósitos aluvionares recentes ou em solos cascalhentos, derivados de granito. A maior disponibilidade de água nos horizontes superficiais, com mais matéria orgânica, em comparação aos subsuperficiais, comprovou a importância da matéria orgânica na retenção e disponibilidade de água.
Termos de indexação: capacidade de campo, ponto de murcha permanente, água disponível, granulometria, modelos mistos.
INTRODUCTION
Simulation models that evaluate water movement in the soil-plant-atmosphere system are an important tool in agriculture and in environmental management. Nevertheless, the use of these models is limited due to the need for a large number of soil properties as input variables, such as water retention and availability in the soil for plants (Wösten et al., 1999), and these properties are strongly affected by soil texture, mineralogy, organic matter content and management (Hillel, 1998).
Generally soils with finer particle sizes retain more water; nevertheless, as moisture increases in both field capacity (FC) and in the permanent wilting point (PWP), this does not always result in greater available water content (Rawls et al., 1982; Gaiser et al., 2000; Al Majou et al., 2008; Reichert et al., 2009). Furthermore, it is important to consider that there are confounding factors in the relation between texture and water retention in the soil. This occurs because in more clayey soils, the chemical and physical protection of organic matter is generally greater (Oades, 1988; Dieckow et al., 2009), especially in soils of colder and wetter regions (Tate, 1992; Chen & Chiu, 2000; Dalmolin et al., 2006). This condition raises the organic matter content and, consequently, water retention, especially at low tensions (Rawls et al., 2003). Another soil property that affects water retention and availability is mineralogy. In soils with predominance of 2:1 clay minerals water retention and availability are higher than in kaolinitic soils (Gaiser et al., 2000).
Since the soil particle size, mineralogical composition and organic matter content are rather variable according to the lithology, altitude and climate, studies must adress the relation of water retention and availability to the other soil properties for each location of interest. In such studies, one tries to group the different profiles according to other soil properties. Generally, use is made of the soil textural class (Rawls et al, 1982; Al Majou et al., 2008), the soil class using different taxonomic systems (Batjes, 1996) or soil lithology (Bastet, 1999) as a criterion for grouping the soil profiles or horizons. In developed countries, the relation between soil properties and water retention and/or availability is evaluated using large databases, such as the NRCS (Soil Survey Staff, 1995) and the HYPRES (Wösten et al., 1999), while in the other countries these studies are generally lacking, which impedes the use of simulation models (Hodnett & Tomasella, 2002).
climate of Santa Catarina, which is constantly moist, associated with high altitudes in some regions of the State, results in a climate ranging from humid subtropical to temperate, favoring the predominance of 1:1 clay minerals (kaolinite) and a greater accumulation of organic matter in the soil, mainly in more clayey highland soils, in comparison to soils of the same lithology and textural class as in other states of Brazil. The predominance of kaolinite may result in low available water contents in the soils of Santa Catarina, which may be attenuated by the effect of the high contents of organic matter in the surface horizons.
Nevertheless, so far, these hypotheses cannot be confirmed by the quantity of information available on soils of the State of Santa Catarina. Thus, the purpose of this study was to evaluate and compare water retention and availability in soils of different textural classes, soil classes and lithologies located in the state of Santa Catarina, in the southern region of Brazil.
MATERIALS AND METHODS
The study analyzed 44 profiles, representing the main soil classes of the State of Santa Catarina, consisting of two Argissolos Amarelos (Acrisols), two Argissolos Vermelhos (Acrisols), five Argissolos Vermelho-Amarelos (Acrisols), two Cambissolos Háplicos (Cambisols), four Cambissolos Húmicos (Cambisols), two Chernossolos Argilúvicos (Chernozems), one Chernossolo Háplico (Chernozem), one Latossolo Amarelo (Ferralsol), one Latossolo Bruno (Ferralsol), three Latossolos Vermelhos (Ferralsols), one Latossolo Vermelho-Amarelo (Ferralsol), four Neossolos Litólicos (Leptosols), three Neossolos Quartzarênicos (Arenosols), nine Nitossolos Brunos (Nitisols) and four Nitossolos Vermelhos (Nitisols). The choice of the profiles was based on the availability of survey data of soils of Santa Catarina with the morphological and mineralogical description of the soil in modal profiles. The climate in the State is Cfa or Cfb, according to the Köppen classification (Epagri/ Ciram, 2002).
Lithology was determined for each soil based on the rocks found in the profile, considering the geological map and the lithostratigraphic column of the State of Santa Catarina, as presented by Zanini et al. (1997). The horizons A, AB, BA and B, when present, and their subdivisions (A1, A2, B1 and B2) were studied in each profile, and horizons A and C of Neossolos Quartzarênicos (Arenosols). In the middle part of each horizon, undisturbed samples were collected with stainless steel cylinders (diameter 6.0 cm, height 2.5) pushed into the soil, in quadruplicate, as well as composite disturbed samples.
The undisturbed samples were saturated by capillarity and stabilized at water tensions of 1, 6 and 10 kPa in a sand suction column (Reinert & Reichert, 2006) and at tensions of 33, 100, 300, 500 and 1,500 kPa in Richards’ chambers (Richards, 1949). Field capacity (FC) was considered as the volumetric soil moisture at a tension of 10 kPa (pore diameter = 30 µm); permanent wilting point (PWP)
as the volumetric moisture at 1,500 kPa (pore diameter = 0.2 µm); and the available water content
(AW) as the volume of water retained between 10 and 1,500 kPa.
The following properties were determined in the disturbed samples: soil particle size by the pipette method according to Day (1965), to classify the soil according to the textural classes (Santos et al., 2005); and organic matter (OM) content by multiplication with the factor 1.724 of the total organic carbon content determined by the Walkley-Black method modified by Tedesco et al. (1995).
Statistical analysis was carried out after the creation of two soil groups because the surface horizons differed from the subsurface horizons in OM content. The database was thus divided into two groups: horizons O, A, AB, AC and their subdivisions were grouped as “surface” horizons, and horizons BA, B, C and their subdivisions were grouped as “subsurface” horizons. The grouping of horizons by their position in the profile generally reduces the standard error in the estimation of water retention and availability in the soil (Bruand, 2004a).
The effects of the textural class (13 classes), of the soil class at the suborder level (according to Embrapa, 2006) and of the lithology with regard to FC, PWP and AW were analyzed for each group of horizons. For this purpose, univariate statistical analysis was used in a mixed model with the “PROC GLIMMIX” procedure of the SAS 9.2 program (Schabenberger, 2007). In this analysis, the soil class, the textural class or the lithology were considered as a fixed effect and the profiles as a random effect. Due to the different number of horizons in each soil profile, which were separated into “surface” and “subsurface” horizons, the effect of the order of position of each horizon in the soil profile was included using the “random residual” option in the statistical model. For example, all B1 horizons (including Bt1, Bw1, Bi, and Bt) were denominated by a single name.
RESULTS AND DISCUSSION
Water retention and availability in the soil
versus textural classes
In the surface horizons, the field capacity (FC) and permanent wilting point (PWP) were similar for most textural classes. This was the result of the large variability in FC and PWP observed within a single textural class, which raised the standard error of the estimate. Consequently, soils had mean values with differences of up to 0.14 cm3 cm-3 for FC and 0.10 cm3
cm-3 for PWP that were considered statistically similar
(Table 1). In the subsurface horizons, the variability among soils with a similar textural class was lower, resulting in a clearer distinction among textural classes by soil water retention (Table 1). The greater variability in water retention in the surface horizons occurred by the more intense weathering effect through the activity of microorganisms, of plants, of wetting and drying cycles, and also of the anthropic effect through soil use and management. The combination of these effects resulted in a high standard error of the estimate of OM contents in surface horizons of soils of the same textural class. This variability of the OM contents, associated with the different uses of
the soils of Santa Catarina, results in changes in soil structure, which alters the distribution of pores, water adsorption and water retention in the soil at lower suctions (Braida et al., 2011). In contrast, alteration in the OM contents in soils with the same particle sizes also modifies the water retention capacity at high suctions due to alteration in the specific surface area of the soil and in the quantity of water adsorbed by chemical bonds (Resurreccion et al., 2011). In addition to the OM contents, as the soils of Santa Catarina are derived from distinct materials of origin (Embrapa, 2004) which underwent different pedogenetic processes, the high standard error of PWP in soils of similar particle size may also be related to the variations in the mineralogy of the soils evaluated due to its effect on the specific surface area of the soil and on water retention (Bruand, 2004b).
In the surface horizons, FC was greater (0.41-0.55 cm3 cm-3) in soils with predominance of particles with
diameter less than 0.53 µm, including the clayey and
loamy soils and their variations (Table 1). The FC values (0.26 cm3 cm-3) were intermediate in the sandy
loam soils, and lowest (0.16 cm3 cm-3) in soils of the
sandy class. The PWP was also greater in the clayey and/or silty soils and lower in the sandy soils. In the
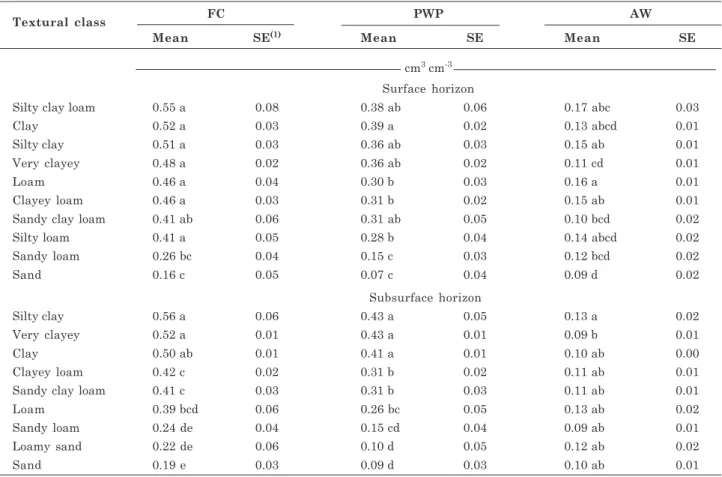
Textural class FC PWP AW
Mean SE(1) Mean SE Mean SE
cm3 cm-3 Surface horizon
Silty clay loam 0.55 a 0.08 0.38 ab 0.06 0.17 abc 0.03
Clay 0.52 a 0.03 0.39 a 0.02 0.13 abcd 0.01
Silty clay 0.51 a 0.03 0.36 ab 0.03 0.15 ab 0.01
Very clayey 0.48 a 0.02 0.36 ab 0.02 0.11 cd 0.01
Loam 0.46 a 0.04 0.30 b 0.03 0.16 a 0.01
Clayey loam 0.46 a 0.03 0.31 b 0.02 0.15 ab 0.01
Sandy clay loam 0.41 ab 0.06 0.31 ab 0.05 0.10 bcd 0.02
Silty loam 0.41 a 0.05 0.28 b 0.04 0.14 abcd 0.02
Sandy loam 0.26 bc 0.04 0.15 c 0.03 0.12 bcd 0.02
Sand 0.16 c 0.05 0.07 c 0.04 0.09 d 0.02
Subsurface horizon
Silty clay 0.56 a 0.06 0.43 a 0.05 0.13 a 0.02
Very clayey 0.52 a 0.01 0.43 a 0.01 0.09 b 0.01
Clay 0.50 ab 0.01 0.41 a 0.01 0.10 ab 0.00
Clayey loam 0.42 c 0.02 0.31 b 0.02 0.11 ab 0.01
Sandy clay loam 0.41 c 0.03 0.31 b 0.03 0.11 ab 0.01
Loam 0.39 bcd 0.06 0.26 bc 0.05 0.13 ab 0.02
Sandy loam 0.24 de 0.04 0.15 cd 0.04 0.09 ab 0.01
Loamy sand 0.22 de 0.06 0.10 d 0.05 0.12 ab 0.02
Sand 0.19 e 0.03 0.09 d 0.03 0.10 ab 0.01
Table 1. Soil moisture at field capacity (FC), permanent wilting point (PWP) and available water content (AW) in horizons grouped according to the soil textural classes of the State of Santa Catarina
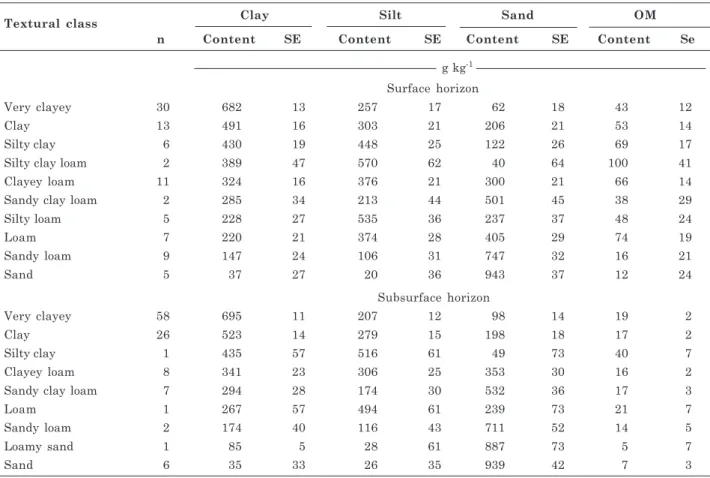
subsurface horizons, moisture values in FC and PWP were higher in horizons with silty clay texture, very clayey texture and clayey texture soils (Table1), all with high clay, silt and OM contents (Table 2). Intermediate values of FC and PWP occurred in horizons with clayey loam, sandy clay loam and loam texture, which are characterized by a balanced distribution of the particle size fractions (about one third each of clay, silt and sand). Lower FC and PWP occurred in soils with sandy loam, loamy sand and sandy texture.
The increase in FC and PWP in soils with higher clay and silt contents was also observed in Rio Grande do Sul, RS (Reichert et al., 2009), the USA (Rawls et al., 1982), France (Al Majou et al., 2008), and in soils of a semiarid tropical climate in the northeastern region of Brazil and in the Southeast of Nigeria (Gaiser et al., 2000). Lower water retention in the sandier soils occurs due to the predominance of large diameter pores (>30 µm), which are drained at low suctions, while in soils with a more clayey texture, smaller-diameter pores predominate (<0.2 mm), which favor the increase of water retention <30 µm high suctions
and water availability in the soil (Petersen et al., 1968). The variations in water retention and
availability in soils of Santa Catarina were also similar to those of the theoretical model developed by Buckman & Brady (1964).
Greater FC and PWP were observed for most textural classes of the soils of Santa Catarina (SC) in comparison to soils of RS, the USA, France and other regions of a semiarid tropical climate. The cause of the greater water retention may be associated with the high OM content observed in the soils of Santa Catarina, promoting the increase in water retention, regardless of the soil texture (Rawls et al., 2003). The mean OM content of the soils of Santa Catarina was 47 g kg-1 in the surface horizons and 17 g kg-1 in the
subsurface horizons (mean of 30 g kg-1), which is
greater than the mean contents of the databases used by Reichert et al. (2009), Rawls et al. (1982), Al Majou et al. (2008) and Gaiser et al. (2000). The greater OM content of the soils of SC is a consequence of the climatic conditions and of lithology. The accumulation of OM in the soil is favored in regions with a cold and wet climate (Tate, 1992; Chen & Chiu, 2000; Dalmolin et al., 2006) and in soils with a predominance of clay (Almeida et al., 1997, 2003; Corrêa, 2003; Embrapa, 2004). These factors reduce microbial activity and protect the organic matter chemically and physically
Textural class Clay Silt Sand OM
n Content SE Content SE Content SE Content Se
g kg-1 Surface horizon
Very clayey 30 682 13 257 17 62 18 43 12
Clay 13 491 16 303 21 206 21 53 14
Silty clay 6 430 19 448 25 122 26 69 17
Silty clay loam 2 389 47 570 62 40 64 100 41
Clayey loam 11 324 16 376 21 300 21 66 14
Sandy clay loam 2 285 34 213 44 501 45 38 29
Silty loam 5 228 27 535 36 237 37 48 24
Loam 7 220 21 374 28 405 29 74 19
Sandy loam 9 147 24 106 31 747 32 16 21
Sand 5 37 27 20 36 943 37 12 24
Subsurface horizon
Very clayey 58 695 11 207 12 98 14 19 2
Clay 26 523 14 279 15 198 18 17 2
Silty clay 1 435 57 516 61 49 73 40 7
Clayey loam 8 341 23 306 25 353 30 16 2
Sandy clay loam 7 294 28 174 30 532 36 17 3
Loam 1 267 57 494 61 239 73 21 7
Sandy loam 2 174 40 116 43 711 52 14 5
Loamy sand 1 85 5 28 61 887 73 5 7
Sand 6 35 33 26 35 939 42 7 3
by their interaction with soil clay minerals (Oades, 1988; Dieckow et al., 2009).
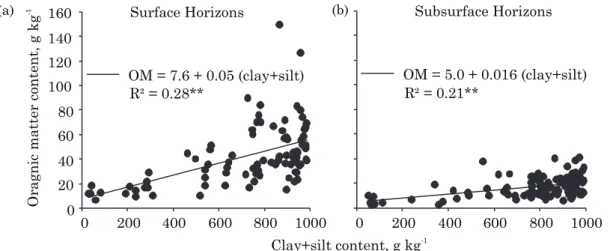
In the soils of SC, the OM contents had a positive linear relationship to the clay+silt contents for the surface and subsurface horizons (Figure 1a, b), with a greater angular coefficient in the surface horizons, confirming the interaction observed by Oades (1988) and Dieckow et al. (2009). This interaction results in an additive effect of the fine soil particles with the OM in the sense of increasing the available water content (AW) since the AW varied little among the textural classes in the subsurface horizons (Figure 2).
In regard to AW content, greater amplitude was observed in the surface horizons (0.08 cm3 cm-3) in
relation to the subsurface horizons (0.04 cm3 cm-3)
(Figure 2). In the surface horizons, AW is greater in soils with greater silt as well as OM contents (Table 2), including soils of silty clay loam, loam, clayey loam and silty clay texture, with variation from 0.15 to 0.17 cm3 cm-3 (Table 1). Intermediate contents of AW
occurred in the clayey, very clayey, sandy loam and sandy clay loam classes (variation 0.10-0.13 cm3 cm-3).
Lower AW contents occurred in soils with a sandy texture, with a mean value of 0.09 cm3 cm-3. In
percentage, the surface horizons of the soils with silty clay loam, loam, clayey loam and silty clay textures have a 44 and 78 % greater AW content than the very clayey and sandy-textured soils, respectively.
In the subsurface horizons, although water retention is greater in clayey texture soils (Figure 2b), the AW content of most textural classes was similar (0.09-0.13 cm3 cm-3), differing only among the
horizons with silty clay and very clayey texture (Table 1). The greater water availability observed in the surface horizons in loamy to clayey soils in comparison to that observed in the subsurface horizons is due to greater OM content (Braida et al., 2011) and to the soil structure in the surface horizons.
Thus, among the main textural classes evaluated, highest water contents are available to plants in soils with loamy texture and high silt and clay levels, as similarly observed in the south of Brazil, the USA and France (Rawls et al, 1982; Al Majou et al., 2008; Reichert et al., 2009). In the subsurface horizons of the soils of SC, the textural class has little influence on water availability.
A similarity was observed in the AW content in most textural classes of the soils of SC and RS (Reichert et al., 2009) and of the region near Paris, France (Al Majou et al., 2008), mainly in the soil surface horizons. This may be atrributed to the clay type in the soil, since the climate types Cfa and Cfb are somewhat similar (Köppen & Geiger, 1928), which favors the formation of 1:1 type clay minerals and, to a lesser extent, 2:1 type clay minerals. Nevertheless, the soils of the USA have greater AW content in most textural classes, compared to the soils of SC. This difference is probably due the predominance of soils with high activity clay of the 2:1 type (Nettleton et al., 1983; Rawls et al., 2003), while in SC soils with kaolinite, 2:1 type clay minerals with hydroxy-aluminum interlayers and iron oxides predominate (Almeida et al., 1997, 2003; Corrêa, 2003; Paes Sobrinho et al., 2009; Bringhenti, 2010). The increase in water availability provided by the 2:1 type clay minerals has not been studied in detail (Bruand, 2004b); nevertheless, the studies of Gaiser et al. (2000) and Reichert et al. (2009) indicate a positive relation between these soil properties.
Water retention and availability versus soil
classes
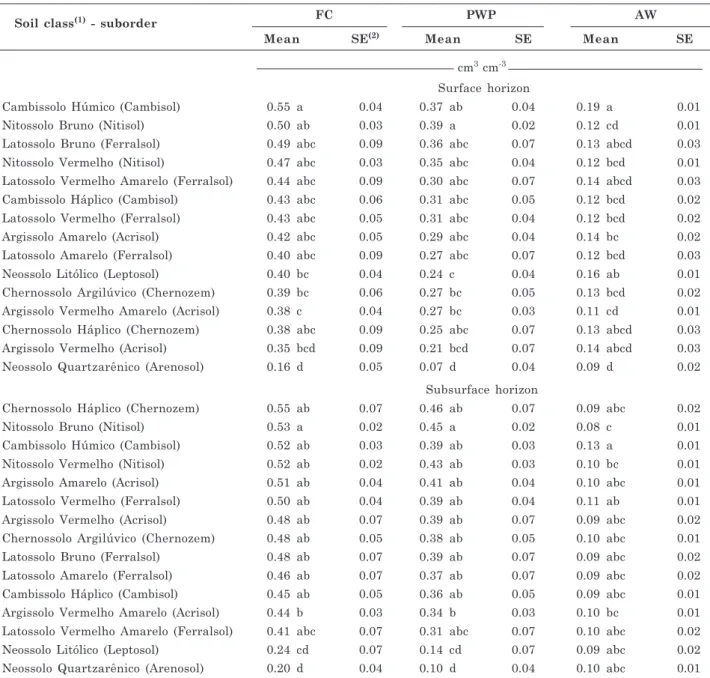
The grouping of the profiles according to the soil classes of the Brazilian Soil Classification System (Sistema Brasileiro de Classificação de Solos - SiBCS) (Embrapa, 2006) at the level of suborders indicated differences in water retention, mainly in the surface horizons (Table 3). Nevertheless, FC and PWP in
Figure 1. Relation between organic matter (OM) contents with the clay+silt contents for the surface (a) and subsurface (b) horizons of the soils of the State of Santa Catarina. ** model significant at 1 %.
Subsurface Horizons
0 200 400 600 800 1000
OM = 5.0 + 0.016 (clay+silt) R² = 0.21**
Surface Horizons
Clay+silt content, g kg-1
0 200 400 600 800 1000
0 20 40 60 80 100 120 140 160
OM = 7.6 + 0.05 (clay+silt) R² = 0.28**
Oragnic matter content,
g kg
-1
the surface horizon were statistically equal among soils, with differences in the mean values of up to 0.15 cm3 cm-3, indicating great variability in water
retention among soils of the same class at the suborder level.
In the surface horizons, FC and PWP had greater contents in the Cambissolos (Cambisols) (especially in the Cambissolos Húmicos), Nitossolos (Nitisols) and Latossolos (Ferralsols); intermediate contents in the Argissolos (Acrisols), Neossolos Litólicos (Leptosols) and Chernossolos (Chernozems); and lower contents in the Neossolos Quartzarênicos (Arenosols) (Table 3). In the subsurface horizons, FC and PWP were similar for most soil classes, with the exception of the Neossolos Quartzarênicos (Arenosols), which had lower water retention (Table 3).
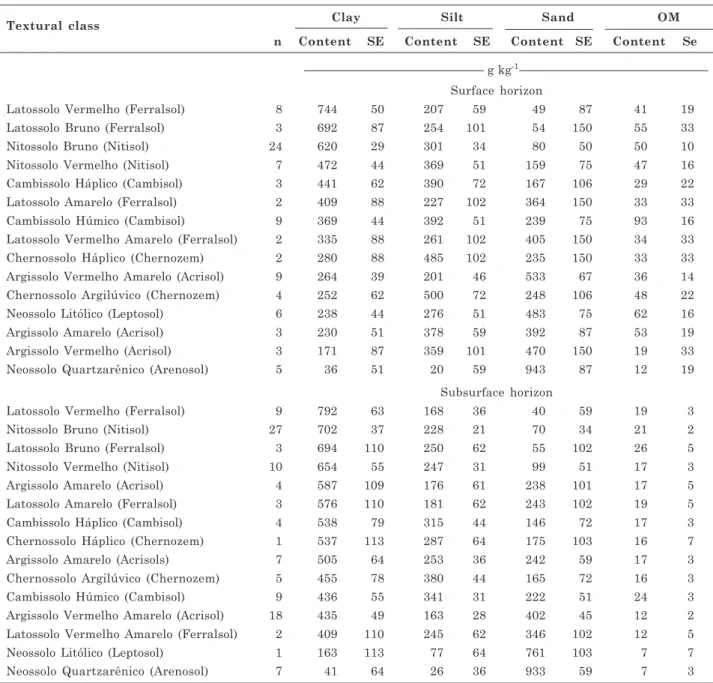
Greater water retention in the surface horizons of the Cambissolos Húmicos (Humic Cambisols) is associated with their clayey loam texture and greater OM content, which is greater in this soil class than in the other classes evaluated (18 to 47 g kg-1)
(Table 4). The high FC and PWP of the Latossolos (Ferralsols) and Nitossolos (Nitisols) are also associated with the high clay and OM contents. Lower water retention in the Neossolos Quartzarênicos (Arenosols) (Table 3), however, is due to their high sand content (more than 900 g kg-1) (Table 4),
resulting in the predominance of macropores. The AW content in the surface horizons of the soils of SC differed up to 0.10 cm3 cm-3 (Table 3) among the
suborders. It was highest in the Cambissolos Húmicos (Humic Cambisols) and Neossolos Litólicos (Leptosols) (0.16-0.19 cm3 cm-3) and lowest in the other classes,
which did not differ from each other (0.09-0.14 cm3
cm-3). In the subsurface horizons, the AW differed
among few soil classes since the amplitude of AW was only 0.05 cm3 cm-3. Among the classes, the
Cambissolos Húmicos (Humic Cambisols) had greater AW contents, and the Nitossolos Brunos (Nitisols) had lower contents. In regard to the other classes, AW had intermediate contents, not differing from each other (Table 3). The greater water availability in the surface horizons of the Cambissolos Húmicos (Humic Cambisols) and Neossolos Litólicos (Leptosols) occurred due to the additive effect of two properties, greater OM contents, and clay, silt and sand contents near the 1/3 ratio of each fraction. At this proportion, the macropores formed by the sand fraction may be occupied by the silt and clay fractions, forming intermediate diameter pores, responsible for the retention of the available water.
Batjes (1996) evaluated the AW content (33-1,500 kPa) of soils that form the “World Inventory of Soil Emission Potentials (WISE)” database, consisting of 4,352 profiles and used to create the Soil Map of the World of the FAO-Unesco. Similalry as in the soils of SC, Batjes (1996) observed greater AW in the Humic Cambisols (FAO, 1991), which correspond approximately to the order of the Cambissolos Húmicos in the SiBCS (Embrapa, 2006). In relation to the classes of Argissolos, Latossolos and Nitossolos of the SiBCS (Embrapa, 2006), which correspond approximately to the classes of Acrisols, Ferralsols and Nitisols, respectively, by the FAO (1991) classification, the AW was approximately 0.04 cm3
cm-3 greater in the Acrisols (mean of 0.12 cm3 cm-3)
in comparison to the Ferralsols and Nitosols(mean of 0.08 cm3 cm-3), i.e., a difference of 50 % in the AW
content (Batjes, 1996). Batjes (1996) attributed the effect of soil mineralogy as a cause of lower water availability in the Ferralsols and Nitisols, since 1:1 type clay minerals and oxides predominate in these soils, while 2:1 type clay minerals predominate in the Cambisols and Acrisols. In the soils of SC, this difference was not observed, since the AW contents of these three soil classes was medium 0.12 cm3 cm-3 in
the surface horizons and 0.10 cm3 cm-3 in the
subsurface horizons.
Another difference observed was in regard to the class of the Neossolos Quartzarênicos (Arenosols),
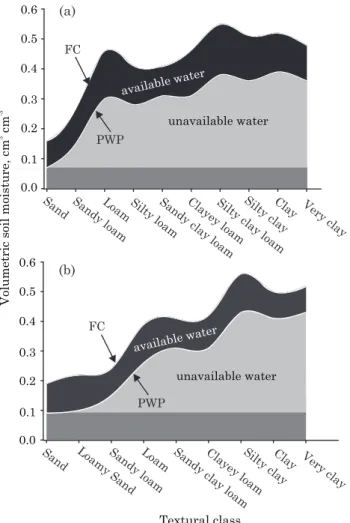
Sand Sandy loamLoam Silty loamSandy clay loamClayey loamSilty clay loamSilty clayClay Very clay 0.0
0.1 0.2 0.3 0.4 0.5 0.6
0.0 0.1 0.2 0.3 0.4 0.5 0.6
PWP FC
unavailable water
Textural class
available water
Sand Loamy SandSandy loamLoam Sandy clay loamClayey loamSilty clayClay Very clay
Volumetric soil moisture, cm
cm
3
-3
FC
PWP
available water
unavailable water
Figure 2. Variation of field capacity (FC), permanent wilting point (PWP) and available water content (AW) according to the textural class of surface (a) and subsurface (b) horizons of the soils of the State of Santa Catarina.
(a)
which had AW contents in the surface and subsurface horizons similar to other classes, such as in the Latossolos (Ferralsols), Nitossolos (Nitisols), Chernossolos (Chernozems) and Argissolos (Acrisols). In contrast, Batjes (1996) observed that the soils corresponding to this class, called Arenosols in the FAO (1991) classification, have AW contents of around 50 % (AW = 0.04 cm3 cm-3) of those in the
Neossolos Quartzarênicos Arenosols of SC. This greater water availability in the sandy soils of Santa Catarina may be mainly related to the fine sand contents of these soils, which ranged from 681 to 783 g kg-1 (Table 4), and have a positive relation to
water availability (Costa, 2012).
Water retention and availability versus soil
lithology
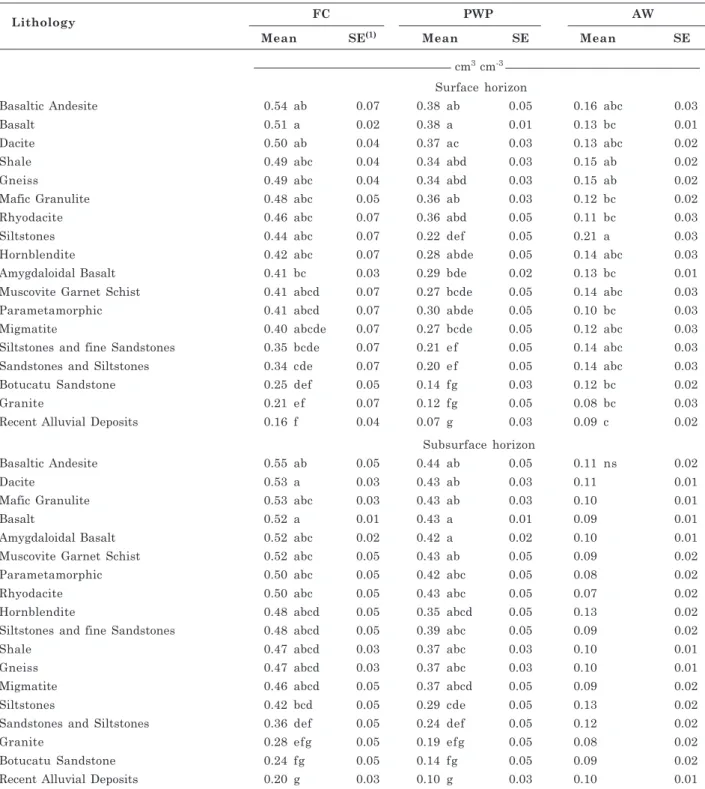
The physical properties related to water retention also differed according to the soil lithology (Table 5). In the surface horizons, greater FC and PWP occurred in the soils derived from extrusive igneous rocks from the Serra Geral Formation (basaltic andesite, basalt, amygdaloidal basalt, dacite, rhyodacite), which give rise to soils with clayey or very clayey textural classes (Embrapa, 2006) and with mean OM contents (above 50 g kg-1) (Table 6);
intrusive igneous (hornblendite, except for granite), metamorphic rocks (muscovite garnet schist, mafic
Soil class(1) - suborder FC PWP AW
Mean SE(2) Mean SE Mean SE
cm3 cm-3 Surface horizon
Cambissolo Húmico (Cambisol) 0.55 a 0.04 0.37 ab 0.04 0.19 a 0.01
Nitossolo Bruno (Nitisol) 0.50 ab 0.03 0.39 a 0.02 0.12 cd 0.01
Latossolo Bruno (Ferralsol) 0.49 abc 0.09 0.36 abc 0.07 0.13 abcd 0.03
Nitossolo Vermelho (Nitisol) 0.47 abc 0.03 0.35 abc 0.04 0.12 bcd 0.01
Latossolo Vermelho Amarelo (Ferralsol) 0.44 abc 0.09 0.30 abc 0.07 0.14 abcd 0.03
Cambissolo Háplico (Cambisol) 0.43 abc 0.06 0.31 abc 0.05 0.12 bcd 0.02
Latossolo Vermelho (Ferralsol) 0.43 abc 0.05 0.31 abc 0.04 0.12 bcd 0.02
Argissolo Amarelo (Acrisol) 0.42 abc 0.05 0.29 abc 0.04 0.14 bc 0.02
Latossolo Amarelo (Ferralsol) 0.40 abc 0.09 0.27 abc 0.07 0.12 bcd 0.03
Neossolo Litólico (Leptosol) 0.40 bc 0.04 0.24 c 0.04 0.16 ab 0.01
Chernossolo Argilúvico (Chernozem) 0.39 bc 0.06 0.27 bc 0.05 0.13 bcd 0.02
Argissolo Vermelho Amarelo (Acrisol) 0.38 c 0.04 0.27 bc 0.03 0.11 cd 0.01
Chernossolo Háplico (Chernozem) 0.38 abc 0.09 0.25 abc 0.07 0.13 abcd 0.03
Argissolo Vermelho (Acrisol) 0.35 bcd 0.09 0.21 bcd 0.07 0.14 abcd 0.03
Neossolo Quartzarênico (Arenosol) 0.16 d 0.05 0.07 d 0.04 0.09 d 0.02
Subsurface horizon
Chernossolo Háplico (Chernozem) 0.55 ab 0.07 0.46 ab 0.07 0.09 abc 0.02
Nitossolo Bruno (Nitisol) 0.53 a 0.02 0.45 a 0.02 0.08 c 0.01
Cambissolo Húmico (Cambisol) 0.52 ab 0.03 0.39 ab 0.03 0.13 a 0.01
Nitossolo Vermelho (Nitisol) 0.52 ab 0.02 0.43 ab 0.03 0.10 bc 0.01
Argissolo Amarelo (Acrisol) 0.51 ab 0.04 0.41 ab 0.04 0.10 abc 0.01
Latossolo Vermelho (Ferralsol) 0.50 ab 0.04 0.39 ab 0.04 0.11 ab 0.01
Argissolo Vermelho (Acrisol) 0.48 ab 0.07 0.39 ab 0.07 0.09 abc 0.02
Chernossolo Argilúvico (Chernozem) 0.48 ab 0.05 0.38 ab 0.05 0.10 abc 0.01
Latossolo Bruno (Ferralsol) 0.48 ab 0.07 0.39 ab 0.07 0.09 abc 0.02
Latossolo Amarelo (Ferralsol) 0.46 ab 0.07 0.37 ab 0.07 0.09 abc 0.02
Cambissolo Háplico (Cambisol) 0.45 ab 0.05 0.36 ab 0.05 0.09 abc 0.01
Argissolo Vermelho Amarelo (Acrisol) 0.44 b 0.03 0.34 b 0.03 0.10 bc 0.01
Latossolo Vermelho Amarelo (Ferralsol) 0.41 abc 0.07 0.31 abc 0.07 0.10 abc 0.02
Neossolo Litólico (Leptosol) 0.24 cd 0.07 0.14 cd 0.07 0.09 abc 0.02
Neossolo Quartzarênico (Arenosol) 0.20 d 0.04 0.10 d 0.04 0.10 abc 0.01
Table 3. Soil moisture at field capacity (FC), permanent wilting point (PWP), and available water content (AW), in different soil classes in the State of Santa Catarina
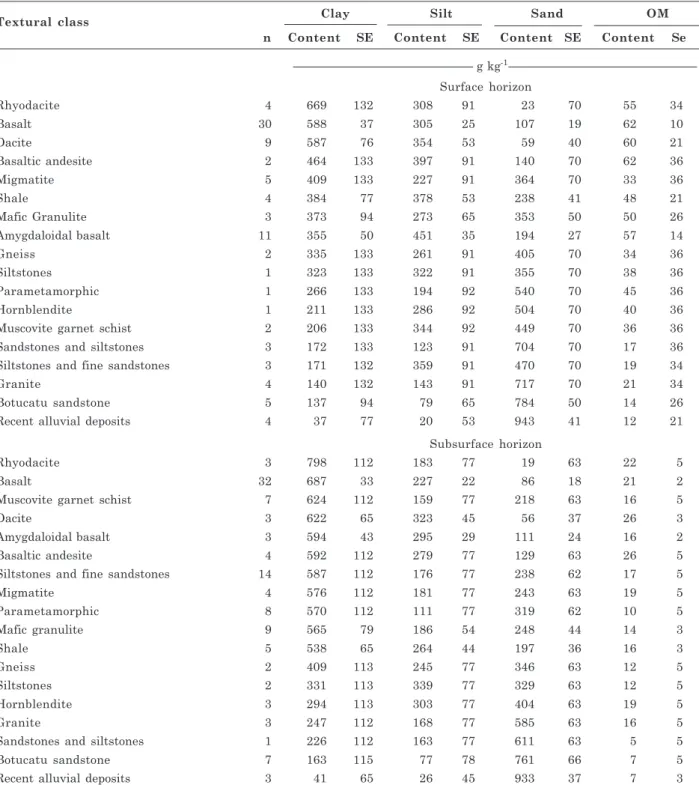
granulite, migmatite, parametamorphic); and fine texture sedimentary rocks (Shales or siltstones), which gave rise to medium texture soils (Embrapa, 2006) and medium OM contents (35 to 50 g kg-1) (Table 5).
Soils with intermediate FC and PWP moisture contents were those derived from sedimentary rocks, which gave rise to soils with loam texture (Embrapa, 2006), but with clay contents of approximately 170 g kg-1 and with medium OM contents (approximately
35 g kg-1). The moisture contents of FC and PWP
were lowest in soils derived from rocks or quartz-rich sedimentary deposits (Botucatu sandstone and recent alluvial deposits), which gave rise to soils with a sandy
Textural class Clay Silt Sand OM
n Content SE Content SE Content SE Content Se
g kg-1 Surface horizon
Latossolo Vermelho (Ferralsol) 8 744 50 207 59 49 87 41 19
Latossolo Bruno (Ferralsol) 3 692 87 254 101 54 150 55 33
Nitossolo Bruno (Nitisol) 24 620 29 301 34 80 50 50 10
Nitossolo Vermelho (Nitisol) 7 472 44 369 51 159 75 47 16
Cambissolo Háplico (Cambisol) 3 441 62 390 72 167 106 29 22
Latossolo Amarelo (Ferralsol) 2 409 88 227 102 364 150 33 33
Cambissolo Húmico (Cambisol) 9 369 44 392 51 239 75 93 16
Latossolo Vermelho Amarelo (Ferralsol) 2 335 88 261 102 405 150 34 33
Chernossolo Háplico (Chernozem) 2 280 88 485 102 235 150 33 33
Argissolo Vermelho Amarelo (Acrisol) 9 264 39 201 46 533 67 36 14
Chernossolo Argilúvico (Chernozem) 4 252 62 500 72 248 106 48 22
Neossolo Litólico (Leptosol) 6 238 44 276 51 483 75 62 16
Argissolo Amarelo (Acrisol) 3 230 51 378 59 392 87 53 19
Argissolo Vermelho (Acrisol) 3 171 87 359 101 470 150 19 33
Neossolo Quartzarênico (Arenosol) 5 36 51 20 59 943 87 12 19
Subsurface horizon
Latossolo Vermelho (Ferralsol) 9 792 63 168 36 40 59 19 3
Nitossolo Bruno (Nitisol) 27 702 37 228 21 70 34 21 2
Latossolo Bruno (Ferralsol) 3 694 110 250 62 55 102 26 5
Nitossolo Vermelho (Nitisol) 10 654 55 247 31 99 51 17 3
Argissolo Amarelo (Acrisol) 4 587 109 176 61 238 101 17 5
Latossolo Amarelo (Ferralsol) 3 576 110 181 62 243 102 19 5
Cambissolo Háplico (Cambisol) 4 538 79 315 44 146 72 17 3
Chernossolo Háplico (Chernozem) 1 537 113 287 64 175 103 16 7
Argissolo Amarelo (Acrisols) 7 505 64 253 36 242 59 17 3
Chernossolo Argilúvico (Chernozem) 5 455 78 380 44 165 72 16 3
Cambissolo Húmico (Cambisol) 9 436 55 341 31 222 51 24 3
Argissolo Vermelho Amarelo (Acrisol) 18 435 49 163 28 402 45 12 2
Latossolo Vermelho Amarelo (Ferralsol) 2 409 110 245 62 346 102 12 5
Neossolo Litólico (Leptosol) 1 163 113 77 64 761 103 7 7
Neossolo Quartzarênico (Arenosol) 7 41 64 26 36 933 59 7 3
Table 4. Number of horizons (n), mean values and standard error (SE) of the estimate for clay, silt, sand and organic matter (OM) contents in soils grouped by soil classes in the State of Santa Catarina
(1) Embrapa (2006).
texture (Embrapa, 2006) and medium OM contents (20 to 25 g kg-1); and also in the soils derived from
granite, which gives rise to soils with sandy texture with medium OM contents (35 g kg-1), differing from
the other soils in the high gravel (186 g kg-1) and
coarse sand (356 g kg-1) contents (Table 5).
The effect of increased density and clay contents increased FC and to a greater extent, PWP for most of the subsurface horizons, with a mean value of 0.04 cm3 cm-3 in FC and of 0.07 cm3 cm-3
in PWP. The greatest moistures in FC and in PWP were observed in the soils derived from the following lithologies: muscovite garnet schist, siltstones and
fine sandstones, parametamorphic, amygdaloidal basalt and mafic granulite, in which FC and PWP i n c r e a s e d u p t o 0 . 1 3 a n d 0 . 1 8 c m3 c m- 3,
respectively, in relation to those observed in the surface horizons. This difference is principally due to the increase in the clay content (192 to 417 g kg-1)
(Table 6).
Lithology FC PWP AW
Mean SE(1) Mean SE Mean SE
cm3 cm-3 Surface horizon
Basaltic Andesite 0.54 ab 0.07 0.38 ab 0.05 0.16 abc 0.03
Basalt 0.51 a 0.02 0.38 a 0.01 0.13 bc 0.01
Dacite 0.50 ab 0.04 0.37 ac 0.03 0.13 abc 0.02
Shale 0.49 abc 0.04 0.34 abd 0.03 0.15 ab 0.02
Gneiss 0.49 abc 0.04 0.34 abd 0.03 0.15 ab 0.02
Mafic Granulite 0.48 abc 0.05 0.36 ab 0.03 0.12 bc 0.02
Rhyodacite 0.46 abc 0.07 0.36 abd 0.05 0.11 bc 0.03
Siltstones 0.44 abc 0.07 0.22 def 0.05 0.21 a 0.03
Hornblendite 0.42 abc 0.07 0.28 abde 0.05 0.14 abc 0.03
Amygdaloidal Basalt 0.41 bc 0.03 0.29 bde 0.02 0.13 bc 0.01
Muscovite Garnet Schist 0.41 abcd 0.07 0.27 bcde 0.05 0.14 abc 0.03
Parametamorphic 0.41 abcd 0.07 0.30 abde 0.05 0.10 bc 0.03
Migmatite 0.40 abcde 0.07 0.27 bcde 0.05 0.12 abc 0.03
Siltstones and fine Sandstones 0.35 bcde 0.07 0.21 e f 0.05 0.14 abc 0.03
Sandstones and Siltstones 0.34 cde 0.07 0.20 e f 0.05 0.14 abc 0.03
Botucatu Sandstone 0.25 def 0.05 0.14 fg 0.03 0.12 bc 0.02
Granite 0.21 e f 0.07 0.12 fg 0.05 0.08 bc 0.03
Recent Alluvial Deposits 0.16 f 0.04 0.07 g 0.03 0.09 c 0.02
Subsurface horizon
Basaltic Andesite 0.55 ab 0.05 0.44 ab 0.05 0.11 ns 0.02
Dacite 0.53 a 0.03 0.43 ab 0.03 0.11 0.01
Mafic Granulite 0.53 abc 0.03 0.43 ab 0.03 0.10 0.01
Basalt 0.52 a 0.01 0.43 a 0.01 0.09 0.01
Amygdaloidal Basalt 0.52 abc 0.02 0.42 a 0.02 0.10 0.01
Muscovite Garnet Schist 0.52 abc 0.05 0.43 ab 0.05 0.09 0.02
Parametamorphic 0.50 abc 0.05 0.42 abc 0.05 0.08 0.02
Rhyodacite 0.50 abc 0.05 0.43 abc 0.05 0.07 0.02
Hornblendite 0.48 abcd 0.05 0.35 abcd 0.05 0.13 0.02
Siltstones and fine Sandstones 0.48 abcd 0.05 0.39 abc 0.05 0.09 0.02
Shale 0.47 abcd 0.03 0.37 abc 0.03 0.10 0.01
Gneiss 0.47 abcd 0.03 0.37 abc 0.03 0.10 0.01
Migmatite 0.46 abcd 0.05 0.37 abcd 0.05 0.09 0.02
Siltstones 0.42 bcd 0.05 0.29 cde 0.05 0.13 0.02
Sandstones and Siltstones 0.36 def 0.05 0.24 def 0.05 0.12 0.02
Granite 0.28 efg 0.05 0.19 efg 0.05 0.08 0.02
Botucatu Sandstone 0.24 fg 0.05 0.14 fg 0.05 0.09 0.02
Recent Alluvial Deposits 0.20 g 0.03 0.10 g 0.03 0.10 0.01
Table 5. Soil moisture at field capacity (FC), permanent wilting point (PWP), and available water content (AW), in soils grouped by lithology in the State of Santa Catarina
Using lithology as a fixed effect, large differences were observed in FC and in PWP among soils with different lithologies. In the surface horizons, FC ranged from 0.16 cm3 cm-3 in the soils of recent
alluvial deposits to 0.54 cm3 cm-3 in the soils derived
from Basaltic Andesite, while PWP ranged from 0.07 to 0.38 cm3 cm-3 among these lithologies (Table 5).
In the subsurface horizons with these same
lithologies, FC ranged from 0.20 to 0.55 cm3 cm-3,
and PWP from 0.10 to 0.44 cm3 cm-3. These
differences result in an amplitude of 0.38 cm3 cm-3
in FC and of 0.31 cm3 cm-3 in PWP in the surface
horizons and 0.35 cm3 cm-3 in FC and 0.34 cm3 cm-3
in PWP of the subsurface horizons (Table 5). This amplitude shows the importance of determination of water retention in soils that occur in a certain region
Textural class Clay Silt Sand OM
n Content SE Content SE Content SE Content Se
g kg-1 Surface horizon
Rhyodacite 4 669 132 308 91 23 70 55 34
Basalt 30 588 37 305 25 107 19 62 10
Dacite 9 587 76 354 53 59 40 60 21
Basaltic andesite 2 464 133 397 91 140 70 62 36
Migmatite 5 409 133 227 91 364 70 33 36
Shale 4 384 77 378 53 238 41 48 21
Mafic Granulite 3 373 94 273 65 353 50 50 26
Amygdaloidal basalt 11 355 50 451 35 194 27 57 14
Gneiss 2 335 133 261 91 405 70 34 36
Siltstones 1 323 133 322 91 355 70 38 36
Parametamorphic 1 266 133 194 92 540 70 45 36
Hornblendite 1 211 133 286 92 504 70 40 36
Muscovite garnet schist 2 206 133 344 92 449 70 36 36
Sandstones and siltstones 3 172 133 123 91 704 70 17 36
Siltstones and fine sandstones 3 171 132 359 91 470 70 19 34
Granite 4 140 132 143 91 717 70 21 34
Botucatu sandstone 5 137 94 79 65 784 50 14 26
Recent alluvial deposits 4 37 77 20 53 943 41 12 21
Subsurface horizon
Rhyodacite 3 798 112 183 77 19 63 22 5
Basalt 32 687 33 227 22 86 18 21 2
Muscovite garnet schist 7 624 112 159 77 218 63 16 5
Dacite 3 622 65 323 45 56 37 26 3
Amygdaloidal basalt 3 594 43 295 29 111 24 16 2
Basaltic andesite 4 592 112 279 77 129 63 26 5
Siltstones and fine sandstones 14 587 112 176 77 238 62 17 5
Migmatite 4 576 112 181 77 243 63 19 5
Parametamorphic 8 570 112 111 77 319 62 10 5
Mafic granulite 9 565 79 186 54 248 44 14 3
Shale 5 538 65 264 44 197 36 16 3
Gneiss 2 409 113 245 77 346 63 12 5
Siltstones 2 331 113 339 77 329 63 12 5
Hornblendite 3 294 113 303 77 404 63 19 5
Granite 3 247 112 168 77 585 63 16 5
Sandstones and siltstones 1 226 112 163 77 611 63 5 5
Botucatu sandstone 7 163 115 77 78 761 66 7 5
Recent alluvial deposits 3 41 65 26 45 933 37 7 3
when simulation models are used that involve soil physical-water processes.
In accordance with the differences observed in FC and in PWP, the AW content ranged from 0.08 to 0.21 cm3 cm-3 in the surface horizons. Nevertheless,
the greater water retention capacity of some soils did not result in greater water availability to plants, since the AW contents were highest in soils derived from siltstones and lowest in those derived from granite and from recent alluvial deposits (Table 5). The AW content in the soils of the other lithologies was intermediate. The greater AW content in soils of Santa Catarina derived from siltstones occurred through more balanced particle size distribution, with clay, silt and sand contents very near the 1/3 ratio of each fraction, and also due to the greater contents of very fine sand (172 g kg-1) in comparison to the soils of the
other lithologies (5-99 g kg-1). The lower AW content
in soils of Santa Catarina derived from recent alluvial deposits, however, occurred due to their lower OM and very fine sand content (Table 6).
In the subsurface horizons, the mean AW contents ranged from 0.07 to 0.13 cm3 cm-3, but there was no
significant difference due to their high variability in soils with the same lithology. Thus, in the subsurface horizons of the soils of SC, the mean AW content is 0.10 cm3 cm-3.
CONCLUSIONS
1. In the soils of Santa Catarina, water retention is greatest in clayey, silty and loamy soils, which have greater organic matter content, with small differences in water retention between the soil textural classes, due to higher field capacity and permanent wilting point. In contrast, water availability is greatest in the clayey loam and silty loam textural classes, also with highest organic matter contents, and lowest in the sand textural class. In addition, the greater water availability in the surface horizons in comparison to the subsurface horizons proves the importance of organic matter in water retention and availability.
2. Soil moisture at field capacity and at the permanent wilting point is highest in the Cambissolos (Cambisols) (especially in Cambissolos Húmicos), Nitossolos (Nitisols) and Latossolos (Ferralsols); intermediate in the Argissolos (Acrisols), Neossolos Litólicos (Leptosols) and Chernossolos (Chernozems); and lowest in the Neossolos Quartzarênicos (Arenosols). Greater water availability occurs in the Cambissolos Húmicos (Humic Cambisols) and the Neossolos Litólicos (Leptosols) located in the Planalto Serrano of Santa Catarina, mainly due to their high organic matter contents. Nevertheless, it is also important to remember that crops exploit distinct soil layers during their vegetative cycles and, for this reason, the quantity of water available also depends
on the thickness of the soil horizons, especially of the surface horizons.
3. Water retention is highest in soils derived from extrusive igneous rocks from the Serra Geral Formation, metamorphic rocks, intrusive igneous rocks and fine-textured sedimentary rocks; it is intermediate in soils derived from medium-textured sedimentary rocks; and lowest retention occurs in soils derived from rocks or quartz-rich sedimentary deposits. The available water content is greatest in soils derived from siltstones and lowest in soils derived from granite and from recent alluvial deposits.
ACKNOWLEDGEMENTS
To the Universidade do Estado de Santa Catarina, to the CAPES, to the CNPq for granting a scholarship to the first author and research award scholarship to the second author, to the FAPESC for granting a research initiation award to the third author and to Professor Jaime Antônio de Almeida for his help with the classification of the soil profiles.
LITERATURE CITED
AL MAJOU, H.; BRUAND, A.; DUVAL, O. & COUSIN, I. Prediction of soil water retention properties after stratification by combining texture, bulk density and the type of horizon. Soil Use Manage., 24:383-391, 2008. ALMEIDA, J.A.; KÄMPF, N. & ALMEIDA, R. Caracterização
mineralógica de Cambissolos originados de rochas pelíticas nos patamares do alto rio Itajaí e no planalto de Lages. R. Bras. Ci. Solo, 21:181-190, 1997.
ALMEIDA, J.A.; TORRENT, J. & BARRÓN, V. Cor de solo, formas de fósforo e adsorção de fosfato em latossolos desenvolvidos de basalto do extremo-sul do Brasil. R. Bras. Ci. Solo, 27:985-1002, 2003.
BASTET, G. Estimation des propriétés de rétention en eau des sols à l’aide de fonctions de pédotransfert: développement de nouvelles approches. Orléans,’Université d’Orléans, 1999. (Tese de Doutorado) BATJES, N.H. Development of a world data set of soil water retention properties using pedotransfer rules. Geoderma, 71:31-52, 1996.
BRAIDA, J.A.; BAYER, C.; ALBUQUERQUE, J.A. & REICHERT, J.M. Matéria orgânica e seu efeito na física do solo. In: KLAUBERG FILHO, O.; MAFRA, A.L. & GATIBONI, L.C., eds. Tópicos em ciência do solo. Viçosa, MG, Sociedade Brasileira de Ciência do Solo, 2011. v.7. p.221-278.
BRUAND, A. Preliminary grouping of soils. In: PACHEPSKY, Y. & RAWLS, W.J., eds. Development of pedotransfer functions in soil hydrology. Develop. Soil Sci., 30:159-174, 2004a.
BRUAND, A. Utilizing mineralogical and chemical information in PTFs. In: PACHEPSKY, Y. & RAWLS, W.J., eds. Development of pedotransfer functions in soil hydrology. Develop. Soil Sci., 30:153-158, 2004b.
BUCKMAN, H.O. & BRADY, N.C. The nature and properties of soils. New York, The MacMillan, 1964. 588p.
CHEN, J.S. & CHIU, C.Y. Effect of topography on the composition of soil organic substances in a perhumid sub-tropical mountain forest ecosystem in Taiwan. Geoderma, 96:19-30, 2000.
CORRÊA, J. Mineralogia e gênese das principais classes de solos de encostas basálticas do estado de Santa Catarina. Lages, CAV/UDESC, 2003. 110p. (Dissertação de Mestrado)
COSTA, A.; ALBUQUERQUE, J.A.; MAFRA, A.L. & SILVA, F.R. Propriedades físicas do solo em sistemas de manejo do solo na integração agricultura pecuária. R. Bras. Ci. Solo, 33:235-244, 2009.
COSTA, A. Retenção e disponibilidade de água em solos de Santa Catarina: Avaliação e geração de funções de pedotransferência. Lages, CAV/UDESC, 2012. 430p. (Tese de Doutorado)
DALMOLIN, R.S.D.; GONÇALVES, C.N.; DICK, D.P.; KNICKER, H.; KLAMT, E. & KOGEL-KNABNER, I. Organic matter characteristics and distribution in Ferralsols profiles of a climosequence in Southern Brazil. Eur. J. Soil Sci., 57:644-654, 2006.
DAY, P. Particle fractionation and particle-size analysis. In: BLACK, C.A., ed. Methods of soil analysis. Physical and mineralogical methods. 2.ed. Madison, American Society of Agronomy, 1965. p.545-567.
DIECKOW, J.; BAYER, C.; CONCEIÇÃO, P.C.; ZANATTA, J.A.; MARTIN NETO, L.; MILORI, D.M.B.P.; SALTON, J.C.; MACEDO, M.M.; MIELNICZUK, J. & HERNANI, L.C. Land use, tillage, texture and organic matter stock and composition in tropical and subtropical Brazilian soils. Eur. J. Soil Sci., 60:240-249, 2009.
EMPRESA BRASILEIRA DE PESQUISA AGROPECUÁRIA -EMBRAPA. Centro Nacional de Pesquisa de Solos. Sistema brasileiro de classificação de solos. 2.ed. Rio de Janeiro, 2006. 306p.
EMPRESA BRASILEIRA DE PESQUISA AGROPECUÁRIA -EMBRAPA. Solos do Estado de Santa Catarina. Rio de Janeiro, Embrapa Solos, 2004. CD-ROM; mapa color. (Embrapa Solos. Boletim de Pesquisa e Desenvolvimento, 46)
EPAGRI/CIRAM. Zoneamento agroecológico e socioeconômico do estado de Santa Catarina. Florianópolis, Epagri, 2002. Available at: <http://www.ciram.com.br/ciram_arquivos/ a r q u i v o s / p o r t a l / a g r i c u l t u r a / z o n e A g r o e c o l o g i c o / ZonAgroeco.pdf>. Accessed on Dec. 19, 2011.
FAO. The digitized soil map of the world. World soil resources, Report 67 (Release 1.0). Rome, FAO, 1991.
GAISER, T.; GRAEF, F. & CORDEIRO, J.C. Water retention characteristics of soils with contrasting clay mineral composition in semi-arid tropical regions. Aust. J. Soil Res., 38:523-526, 2000.
HILLEL, D. Environmental soil physics. San Diego, Academic Press, 1998. 771p.
HODNETT, M.G. & TOMASELLA, J. Marked differences between van Genuchten soil water-retention parameters for temperate and tropical soils: A new water-retention pedo-transfer functions developed for tropical soils. Geoderma, 108:155-180, 2002
KÖPPEN, W. & GEIGER, R. Klimate der Erde. Gotha, Verlag Justus Perthes, 1928. Wall-map 150 x 200 cm.
MORALES, C.A.S.; ALBUQUERQUE, J.A.; ALMEIDA, J.A.; MARANGONI, J.M.; STAHL, J. & CHAVES, D.M. Qualidade do solo e produtividade de Pinus taeda no planalto catarinanse. Ci. Flor., 20:629-640, 2010. NETTLETON, W.D. & BRASHER, B.R. Correlation of clay
minerals and properties of soils in the Western United States. Soil Sci. Soc. Am. J., 47:1032-1036, 1983. OADES, J.M. The retention of organic matter in soils.
Biogeochemistry, 5:35-70, 1988.
PAES SOBRINHO, J.B.; ALMEIDA, J.A. & ERHART, J. Mineralogia, propriedades químicas e classificação de solos das Serras do Leste Catarinense. R. Ci. Agrovet., 8:9-24, 2009. PETERSEN, G.W.; CUNNINGHAM, R.L. & MATELSKI, R.P. Moisture characteristics of Pennsylvania soils: I. Moisture retention as related to texture. Soil Sci. Soc. Am. J., 32:271-275, 1968.
RAWLS, W.J.; PACHEPSKY, Y.A.; RITCHIE, J.C.; SOBECKI, T.M. & BLOODWORTH, H. Effect of soil organic carbon on soil water retention. Geoderma, 116:61-76, 2003. RAWLS, W.J.; BRAKENSIEK, D.L. & SAXTON, K.E.
Estimation of soil water properties. Trans. Am. Soc. Agric. Eng., 25:1316-1320, 1328, 1982.
REICHERT, J.M.; ALBUQUERQUE, J.A.; KAISER, D.R.; REINERT, D.J.; URACH, F.L. & CARLESSO, R. Estimation of water retention and availability for Rio Grande do Sul soils. R. Bras. Ci. Solo, 33:1547-1560, 2009. REINERT, D.J. & REICHERT, J.M. Coluna de areia para medir a retenção de água no solo: Protótipos e teste. Ci. Rural, 36:1931-1935, 2006.
RESURRECCION, A.C.; MOLDRUP, P.; TULLER, M.; FERRE, T.P.A.; KAWAMOTO, K.; KOMATSU, T. & JONGE, L.W. Relationship between specific surface area and the dry end of the water retention curve for soils with varying clay and organic carbon contents. Water Resour. Res., 47:W06522, 2011. RICHARDS, L. Methods of measuring moisture tension. Soil
Sci., 58:95-112, 1949.
SANTOS, R.D.; LEMOS, R.C.; SANTOS, H.G.; KER, J.C. & ANJOS, L.H.C. Manual de descrição e coleta de solo no campo. 5.ed. Viçosa, MG, Sociedade Brasileira de Ciência do Solo, 2005. 100p.
SOIL SURVEY STAFF. Soil characterization and profile description data. Lincoln, NE, Soil Survey Laboratory, Natural Resources Conservation Service, USDA, 1995. CD-ROM
TATE, K.R. Assessment, based on a climosequence of soils in tussock grasslands, of soil carbon storage and release in response to global warming. J. Soil Sci., 43:697-707, 1992.
TEDESCO, M.J.; GIANELLO, C.; BISSANI, C.A.; BOHNEN, H. & VOLKWEISS, S.J. Análise de solo, plantas e outros materiais. Porto Alegre, Universidade Federal do Rio Grande do Sul, 1995. 174p.
VEIGA, M.; REINERT, D.J.; REICHERT, J.M. & KAISER, D.R. Short and long-term effects of tillage systems and nutrient sources on soil physical properties of a Southern Brazilian Hapludox. R. Bras. Ci. Solo, 32:1437-1446, 2008. ZANINI, L.F.P.; BRANCO, P.M.; CAMOZZATO, E. &
RAMGRAB, G.E., orgs. Programa de levantamentos básicos geológicos do Brasil, Folhas Florianópolis/Lagoa, SG.22-Z-D-V/IV, Estado de Santa Catarina: escala 1:100.000. Brasília, DNPM/CPRM, 1997. 223p