PEDOTRANSFER FUNCTIONS TO ESTIMATE RETENTION
AND AVAILABILITY OF WATER IN SOILS OF THE STATE OF
SANTA CATARINA, BRAZIL
(1)André da Costa(2), Jackson Adriano Albuquerque(3), Jaime Antônio de Almeida(3), Adriano da Costa(4) & Rodrigo Vieira Luciano(5)
SUMMARY
Studies on water retention and availability are scarce for subtropical or humid temperate climate regions of the southern hemisphere. The aims of this study were to evaluate the relations of the soil physical, chemical, and mineralogical properties with water retention and availability for the generation and validation of continuous point pedotransfer functions (PTFs) for soils of the State of Santa Catarina (SC) in the South of Brazil. Horizons of 44 profiles were sampled in areas under different cover crops and regions of SC, to determine: field capacity (FC, 10 kPa), permanent wilting point (PWP, 1,500 kPa), available water content (AW, by difference), saturated hydraulic conductivity, bulk density, aggregate stability, particle size distribution (seven classes), organic matter content, and particle density. Chemical and mineralogical properties were obtained from the literature. Spearman’s rank correlation analysis and path analysis were used in the statistical analyses. The point PTFs for estimation of FC, PWP and AW were generated for the soil surface and subsurface through multiple regression analysis, followed by robust regression analysis, using two sets of predictive variables. Soils with finer texture and/or greater organic matter content retain more moisture, and organic matter is the property that mainly controls the water availability to plants in soil surface horizons. Path analysis was useful in understanding the relationships between soil properties for FC, PWP and AW. The predictive power of the generated PTFs to estimate FC and PWP was good for all horizons, while AW was best
(1) Part of the doctoral thesis dissertation of the first author. Received for publication on March 9, 2012 and approved on May 23, 2013. (2) Post-doctoral candidate in Soil Physics at the Universidade Federal de Santa Maria, campus UFSM. Av. Roraima, 1000, Bairro
Camobi. CEP 97105-900 Santa Maria (RS), Brazil. PNPD Institutional Scholarship holder, Capes. E-mail: [email protected]
(3) Professor of the Soil Department at the Universidade do Estado de Santa Catarina, Centro de Ciências Agroveterinárias
-UDESC-CAV. Av. Luís de Camões, 2.090. Conta Dinheiro. CEP 88520-000 Lages (SC), Brazil. CNPq Researcher. E-mail: [email protected]; [email protected]
estimated by more complex models with better prediction for the surface horizons of soils in Santa Catarina.
Index terms: field capacity, permanent wilting point, plant available water, correlation analysis, path analysis.
RESUMO: FUNÇÕES DE PEDOTRANSFERÊNCIA PARA ESTIMAR A
RETENÇÃO E DISPONIBILIDADE DE ÁGUA EM SOLOS DE SANTA CATARINA, BRASIL
Estudos sobre a retenção e disponibilidade de água são escassos para as regiões de clima subtropical ou temperado úmido do hemisfério sul. O objetivo deste estudo foi avaliar as relações dos atributos físicos, químicos e mineralógicos do solo com a retenção e a disponibilidade de água para utilizá-los na geração e validação de funções de pedotransferência (FPTs) pontuais contínuas para solos do Estado de Santa Catarina (SC), sul do Brasil. Foram amostrados horizontes de 44 perfis, em áreas sob diferentes coberturas vegetais e regiões de SC, e determinados a capacidade de campo (CC, 10 kPa), o ponto de murcha permanente (PMP, 1.500 kPa), o conteúdo de água disponível (AD), a condutividade hidráulica saturada, a densidade do solo, a estabilidade de agregados, a granulometria (sete classes), o teor de matéria orgânica e a densidade de partículas. Atributos químicos e mineralógicos foram obtidos da literatura. Realizou-se a análise estatística por meio da análise de correlação de postos de Spearman e da análise de trilha. As FPTs pontuais para estimativa da CC, PMP e AD foram geradas para os horizontes superficiais e subsuperficiais dos solos pela análise de regressão de múltipla, seguida da análise de regressão robusta, utilizando dois conjuntos de variáveis preditoras. Os solos com textura mais fina e, ou, com maior teor matéria orgânica retêm maior conteúdo de água, sendo a matéria orgânica o principal atributo que controla a disponibilidade de água para as plantas nos horizontes superficiais do solo. A análise de trilha evidenciou-se útil no entendimento das relações entre os atributos do solo com a CC, o PMP e a AD. As FPTs geradas estimaram com boa capacidade preditiva a CC e o PMP para todos os horizontes, enquanto a AD foi mais bem estimada por modelos mais complexos e com melhor predição nos horizontes superficiais dos solos de SC.
Termos de indexação: capacidade de campo, ponto de murcha permanente, conteúdo de água disponível, análise de correlação, análise de trilha.
INTRODUCTION
Water retention and availability in the soil affect plant growth and crop yield. This property depends on particle size distribution, structure, mineralogy and organic matter content, among other factors, which are quite variable in space and time (Nielsen et al., 1973; Souza et al., 2004). For the choice of soils suited for certain crops, adequate crop management systems or simulation models to project scenarios, the relationship between soil properties and water retention and availability must be understood.
The direct measurement of most soil hydraulic properties is time-consuming, expensive and variable over time. Furthermore, in regions with a great diversity of soil types, water retention and availability vary widely among different soil areas. This relationship has been extensively studied in developed countries, especially in those with a temperate climate (Rawls et al., 1982; Wösten et al., 1999; Saxton & Rawls, 2006). Nevertheless, in developing countries, especially with a tropical climate, studies of this kind are still fairly few (Hartemink, 2002).
To minimize the difficulty of direct determination and the lack of a large database containing the basic properties and those of water retention and availability for various soil classes, pedotransfer functions (PTFs) can be used, as explained by Bouma (1989). These PTFs allow an estimation of the properties that are more difficult and more expensive to measure from other available soil properties.
properties related to water retention and availability in soils of the State of Santa Catarina were determined only occasionally, with the purpose of evaluating the effect of a certain type of management or use of a soil class, but rarely the soil subsurface horizons (Veiga et al., 2008; Costa et al., 2009; Morales et al., 2010). In this scenario, the goals of this study were to create a database to evaluate the relations of soil chemical, physical and mineralogical properties with water retention and availability and also use the data to generate and validate continuous point pedotransfer functions of soils in the State of Santa Catarina, in the South of Brazil.
MATERIAL AND METHODS
Database
The study was carried out with 44 profiles, representing the main soil classes of Santa Catarina, with different chemical, physical and mineralogical properties, representing the following soil types (number of profiles): Acrisols (9), Cambisols (6), Chernozems (3), Ferralsols (6), Leptosols (4), Arenosols (3), and Nitisols (13).
In each of these profiles, samples were collected from the horizons A, AB, BA and B, when present in the soil, and their subdivisions (e.g., A1, A2, B1, B2, ...), and from the horizons A and C of the Arenosols. Undisturbed samples were collected with soil sample rings (diameter 6.0 cm, height 2.5 cm). In the 200 horizons, soil was taken from the middle part, as quadruplicate samples of undisturbed soil (800 samples) and composite samples of disturbed soil (200 samples).
The soil of the undisturbed samples was saturated with water and subjected to suctions of 1, 6 and 10 kPa in a sand suction column (Reinert & Reichert, 2006) and suctions of 33, 100, 300, 500, and 1,500 kPa in a Richards’ chamber (Richards, 1949). Field capacity (FC) was considered as the volumetric moisture at a suction of 10 kPa (pores with diameter <30 µm); the permanent wilting point (PWP) as the volumetric moisture at a suction of 1,500 kPa (pores with diameter <0.2 µm); and the available water content (AW) as the volumetric moisture lost between suctions of 10 and 1,500 kPa. The saturated hydraulic conductivity of the soil was determined in a variable head permeameter, as described by Gubiani et al. (2010) for undisturbed samples.
Particle size distribution was assessed by the pipette method, according to Day (1965), to determine the clay, silt and sand contents. The sand content was divided into five classes as described by USDA (1993). The total organic carbon (TOC) content was determined by the Walkley & Black method, modified by Tedesco et al. (1995), and the organic matter (OM)
content was calculated by multiplying total organic carbon by 1.724. Aggregate stability was determined by means of wet sieving of the aggregates from 8.00 to 4.76 mm, according to the traditional method of Kemper & Chepil (1965), and expressed by the mean geometric diameter (MGD).
In addition to the laboratory determinations, a database was created with data of soil physical, chemical and mineralogical properties from the studies of Almeida et al. (1997, 2000, 2003); Corrêa (2003); SBCS (2008); Paes Sobrinho et al. (2009); and Bringhenti (2010). All studies were carried out with soils from Santa Catarina, for which potential CEC, effective CEC and clay activity were obtained using two methods, of which one, called “TCLAY”, discounting the effect of organic carbon on the soil CEC (Embrapa, 1988), and the other, called “TSOIL”, disregards this effect (Embrapa, 2006).
Statistical Analysis Correlation Analysis
The soil variables that form the database were subjected to the Shapiro-Wilk normality test. Since the distribution of most variables, especially field capacity, permanent wilting point and available water content was not normal, the relation between soil physical, chemical or mineralogical properties and the water retention and availability properties was evaluated by Spearman’s rank correlation analysis (ρ), using program SAS 9.2 (SAS, 2010), which does not assume normal data distribution.
Path Analysis
After Spearman’s rank correlation analysis, some correlation coefficients (ρ) were partitioned into direct and indirect effects through path analysis. This method allows an analysis of the effects of some independent variables on a basic variable (Cruz, 2006). The non-use of the sand and clay contents in a single regression model was due to the high correlation coefficient between these two variables, which resulted in a high collinearity of variables. This destabilizes the estimates of the coefficients in the regression model and can greatly inflate the standard error of the coefficients (Belsley et al., 1980). The clay content was therefore excluded from the multiple regression model. The physical properties FC, PWP and AW were used as (individually) predicted variables and the following physical properties were used as predictive variables: sand (divided into five classes), silt and OM contents and particle density. These regression models were analyzed separately for the surface and subsurface horizons.
than 10, indispensable in multiple regression models. As all models met this requirement, the correction matrix among the predicted and predictive variables was subjected to path analysis using software GENES (Cruz, 2006).
Generation and validation of the PTFs
The generation and validation of PTFs to estimate water retention and availability were based on the division of the database. The PTFs were generated with 75 % of the horizons and validated with the remaining 25 %. In preliminary studies, it was observed that water retention and availability differed between the soil surface and subsurface horizons. Thus, each PTF was generated from two data sets: (a) samples from surface horizons (horizons O, A, AB and divisions); and (b) samples from subsurface horizons (horizons BA, B and divisions, and C of the Arenosols). The same division was used for the validation database.
The continuous point PTFs for estimating FC, PWP and AW were obtained by multiple regression analysis, using the stepwise option available in the
Proc Reg procedure of the program SAS 9.2 (SAS, 2010). This option selects the main variables among a set of independent variables at a pre-established level of significance and generates a coefficient for each one of the independent variables selected. In this study, the level of significance of the selected variables was established at less than or equal to 5 % (p 0.05) and the independent variables changed as a function of the two models (sets of predictive variables) analyzed. After selecting the predictive variables of each PTF, robust regression analysis was used, through the proc robustreg procedure of the program SAS 9.2 (SAS, 2010) to eliminate the undesired effects of outliers and leverages on the fitting of the multiple regression parameters of each PTF. In this procedure, the LTS method was used, introduced by Rousseeuw (1984), which is highly robust for fitting of linear models since if approximately half of the data with reference to the median have outliers, the LTS estimator will fit a data set well with around 50 % of the remaining observations. In relation to the models of predictive variables, the following were used:
Simple model: Soil texture, organic matter and their interactions
In this model, point PTFs were generated for estimation of FC, PWP and AW using the contents of clay (a), silt (b) and sand (c) and of OM (d) in three distinct forms as predictive variables:
- additive effect with variables on a non-transformed scale (x);
- additive effect with variables on a transformed scale: raised to the square (x2); square root ( x); inverse (1/x); inverse square (1/x2); inverse square root (1/ x); natural logarithm (ln(x)); natural logarithm of the square (ln(x2)); natural logarithm of the inverse (ln(1/x)); and natural logarithm of the inverse square (ln(1/x2));
- multiplicative effect with independent variables multiplied with each other, combined two by two, in a non-transformed scale (a*b; a*c; a*d; b*c; b*d; c*d) and raised to the square (a2*b2; a2*c2; b2*c2).
Consequently, 56 independent variables were made available to select the best predictive variables by the statistical program.
Full model: Five classes of sand, silt, clay, organic matter, bulk density, particle density, total porosity and their interactions
In this model, point PTFs were generated to estimate FC, PWP and AW using the predictive variables: clay (a), silt (b) and total sand (c) contents; the OM (d) contents; bulk density (e); particle density (f); total porosity (g) and also sand fractionation in five size classes: very coarse (h); coarse (i); medium (j); fine (k) and very fine (l) sand, according to the diameter classes of the USDA (1993). In this model, the independent variables were also used in three distinct forms: additive effect with variables on a non-transformed scale; additive effect with variables on a transformed scale; and multiplicative effect with independent variables multiplied with each other, combined two by two, on a non-transformed scale. Consequently, 183 independent variables were made available to select the best predictive variables by the statistical program.
Statistical Indicators
For each one of the PTFs, the following statistical indicators were calculated for the generation and validation database:
Root mean square deviation (RMSD), obtained by the equation:
2 1 1 ( ) n m e i
RMSD = i i
n q q
=
-å
where: n is the number of samples; θim is the
measured soil moisture; and θieis the soil moisture
estimated by the PTF.
RMSD is widely used in studies with PTFs (van den Berg et al., 1997; Saxton & Rawls, 2006; Reichert et al., 2009), which allows a comparison of the values obtained for the PTFs in soils of Santa Catarina with values from the literature.
Mean deviation (MD): analyzes the trend to over-or underestimate the predicted values by the models. The mean deviation was calculated by the following equation:
1
1 n ( )
m e i
MD = i i
n q q
=
-å
where: n is the number of samples; θim is the
The MD ranges from - to + . For mean deviation below zero, the observed values were overestimated; and for mean deviation greater than zero, the observed values were underestimated. The optimum value of the mean deviation is zero. The lower the magnitude of the values, the greater will be the accuracy of the prediction model. Although the mean deviation is widely used to assess PTFs, this indicator is sensitive to extreme values (outliers), and insensitive to proportional differences between model predictions and measured data. Thus, the mean deviation should not be used in an isolated manner to analyze the tendency of under- or overestimation, but rather together with graph analysis.
Nash-Sutcliffe Efficiency Index (EF): calculated by the following equation:
2 1 2 1 ( ) 1 ( ) n m e i n m m i i i EF i mean q q q q = = é ù -ê ú ê ú =
-ê - ú
ê ú
ë û
å
å
where: n is the number of samples; θim is the ith observation of the measured soil moisture; θieis the ith observation of the soil moisture estimated by the pedotransfer function; and θmeanm is the mean of the
measured soil moisture.
The EF is a normalized statistic which determines the relative magnitude of the residual variance compared to the variance of the measured data (Nash & Sutcliffe, 1970). The EF indicates how well the relation between the observed and simulated data fit in relation to the 1:1 straight line, ranging from to one, with the optimum value EF=1.0. Values of EF
between zero and one are generally seen as acceptable levels, while values of EF<0 indicate that the mean of the observed values is better than the values estimated by the model, i.e., an unacceptable level of performance.
Index of agreement (d): developed by Willmott (1981), was calculated by the following equation:
2 1 2 1 ( ) 1 (| | | |) n m e i n
m m e m
i
i i
d
i mean i mean
q q
q q q q
= = é ù -ê ú ê ú = -ê ú - + -ê ú ë û
å
å
where: n is the number of samples; θim is the ith
observation of measured soil moisture; θieis the ith observation of the soil moisture estimated by the pedotransfer function; and θmeanm is the mean of the measured soil moisture.
The index of agreement is the standardized measure of the degree of error of the model prediction and ranges from 0 to 1. A value of d = 1 indicates perfect agreement between the measured and predicted values, while d = 0 indicates lack of
agreement between the two variables (Willmott, 1981). The agreement index represents the relation between the mean square error and the “potential error” (Willmott, 1981). The potential error corresponds to the sum of squares of the absolute values of the difference between the observed values and their mean, added to the absolute values of the difference between the estimated values and the mean of the observed values. The index of agreement can detect additive and proportional differences between the mean observed and estimated values and their variances. Nevertheless, d is sensitive to extreme values since the differences were squared.
Analysis of linear regression
The slope (a) and intercept (b) of the fitted regression equation between the measured and observed moisture values indicate the high similarity of the predicted and observed data. The slope shows the relative relation between the estimated and measured values and the intercept on the Y axis indicates the possibility of lag or advance of the model predictions compared with the measured moisture. The slope (=1) and the intercept on the y axis (=0) indicate that the model reproduced the magnitude of the measured moisture perfectly (Willmott, 1981). The slope and intercept of the y axis are generally analyzed assuming that the estimated and measured values are linearly related, which leads to two assumptions: (1) all errors of variance are contained in the estimated values; and (2) the measured data are error-free (Willmott, 1981). In this fit, the coefficient of determination (R2) was also obtained, which describes
the proportion of the sum of squares in the measured data explained by the model. The R2 ranges from zero
to one, and the greater its value, the lower the variance of the error will be. Although the R2 is widely used for evaluation of models, this indicator is oversensitive to extreme values (outliers) and insensitive to proportional or additive differences between the model predictions and measured data. The intercept and slope between the estimated (y) and the measured (x) moisture and R² were calculated by the minimum square method, by the procedure Proc Reg of SAS 9.2 (SAS, 2010).
Graph analysis: scatter plots were constructed
for the measured and PTF-estimated moistures, which allow a visual analysis of the data dispersion around the 1:1 straight line to check the quality of prediction of the PTFs.
RESULTS AND DISCUSSION
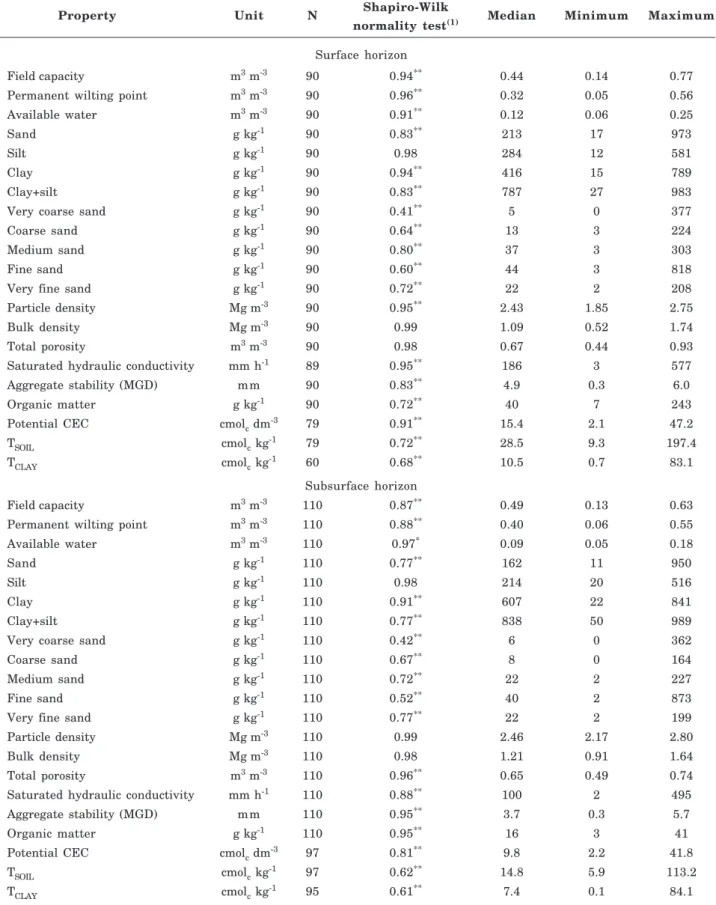
Property Unit N Shapiro-Wilk Median Minimum Maximum normality test(1)
Surface horizon
Field capacity m3 m-3 90 0.94** 0.44 0.14 0.77
Permanent wilting point m3 m-3 90 0.96** 0.32 0.05 0.56
Available water m3 m-3 90 0.91** 0.12 0.06 0.25
Sand g kg-1 90 0.83** 213 17 973
Silt g kg-1 90 0.98 284 12 581
Clay g kg-1 90 0.94** 416 15 789
Clay+silt g kg-1 90 0.83** 787 27 983
Very coarse sand g kg-1 90 0.41** 5 0 377
Coarse sand g kg-1 90 0.64** 13 3 224
Medium sand g kg-1 90 0.80** 37 3 303
Fine sand g kg-1 90 0.60** 44 3 818
Very fine sand g kg-1 90 0.72** 22 2 208
Particle density Mg m-3 90 0.95** 2.43 1.85 2.75
Bulk density Mg m-3 90 0.99 1.09 0.52 1.74
Total porosity m3 m-3 90 0.98 0.67 0.44 0.93
Saturated hydraulic conductivity mm h-1 89 0.95** 186 3 577
Aggregate stability (MGD) mm 90 0.83** 4.9 0.3 6.0
Organic matter g kg-1 90 0.72** 40 7 243
Potential CEC cmolc dm-3 79 0.91** 15.4 2.1 47.2
TSOIL cmolc kg-1 79 0.72** 28.5 9.3 197.4
TCLAY cmolc kg-1 60 0.68** 10.5 0.7 83.1
Subsurface horizon
Field capacity m3 m-3 110 0.87** 0.49 0.13 0.63
Permanent wilting point m3 m-3 110 0.88** 0.40 0.06 0.55
Available water m3 m-3 110 0.97* 0.09 0.05 0.18
Sand g kg-1 110 0.77** 162 11 950
Silt g kg-1 110 0.98 214 20 516
Clay g kg-1 110 0.91** 607 22 841
Clay+silt g kg-1 110 0.77** 838 50 989
Very coarse sand g kg-1 110 0.42** 6 0 362
Coarse sand g kg-1 110 0.67** 8 0 164
Medium sand g kg-1 110 0.72** 22 2 227
Fine sand g kg-1 110 0.52** 40 2 873
Very fine sand g kg-1 110 0.77** 22 2 199
Particle density Mg m-3 110 0.99 2.46 2.17 2.80
Bulk density Mg m-3 110 0.98 1.21 0.91 1.64
Total porosity m3 m-3 110 0.96** 0.65 0.49 0.74
Saturated hydraulic conductivity mm h-1 110 0.88** 100 2 495
Aggregate stability (MGD) mm 110 0.95** 3.7 0.3 5.7
Organic matter g kg-1 110 0.95** 16 3 41
Potential CEC cmolc dm-3 97 0.81** 9.8 2.2 41.8
TSOIL cmolc kg-1 97 0.62** 14.8 5.9 113.2
TCLAY cmolc kg-1 95 0.61** 7.4 0.1 84.1
Table 1. Descriptive statistics of different soil properties in surface and subsurface horizons of some soil profiles in the State of Santa Catarina
(1) H
0 Test: the sample is derived from a normal population, Ho is rejected when *: significant (0.01<p<0.05) and **: significant
The variation of FC, PWP and AW was large among the soils of Santa Catarina and the cause of these physical properties may be attributed to the differentiated performance of the soil formation factors (Embrapa, 2004); these soils developed on different lithologies, reliefs and altitudes (DNPM, 1987). The correlation coefficients between FC and PWP for the same variables were high (0.94 for the surface horizon and 0.96 for the subsurface horizon) (Table 2); in other words, these two properties can be discussed together.
However, AW differed from these two properties and correlated with a smaller number of soil properties.
Spearman’s rank correlation analysis
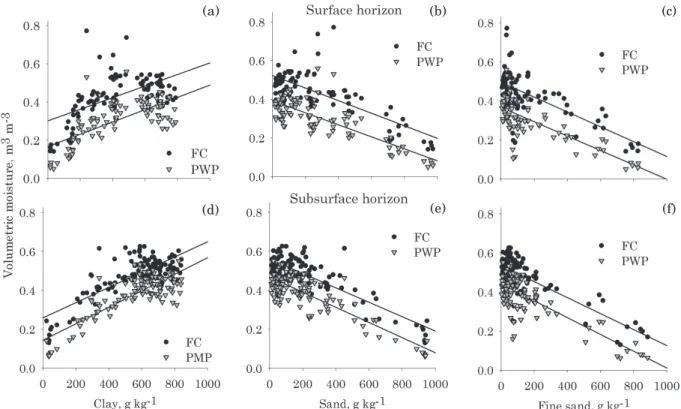
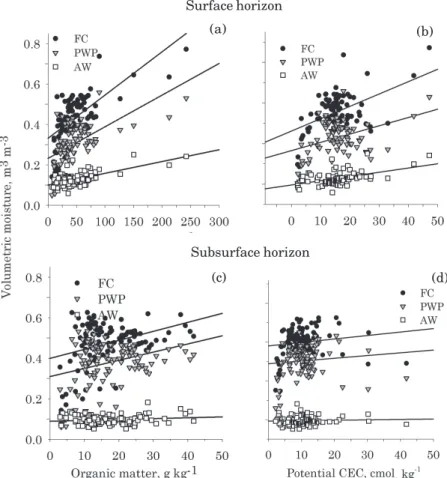
The variables FC and PWP of the surface and subsurface horizons correlated negatively with some sand fractions, and positively with the silt and/or clay fraction (Table 2). Comparing the two fractions of smallest particle diameter in the soil, the clay fraction had the greatest positive correlation coefficient with FC and with PWP in relation to the silt fraction. The relation between clay or silt contents and water retention has been widely reported in studies using pedotransfer functions (van den Berg et al., 1997; Reichert et al., 2009). The data spread of FC and PWP around the straight line of the equation for the clay, total sand and fine sand contents are shown in figure 1a,b and c for the surface horizons, and 1d,e and f for the subsurface horizons.
The division of sand into five classes did not improve the correlation coefficient in relation to the coefficient obtained between the total sand fraction and FC, and the total sand fraction and PWP for the two horizons. Nevertheless, the separation of sand into five fractions indicated that the fine sand fraction has a greater positive correlation coefficient with FC and PWP for both soil horizons than the other sand fractions, despite being moderate for the two variables (Table 2). There was a large spread of the FC and PWP data in soils with low fine sand contents in both horizons (Figure 1c,f), resulting in only a moderate correlation coefficient. In addition, the correlation coefficients with the medium sand and very fine sand contents were also significant, but with lower ρ than for the fine sand content. In reforested areas in Finland, Wall & Heiskanen (2003) observed weak to moderate correlation coefficients between water retention in FC and PWP with very fine and fine sand contents of the soil, respectively.
For AW, lower correlation coefficients were observed between the soil particle size fractions in comparison to the coefficients observed for FC and PWP (Table 2). In the surface horizons, the correlation coefficient between AW and the silt fraction was moderate, and weak between AW and the very fine sand content (Figure 2a,b). For the subsurface horizons, the correlation coefficients were weak between AW and the clay or total sand contents (Figure 2c,d). A reduction of AW with increasing clay content was
observed by Jamison & Kroth (1958) in soils in the State of Missouri in the USA and by Pidgeon (1972) in soils of Uganda. On the other hand, the increase in water availability for plants in soils with greater contents of very fine sand were also observed by Wall & Heiskanen (2003) in reforested areas in Finland.
The bulk density had a negative correlation with FC and PWP in both horizons, with weak correlation coefficients (Table 2). The soil particle density was negatively correlated with FC in the surface horizons; however, this coefficient was very small. The particle density and bulk density correlated with AW only in the surface horizons, with weak coefficients. For all these relations, there was wide scattering of the data around the fitted straight line (Figure 3a, b and c), explaining the low correlation coefficients obtained. For a single soil, the density increase favored water retention. However, the sandier soils have greater density. Thus, the lower water retention in denser soils may be due to the effect of the sand content, since this fraction reduces water retention.
The low correlation between the variables of water retention and availability versus particle density probably occurred due to the interaction between the OM contents with the mineral fractions of the soil, masking the effect of the iron oxides (denser) with greater concentration in the clayey soils derived from basalt, which generally also have greater OM contents in comparison to sandy soils (ρ=-0.54 and -0.42 between the sand content and OM for the surface and subsurface horizons, respectively), whereas the negative correlation coefficient is due to the positive interaction of the clay and the OM, which resulted in a lower particle density in the soils with greater clay and OM contents, which have greater FC, PWP and AW. In addition, particle density does not have a direct relation to soil structure and no relation to its state of compaction or densification.
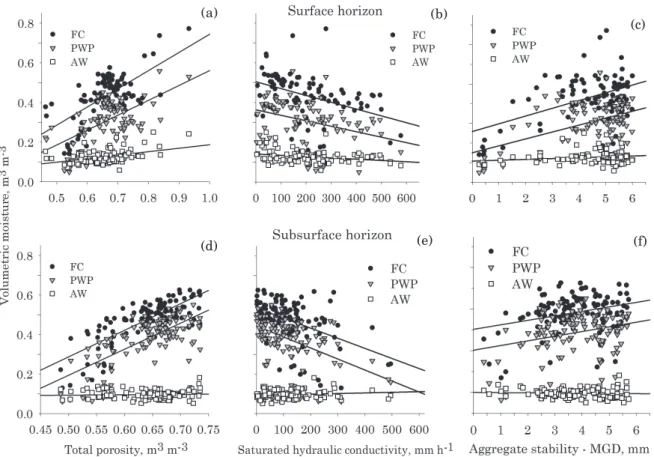
Total porosity (TP) is correlated with FC and PWP in both horizons, with greater coefficients in the subsurface horizons and for FC in comparison to PWP. Although significant, the correlation coefficients for FC and PWP were low in the surface horizons and moderate in the subsurface horizons, resulting from the wide scattering of the data around the fitted straight line (Figure 4a,d). The probable cause of the greater correlation between TP and FC is due to the smaller difference between the suctions in TP (0 kPa) and in FC (10 kPa) in relation to the suction applied in PWP (1,500 kPa). Only in the surface horizons AW was correlated with TP, with a low correlation between both (ρ=0.38).
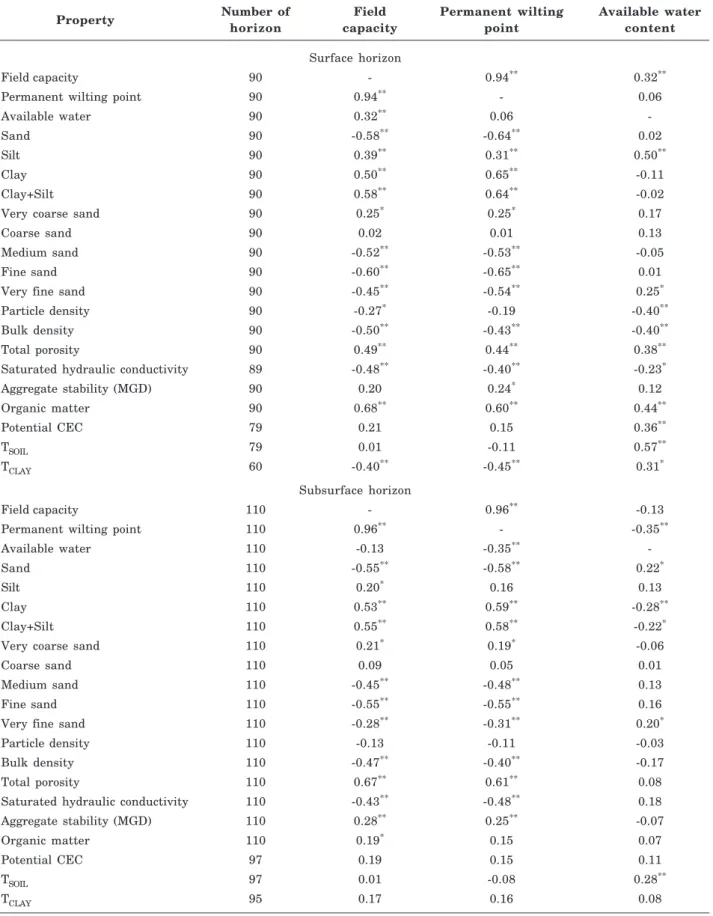
Table 2. Spearman’s rank correlation coefficient (ρρρρρ) between different soil properties and field capacity, permanent wilting point and available water content in surface and subsurface horizons of different soil profiles in the State of Santa Catarina
(1) H
0 Test: |ρ| = zero, when *: significant (0.01<p<0.05) and **: significant (p<0.01).
Property Number of Field Permanent wilting Available water
horizon capacity point content
Surface horizon
Field capacity 90 - 0.94** 0.32**
Permanent wilting point 90 0.94** - 0.06
Available water 90 0.32** 0.06
-Sand 90 -0.58** -0.64** 0.02
Silt 90 0.39** 0.31** 0.50**
Clay 90 0.50** 0.65** -0.11
Clay+Silt 90 0.58** 0.64** -0.02
Very coarse sand 90 0.25* 0.25* 0.17
Coarse sand 90 0.02 0.01 0.13
Medium sand 90 -0.52** -0.53** -0.05
Fine sand 90 -0.60** -0.65** 0.01
Very fine sand 90 -0.45** -0.54** 0.25*
Particle density 90 -0.27* -0.19 -0.40**
Bulk density 90 -0.50** -0.43** -0.40**
Total porosity 90 0.49** 0.44** 0.38**
Saturated hydraulic conductivity 89 -0.48** -0.40** -0.23*
Aggregate stability (MGD) 90 0.20 0.24* 0.12
Organic matter 90 0.68** 0.60** 0.44**
Potential CEC 79 0.21 0.15 0.36**
TSOIL 79 0.01 -0.11 0.57**
TCLAY 60 -0.40** -0.45** 0.31*
Subsurface horizon
Field capacity 110 - 0.96** -0.13
Permanent wilting point 110 0.96** - -0.35**
Available water 110 -0.13 -0.35**
-Sand 110 -0.55** -0.58** 0.22*
Silt 110 0.20* 0.16 0.13
Clay 110 0.53** 0.59** -0.28**
Clay+Silt 110 0.55** 0.58** -0.22*
Very coarse sand 110 0.21* 0.19* -0.06
Coarse sand 110 0.09 0.05 0.01
Medium sand 110 -0.45** -0.48** 0.13
Fine sand 110 -0.55** -0.55** 0.16
Very fine sand 110 -0.28** -0.31** 0.20*
Particle density 110 -0.13 -0.11 -0.03
Bulk density 110 -0.47** -0.40** -0.17
Total porosity 110 0.67** 0.61** 0.08
Saturated hydraulic conductivity 110 -0.43** -0.48** 0.18
Aggregate stability (MGD) 110 0.28** 0.25** -0.07
Organic matter 110 0.19* 0.15 0.07
Potential CEC 97 0.19 0.15 0.11
TSOIL 97 0.01 -0.08 0.28**
Figure 1. Scatter plots of field capacity (FC) and permanent wilting point (PWP) versus the clay, total sand and fine sand contents in the surface (a, b, c) and subsurface (d, e, f) horizons of soils in the State of Santa Catarina.
(a) (b) (c)
Figure 2. Scatter plots between the available water content (AW) and the contents of silt and very fine sand in the surface horizons (a, b), and between AW and the clay and total sand contents in the subsurface horizons (c, d) in soils of theSstate of Santa Catarina.
(d) (e) (f)
(c) (d)
(a) (b)
The correlation of AW with Kθs was negative, observed only in the surface horizons, but with a very low coefficient (ρ=-0.23).
The aggregate stability (MGD) correlated with FC in the subsurface horizons and with PWP in both horizons, and there was a wide scattering of the data
Figure 3. Scatter plots between field capacity (FC) and permanent wilting point (PWP) versus bulk density in the surface (a) and subsurface (b) horizons, and between field capacity (FC) and available water content (AW) versus particle density in the surface (c) horizons in soils of the State of Santa Catarina.
Figure 4. Scatter plots between the field capacity (FC), permanent wilting point (PWP) and available water content (AW) versus total porosity, saturated hydraulic conductivity and aggregate stability, expressed by the mean geometric diameter (MGD) in surface (a, b, c) and subsurface (d, e, f) horizons in soils of the State of Santa Catarina.
around the fitted straight line, especially in soils with higher MGD (Figure 4c,f). Although significant, the three correlation coefficients were quite low (0.24<ρ<0.28). For AW, no correlation with MGD was observed in the surface and subsurface horizons of the soil.
(a) (b) (c)
(a)
(c)
(d) (e) (f)
Organic matter correlated with FC in both horizons and with PWP in the surface horizons (Table 2). Nevertheless, in the surface horizons, high coefficients were observed for FC and for PWP; which was not the case for the subsurface horizons, where only a low correlation with PWP was observed, or its absence, in the case of FC. The greater ρ for OM in the surface horizons was attributed to the greater contents and amplitude of this property in comparison to those observed in the subsurface horizons. For AW, the second greatest correlation coefficient among all variables analyzed occurred between AW and OM; in other words, the increase of OM increased water availability for plants; however, the scattering of the data around the fitted straight line was large (Figure 5a). In the subsurface horizons, there was no significant correlation between AW and OM, probably due to the small amplitude and low OM contents (Figure 5c), in comparison to the surface horizons.
The correlation of FC and PWP with the potential CEC in the surface and subsurface horizons was not significant, in contrast with studies of PTFs developed by Bell & van Keulen (1995) in Mexican soils, and by van den Berg et al. (1997) in Ferralsols in some tropical countries, where a positive relation was observed
Figure 5. Scatter plots between field capacity (FC), permanent wilting point (PWP) and available water content (AW) versus organic matter content and potential cation exchange capacity (CEC) in the surface (a, b) and subsurface (c, d) horizons in soils of the State of Santa Catarina.
between the potential CEC and soil water retention. The absence of correlation was due to the differentiated action of the soil formation factors in the state of SC, which favored the development of soils with a low percentage of expansive 2:1 clay minerals and high OM contents, especially in the central region and the West of SC (Almeida et al., 1997, 2000; Paes Sobrinho et al., 2009; Bringhenti, 2010). The predominant textural classes in the soils of these regions range from clay loam to clay, with low pH, high Al3+ and H+Al contents, low base saturation and CEC with variable charge. As a result, a large number of samples in each horizon had very similar potential CEC, but distinct FC and PWP, forming a scattering of points mainly around the median (Figure 5b,d).
The correlation of AW with the potential CEC, only in the surface horizons of the soils of SC, was positive, although the ρ was only 0.36. An indirect correlation between these two variables may have occurred, since a multiple regression model showed that the clay, silt and OM contents explained 62 % of the total variation of the potential CEC of the surface horizons, which would explain the observed correlation coefficient, since the silt and organic OM were the two variables with the greatest correlation coefficients with AW.
(a) (b)
(c) (d)
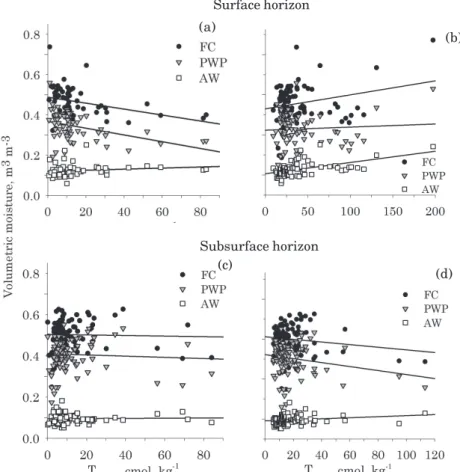
The correlation of FC and PWP of the surface horizons with clay activity was weak and negative (discounting the effect of organic matter on the soil CEC), calculated according to the official method used until to the end of the 1980s to express the activity of the clay fraction (Embrapa, 1988) and denominated “TCLAY” in this study. A large scattering of the data around the fitted straight line was observed, mainly in the soils with lower TCLAY (Figure 6a). When the effect of TOC on the CEC of the soil was not discounted, according to the current method for calculation of the activity of the clay fraction (Embrapa, 2006), denominated “TSOIL” in this study, there was no correlation with FC or PWP.
For AW, a moderate positive correlation was observed between this property and the “TCLAY”, and weak correlation with the “TSOIL”, indicating that soils with greater clay activity, regardless of the calculation methodology of the T value, make greater water content available to the plants (Figure 6a,b). In the subsurface horizons, a weak positive correlation was observed between AW and the “TCLAY”, with large data scattering (Figure 6c). Therefore, it can be affirmed that water availability for plants is higher in soils
with greater activity in the clay fraction and with greater OM contents in the surface horizons, whereas in the subsurface horizons, the increase in AW depends only on the activity of the clay fraction. It should be noted that this effect occurs indirectly because the activity in the clay fraction is higher in less weathered soils, with a greater percentage of 2:1 clay minerals, which are responsible for the increase in water availability in the soil (Bruand, 2004). Since the quantification of this effect is difficult, the T is value is generally used to check the effect of the types of clay minerals on water retention and availability in the soil.
Path analysis
When water retention in FC and in PWP was estimated with the multiple regression model, which included the sand contents (divided into five classes), silt, OM and particle density, a coefficient of determination from 76 to 78 % was observed in the surface and subsurface horizons of the soils of SC (Table 3). It is worth remembering that the clay content was excluded from the regression model to avoid multicollinearity problems in the multiple
Figure 6. Scatter plots of field capacity (FC), permanent wilting point (PWP) and available water content (AW) versus activity of the clay fraction using two methods, one discouting the effect of organic matter on the CEC of the soil (TCLAY) and the other disregarding this effect (TSOIL), in surface (a, b) and subsurface (c, d) horizons in soils of the State of Santa Catarina.
(a)
(b)
(c) (d)
regression model due to its high correlation with the sand contents of the soil.
In path analysis, highest direct effects on the FC and the PWP were observed with the following variables: medium sand contents (negative relation)
for both horizons and OM content (positive relation) in the surface horizons (Tables 4 and 5). In this analysis, the very coarse, fine and very fine sand, and silt contents as well as particle density had a lower direct effect on FC and PWP than the total effect
Model Coefficient of determination (R²)
Horizon Surface Subsurface
FC versus five sand fractions, silt, Pd and OM* 0.78 0.76
PWP versus five sand fractions, silt, Pd and OM 0.76 0.78
AW versus five sand fractions, silt, Pd and OM 0.63 0.27
Table 3. Coefficients of determination obtained from multiple linear regressions for prediction of field capacity (FC = 10 kPa), permanent wilting point (PWP = 1,500 kPa), and available water content (AW) in different soil profiles in the State of Santa Catarina
*Pd: particle density, OM: organic matter.
Property(1) ρ Direct Indirect effect by
effect VC Sand C Sand M Sand F Sand VF Sand Silt Pd OM
Field capacity
VC Sand 0.25 0.06 - 0.07 -0.04 <0.01 <0.01 0.02 0.03 0.11
C Sand 0.02 0.08 0.05 - -0.16 <0.01 -0.03 0.01 0.03 0.04
M Sand -0.52 -0.29 0.01 0.05 - <0.01 -0.09 -0.02 0.01 -0.17
F Sand -0.60 -0.01 -0.01 0.02 -0.25 - -0.11 -0.02 <0.01 -0.23
VF Sand -0.45 -0.14 <0.01 0.02 -0.19 <0.01 - <0.01 0.02 -0.16
Silt 0.39 0.07 0.02 0.02 0.08 <0.01 -0.01 - 0.03 0.19
Pd -0.27 -0.12 -0.02 -0.02 0.01 <0.01 0.02 -0.01 - -0.13
OM 0.68 0.38 0.02 0.01 0.14 <0.01 0.06 0.03 0.04
-Permanent wilting point
VC Sand 0.25 0.05 - 0.09 -0.03 0.03 0.00 0.02 0.03 0.06
C Sand 0.01 0.11 0.05 - -0.11 -0.03 -0.05 0.01 0.02 0.02
M Sand -0.53 -0.21 0.01 0.06 - -0.14 -0.14 -0.01 <0.01 -0.10
F Sand -0.65 -0.17 -0.01 0.02 -0.17 - -0.17 -0.01 <0.01 -0.13
VF Sand -0.54 -0.21 <0.01 0.03 -0.13 -0.14 - <0.01 0.01 -0.10
Silt 0.31 0.05 0.02 0.02 0.05 0.04 -0.01 - 0.02 0.11
Pd -0.19 -0.09 -0.02 -0.03 0.01 <0.01 0.03 -0.01 - -0.08
OM 0.60 0.22 0.02 0.01 0.10 0.10 0.09 0.02 0.03
-Available water content
VC Sand 0.18 -0.05 - 0.02 -0.02 -0.02 <0.01 0.07 0.04 0.14
C Sand 0.13 0.02 -0.04 - -0.09 0.02 0.10 0.04 0.03 0.05
M Sand -0.05 -0.16 -0.01 0.01 - 0.11 0.27 -0.05 0.01 -0.23
F Sand 0.01 0.13 0.01 <0.01 -0.13 - 0.35 -0.05 <0.01 -0.29
VF Sand 0.25 0.43 <0.01 <0.01 -0.10 0.11 - 0.01 0.02 -0.22
Silt 0.50 0.21 -0.02 <0.01 0.04 -0.03 0.02 - 0.03 0.25
Pd -0.40 -0.13 0.02 <0.01 0.01 <0.01 -0.07 -0.05 - -0.18
OM 0.44 0.49 -0.02 <0.01 0.07 -0.08 -0.19 0.11 0.05
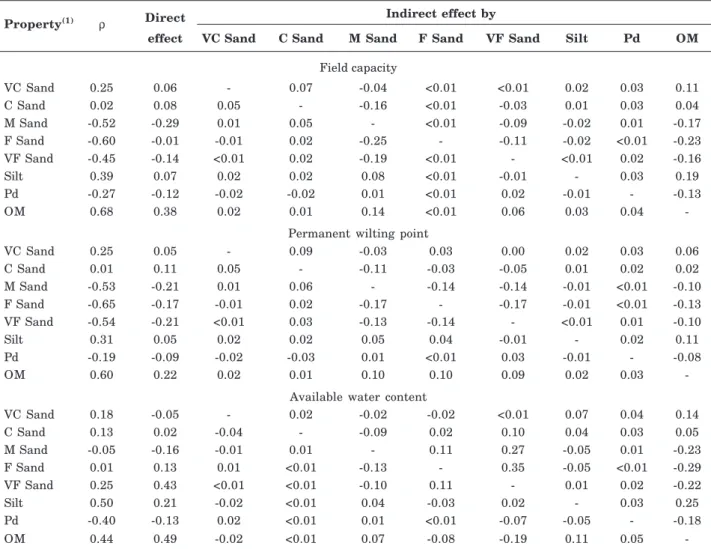
-Table 4. Correlation coefficients considering the direct and indirect effects obtained through path analysis, of the sand contents (five fractions), silt and particle density (Pd) and organic matter (OM), on field capacity (10 kPa) and permanent wilting point (1,500 kPa), and available water content in the surface horizons of different soil profiles in the State of Santa Catarina
(1) VC Sand: very coarse sand (1,000-2,000 µm); C Sand: coarse sand (500-1,000 µm), M Sand: medium sand (250-500 µm), F Sand:
(Spearman’s rank correlation coefficient). The reason was the indirect effect of some predictive variables on the others due to the correlation between them. For example, Spearman’s correlation coefficient of the fine sand content with field capacity of the surface horizons (ρ = |-0.60|) is much greater than its direct effect (direct r = |-0.01|). This occurred due to the high indirect effects of the medium sand content (indirect r = -0.25), of the very fine sand content (indirect r = -0.11) and of OM content (indirect r = -0.23) on the FC (Table 4). In other words, soils with greater fine sand contents also have greater contents of medium sand and very fine sand, and lower contents of OM, and these properties were responsible for the reduction in FC in soils with higher fine sand contents. In relation to other particle size fractions, soils with greater silt content had greater OM contents (ρ = 0.51) in the
surface horizons, and as the OM content was one of the soil constituents with high direct effect on water retention and availability in these horizons, the direct effect of silt on water retention or availability was lower than Spearman’s correlation coefficient; in other words, the greater water retention and availability in siltier soils is due to the combined effect of other soil properties, especially due to the OM contents, which were greater in siltier soils.
Another finding was that in spite of lower FC and PWP in soils with greater fine sand contents in the surface and subsurface horizons of soils in SC, indicated by the negative correlation coefficient, this reduction occurred due to the joint effect of other soil properties, especially due to the increase in medium sand contents and reduction in the OM content, observed in soils with a greater fine sand content.
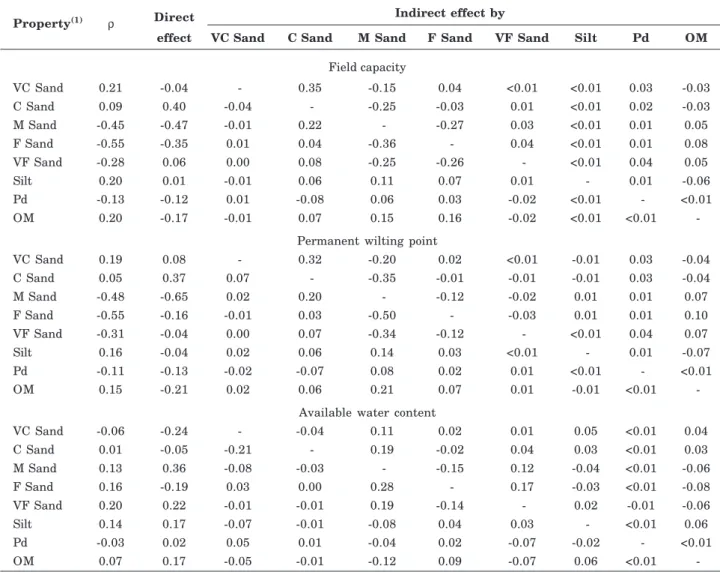
Property(1) ρ Direct Indirect effect by
effect VC Sand C Sand M Sand F Sand VF Sand Silt Pd OM
Field capacity
VC Sand 0.21 -0.04 - 0.35 -0.15 0.04 <0.01 <0.01 0.03 -0.03
C Sand 0.09 0.40 -0.04 - -0.25 -0.03 0.01 <0.01 0.02 -0.03
M Sand -0.45 -0.47 -0.01 0.22 - -0.27 0.03 <0.01 0.01 0.05
F Sand -0.55 -0.35 0.01 0.04 -0.36 - 0.04 <0.01 0.01 0.08
VF Sand -0.28 0.06 0.00 0.08 -0.25 -0.26 - <0.01 0.04 0.05
Silt 0.20 0.01 -0.01 0.06 0.11 0.07 0.01 - 0.01 -0.06
Pd -0.13 -0.12 0.01 -0.08 0.06 0.03 -0.02 <0.01 - <0.01
OM 0.20 -0.17 -0.01 0.07 0.15 0.16 -0.02 <0.01 <0.01
-Permanent wilting point
VC Sand 0.19 0.08 - 0.32 -0.20 0.02 <0.01 -0.01 0.03 -0.04
C Sand 0.05 0.37 0.07 - -0.35 -0.01 -0.01 -0.01 0.03 -0.04
M Sand -0.48 -0.65 0.02 0.20 - -0.12 -0.02 0.01 0.01 0.07
F Sand -0.55 -0.16 -0.01 0.03 -0.50 - -0.03 0.01 0.01 0.10
VF Sand -0.31 -0.04 0.00 0.07 -0.34 -0.12 - <0.01 0.04 0.07
Silt 0.16 -0.04 0.02 0.06 0.14 0.03 <0.01 - 0.01 -0.07
Pd -0.11 -0.13 -0.02 -0.07 0.08 0.02 0.01 <0.01 - <0.01
OM 0.15 -0.21 0.02 0.06 0.21 0.07 0.01 -0.01 <0.01
-Available water content
VC Sand -0.06 -0.24 - -0.04 0.11 0.02 0.01 0.05 <0.01 0.04
C Sand 0.01 -0.05 -0.21 - 0.19 -0.02 0.04 0.03 <0.01 0.03
M Sand 0.13 0.36 -0.08 -0.03 - -0.15 0.12 -0.04 <0.01 -0.06
F Sand 0.16 -0.19 0.03 0.00 0.28 - 0.17 -0.03 <0.01 -0.08
VF Sand 0.20 0.22 -0.01 -0.01 0.19 -0.14 - 0.02 -0.01 -0.06
Silt 0.14 0.17 -0.07 -0.01 -0.08 0.04 0.03 - <0.01 0.06
Pd -0.03 0.02 0.05 0.01 -0.04 0.02 -0.07 -0.02 - <0.01
OM 0.07 0.17 -0.05 -0.01 -0.12 0.09 -0.07 0.06 <0.01
(1) VC Sand: very coarse sand (1,000-2,000 µm); C Sand: coarse sand (500-1,000 µm), M Sand: medium sand (250-500 µm), F Sand:
fine sand (106-250 µm); VF Sand: very fine sand (53-106 µm) and silt (2-53 µm).
In the estimate of available water content (AW) of the surface horizons, the coefficient of determination was a little lower than that observed for FC and PWP (Table 3). It was lower in the subsurface horizons than in the surface horizons, which may be related to the smaller amplitude of AW in these horizons in comparison to those observed for the other soil properties, hampering the estimation of AW.
In path analysis, greater direct effects of OM and very fine sand contents on the increase of AW were observed in the surface horizons of the soils of SC (Table 4). In addition to these, the contents of silt and fine sand (positive relations) and of very coarse sand and particle density (negative relations) also had direct effects on AW. In the subsurface horizons, the greatest direct effect (positive relation) on AW prediction occurred with the medium sand contents. There were also other properties with direct and small effects, such as the contents of very coarse sand and fine sand (negative relations), and the contents of very fine sand, silt and OM (positive relations) (Table 5). The direct effect of particle density was practically zero.
Discussion of results from path analysis
The FC and PWP were highly dependent on particle size distribution and on OM contents of the soil; therefore, soils with finer texture or with greater OM content retain greater water content. These relations are shown in studies that relate water retention to the physical properties of the soil and were already observed several decades ago, as reported by Veihmeyer & Hendrikson (1927). Afterwards, other studies also reported this effect, especially after the 1980s, when studies were developed on pedotransfer functions for estimation of water retention and availability in soils in various countries (Rawls et al., 1982; Scheinost et al., 1997; Reichert et al., 2009).
Path analysis allowed a visualization of the importance of the direct effect of OM content on water retention in the surface horizons of the soils of SC, which had a greater effect on increasing FC in comparison to PWP. This greater effect of OM on FC was also observed elsewhere, as by Bouyoucos (1939), comparing the application of decomposed organic matter in mixtures with different soil classes of the USA; Biswas & Ali (1969), comparing soils in India of the same texture class and different OM contents; and Rawls et al. (2003), using regression trees and also the inductive learning method (GMDH) in a large soil database of the USA. This greater effect of this property on FC increases the water availability for plants in soils with greater OM content, as observed in the soils of Santa Catarina and also in the aforementioned studies.
The comparison between correlation analysis and path analysis showed that Spearman’s correlation coefficients between the OM content versus FC and PWP were greater than the direct effects of OM on these properties. The cause of difference between these
two statistical indicators was due to the high indirect effects of the clay and silt contents on water retention associated with OM because the soils with greater OM content were also those with greater clay and silt contents, and consequently they retained greater water content, due to the combined effect of these three properties on retention. The promotion of OM accumulation at higher proportions of soil particles with smaller diameter (clay+silt) occurs because this particle size fraction hampers OM decomposition, due to its chemical and physical protection capacity (Baldock & Skjemstad, 2000; Dieckow et al., 2009).
The direct negative effects of OM on water retention in the subsurface horizons may be related to the increase of the pore volume (diameter > 30 µm) with the increase of OM in these horizons, which are naturally densified by the pressure effect from the surface horizons, which would result in a small reduction of FC and PWP by the effect of a better soil structure.
The direct negative effect of particle density on FC and PWP may be associated with soil mineralogy since the effect of OM and particle size distribution on water retention was disregarded in the path analysis. Oxidic soils have greater iron and aluminum oxide contents, which have greater particle density in comparison to soils with greater 2:1 clay mineral contents. These soils also have lower water retention due to their smaller specific surface area (van den Berg et al., 1997) and CEC (Bell & van Keulen, 1995). This results in a negative relation between particle density and water retention. Nevertheless, the direct effect of particle density on water retention was extremely small, showing that it is not particularly useful to estimate water retention by PTFs for soils of SC.
With the division of the sand fraction into five classes, it was found that the coarse sand content can increase water retention in the subsurface horizons because this property had a direct positive effect on FC and PWP in path analysis. Nevertheless, this effect is not detectable in the soil due to the effect of the other sand fractions on water retention, which have a direct negative effect; in other words, soils with greater coarse sand contents also have greater contents of the other sand classes, resulting in a Spearman correlation coefficient very near to zero among the coarse sand contents with the FC or the PWP.
Another important finding was that some sand classes, mainly very fine sand in the surface horizons and medium sand in the subsurface horizons, had greater positive direct effects than the silt fraction on water availability in the soil for plants. Nevertheless, water availability is also affected by the other granulometric soil fractions, and the relation between these sand fractions and AW is not perceptible when only Spearman’s correlation coefficient is analyzed.
negligible when compared with those published for this purpose using other analysis methods, making a comparison of the values observed in our study with other publications difficult. In Brazilian literature, path analysis was only used in a study of Reichert et al. (2009), while in international literature, it was only found in a study published by Ebtisam (2007). Reichert et al. (2009) studied the estimation of water retention and availability in soils of Rio Grande do Sul and observed greater direct effects of clay and silt contents on FC and PWP in soils of that state, while the OM content had little direct effect. The total sand fraction or its division in classes was not evaluated. Moreover, the surface and subsurface horizons were evaluated in a single data set. Therefore, the results obtained for AW are a little different from those observed in SC. With regard to the paper of Ebtisam (2007), the study addressed the use of path analysis to evaluate the effects of some physical and chemical properties of some soil classes affected by high salt concentration on soil water availability. The authors concluded that the finest fraction of the soil (clay+silt) had greater direct effects on water availability than the coarser fractions and some soil chemical properties. Nevertheless, the direct and indirect effects do not have negative signs, making it impossible to determine whether the evaluated properties increase or reduce the soil water availability. As a consequence of the lack of studies using path analysis, it was not possible to check whether the effects of the different sand classes on water retention and availability observed in this study occur in soils of other regions. Due to the interesting results obtained by path analysis in this study, we recommend that future studies also make use of this tool to evaluate the direct and indirect effects of soil properties on soil water retention and availability.
Pedotransfer functions (PTFs) for soils in the State of Santa Catarina
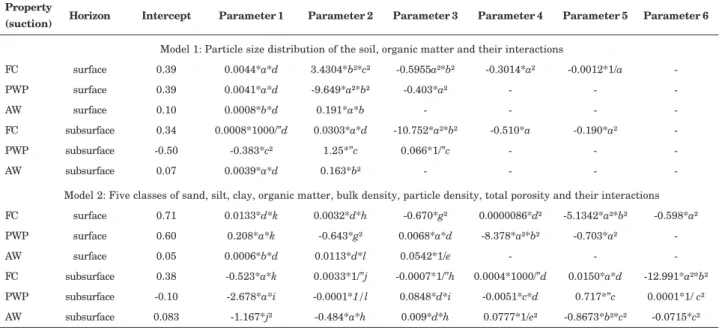
The PTFs fitted to estimate FC, PWP and AW, using the two models of predictive variables, are shown in table 6. All predictive variables selected by the statistical program to generate the PTFs had in some way been subjected to transformation of their original scale or were results of the multiplication of two independent variables. Furthermore, more than two independent variables were selected for each PTF. This indicates that there was a multiplicative effect, not a linear and additive effect of the variables used as predictors of FC, PWP and AW. In addition, the predictive variables selected and their parameters were not the same for the PTFs of the two horizons, indicating that the grouping per horizon was important, as emphasized in the studies of Wösten et al. (1995, 1999).
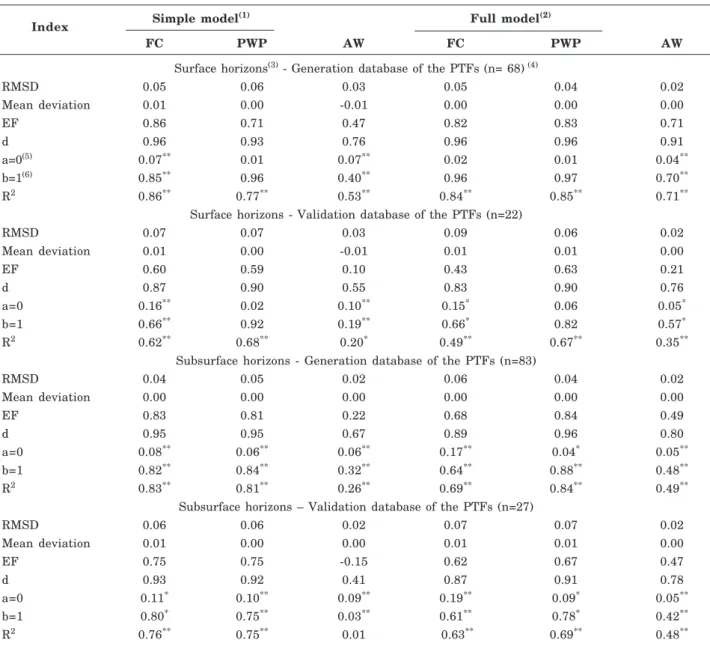
With regard to the predictive ability of the PTFs, those generated for estimation of FC and PWP had better statistical indicators than the PTFs for AW, regardless of the model used (Table 7). Furthermore,
the statistical indicators were better for the generation database in comparison to the validation database, regardless of the model used and the properties estimated.
The PTFs for FC had very similar statistical indicators between the surface and subsurface horizons, with a small advantage of some statistical indicators for the PTFs of the simplest model in the two horizons and in the two databases (generation and validation), in comparison to the full model. Nevertheless, in the PTFs of the PWP, there was an opposite trend; in other words, the two PTFs of the full model had some indicators which were a little better. As the differences of most indicators were small, it is possible to affirm that the two models adequately fit the FC and PWP.
The inclusion of OM contents together with the particle size fractions of the soil to generate PTFs are widely used, due to their positive effect on soil water retention and improvement of the predictive ability of the PTFs generated in these models (Rawls, et al., 1982; Bell & van Keulen, 1995; van den Berg et al., 1997; Saxton & Rawls, 2006; Reichert et al., 2009). On the other hand, in contrast with the PTFs for FC and PWP, the estimation of AW had better predictive ability when the most complete model of predictive variables was used, including the division of sand into five fractions and other soil properties, regardless of the type of horizon, and the two models were able to estimate the AW of the surface horizons with greater accuracy.
When the intercept and the coefficient of the fitted straight line was used together with graph analysis, it was observed that although the mean deviation was equal to or very near zero for most PTFs, the fitted straight line did not coincide with the 1:1 straight line (as expected) for some of them (Table 7). Exceptions occurred for the PTFs of FC in the full model (generation and validation database) (Figures 9a,d) and of PWP in the simple and full models (generation and validation database) (Figures 7b,e, and 9b,e), all generated from the soil surface horizons. The other PTFs of the surface horizons and all those generated from the subsurface horizons had an intercept greater than zero and an angular coefficient below one; in other words, in soils that retain or make a smaller water content available, FC, PWP and AW are overestimated, and underestimated in soils with greater water retention or availability.
The coefficients of determination obtained in the PTFs of the simple and full models for FC and PWP were similar to those obtained by Rawls et al. (1982), Bell & van Keulen (1995) and van den Berg et al. (1997), using the generation database of their PTFs, which used particle size distribution and organic matter at the original scale as predictive variables for FC and PWP in American soils, Mexican soils and Ferralsols of tropical regions, respectively, and were better than those obtained by Reichert et al. (2009) in soils of Rio Grande do Sul. Furthermore, in relation to this coefficient, Saxton & Rawls (2006) also included particle size distribution and OM using non-linear predictive variables for generation of PTFs for soils of the USA; they found lower coefficients than those obtained for soils of Santa Catarina for FC (33 kPa) and very similar values for PWP. van den Berg et al. (1997) also obtained low coefficients by fitting PTFs to AW of Ferralsols of tropical regions (R2 = 0.21).
The efficiency index (EF) of Nash & Sutcliffe (1970) was greater than zero for most of the PTFs. The only exception occurred for the PTF of the simple model for estimation of AW of the subsurface horizons when the validation database of the PTFs was used, resulting in a negative EF. In this case, the use of the median of the data would be better than using the AW estimated by this PTF. However, as most of the PTFs had an EF greater
Property
Horizon Intercept Parameter 1 Parameter 2 Parameter 3 Parameter 4 Parameter 5 Parameter 6 (suction)
Model 1: Particle size distribution of the soil, organic matter and their interactions
FC surface 0.39 0.0044*a*d 3.4304*b²*c² -0.5955a²*b² -0.3014*a² -0.0012*1/a
-PWP surface 0.39 0.0041*a*d -9.649*a²*b² -0.403*a² - -
-AW surface 0.10 0.0008*b*d 0.191*a*b - - -
-FC subsurface 0.34 0.0008*1000/”d 0.0303*a*d -10.752*a²*b² -0.510*a -0.190*a²
-PWP subsurface -0.50 -0.383*c² 1.25*”c 0.066*1/”c - -
-AW subsurface 0.07 0.0039*a*d 0.163*b² - - -
-Model 2: Five classes of sand, silt, clay, organic matter, bulk density, particle density, total porosity and their interactions
FC surface 0.71 0.0133*d*k 0.0032*d*h -0.670*g² 0.0000086*d² -5.1342*a²*b² -0.598*a² PWP surface 0.60 0.208*a*k -0.643*g² 0.0068*a*d -8.378*a²*b² -0.703*a²
-AW surface 0.05 0.0006*b*d 0.0113*d*l 0.0542*1/e - -
-FC subsurface 0.38 -0.523*a*k 0.0033*1/”j -0.0007*1/”h 0.0004*1000/”d 0.0150*a*d -12.991*a²*b²
PWP subsurface -0.10 -2.678*a*i -0.0001*1/l 0.0848*d*i -0.0051*c*d 0.717*”c 0.0001*1/ c² AW subsurface 0.083 -1.167*j² -0.484*a*h 0.009*d*h 0.0777*1/e² -0.8673*b²*c² -0.0715*c²
Table 6. Point pedotransfer functions obtained by robust regression for field capacity (FC), permanent wilting point (PWP) and available water content (AW) in m3 m-3, using the soil physical properties selected in the Simple model: Particle size distribution of the soil, organic matter and their interactions, and the Full model: Five classes of sand, silt, clay, organic matter, bulk density, particle density, total porosity and their interactions for different horizons of soils in the State of Santa Catarina
(1)a: sand content (kg kg-1); b: silt content (kg kg-1); c: clay content (kg kg-1); d: organic matter content (g kg-1); e: bulk density
(Mg m-3); f: particle density (Mg m-3); g: total porosity (m3 m-3); obtained by the equation: g = 1-(e/2.65); h: very coarse sand
content (kg kg-1); i: coarse sand content (kg kg-1); j: medium sand content (kg kg-1); k: fine sand content (kg kg-1); l: very fine sand
content (kg kg-1).
than 0.6, it is possible to confirm the good predictive ability of the PTFs generated, except for the PTFs that estimate AW through variables of the simple model with EF values nearer to zero. The good predictive ability of most PTFs, especially for FC and PWP, is also evidenced when the index of agreement (d) of Willmott (1981) is used, and the coefficient of determination (R²) to evaluate its predictive ability, confirming a lower predictive ability for the PTFs that estimate AW in the simple model, especially in the subsurface horizons.
CONCLUSIONS
1. The field capacity and permanent wilting point of the soils of SC are highly variable and depend on particle size distribution and the OM content. Water retention is higher in soils with a finer texture and/or greater OM content.
3. The water retention and availability in the soil for plants is determined by the interaction of all granulometric fractions of the soil with the organic matter of the soil; however, the effect of each fraction is better understood when path analysis is used.
4. The pedotransfer functions generated that use the clay, silt, sand and organic matter contents as
Index Simple model
(1) Full model(2)
FC PWP AW FC PWP AW
Surface horizons(3) - Generation database of the PTFs (n= 68) (4)
RMSD 0.05 0.06 0.03 0.05 0.04 0.02
Mean deviation 0.01 0.00 -0.01 0.00 0.00 0.00
EF 0.86 0.71 0.47 0.82 0.83 0.71
d 0.96 0.93 0.76 0.96 0.96 0.91
a=0(5) 0.07** 0.01 0.07** 0.02 0.01 0.04**
b=1(6) 0.85** 0.96 0.40** 0.96 0.97 0.70**
R2 0.86** 0.77** 0.53** 0.84** 0.85** 0.71**
Surface horizons - Validation database of the PTFs (n=22)
RMSD 0.07 0.07 0.03 0.09 0.06 0.02
Mean deviation 0.01 0.00 -0.01 0.01 0.01 0.00
EF 0.60 0.59 0.10 0.43 0.63 0.21
d 0.87 0.90 0.55 0.83 0.90 0.76
a=0 0.16** 0.02 0.10** 0.15* 0.06 0.05*
b=1 0.66** 0.92 0.19** 0.66* 0.82 0.57*
R2 0.62** 0.68** 0.20* 0.49** 0.67** 0.35**
Subsurface horizons - Generation database of the PTFs (n=83)
RMSD 0.04 0.05 0.02 0.06 0.04 0.02
Mean deviation 0.00 0.00 0.00 0.00 0.00 0.00
EF 0.83 0.81 0.22 0.68 0.84 0.49
d 0.95 0.95 0.67 0.89 0.96 0.80
a=0 0.08** 0.06** 0.06** 0.17** 0.04* 0.05**
b=1 0.82** 0.84** 0.32** 0.64** 0.88** 0.48**
R2 0.83** 0.81** 0.26** 0.69** 0.84** 0.49**
Subsurface horizons – Validation database of the PTFs (n=27)
RMSD 0.06 0.06 0.02 0.07 0.07 0.02
Mean deviation 0.01 0.00 0.00 0.01 0.01 0.00
EF 0.75 0.75 -0.15 0.62 0.67 0.47
d 0.93 0.92 0.41 0.87 0.91 0.78
a=0 0.11* 0.10** 0.09** 0.19** 0.09* 0.05**
b=1 0.80* 0.75** 0.03** 0.61** 0.78* 0.42**
R2 0.76** 0.75** 0.01 0.63** 0.69** 0.48**
Table 7. Root mean square deviation (RMSD, m3 m-3), mean deviation (MD, m3 m-3), efficiency index (EF) of Nash & Sutcliffe (1970), index of agreement (d) of Willmott (1981), intercept (a, m3 m-3), angular coefficient (b) and coefficient of determination (R²) for the fitted equations between measured moisture and estimated moisture for different pedotransfer functions for field capacity (FC), permanent wilting point (PWP) and available water content (AW) for soils of the State of Santa Catarina
(1) PTFs composed of sand, silt, clay and organic matter content and their interactions. (2) PTFs composed of sand content (5
classes), silt, clay, organic matter, bulk density, particle density, total porosity and their interactions. (3) Horizon used as a
database for fitting the pedotransfer function.(4) n: number of horizons.(5) Level of significance of the F test in ANOVA (* and **
significant at 5 and 1 %, respectively) for the intercept, a level > 0.05 indicates that the parameter “a” of the equation of the straight line does not differ from zero. (6) Level of significance of the F test in ANOVA (* and ** significant at 5 and 1 %,
respectively) for the slope, a level of significance > 0.05 indicates that the parameter “b” of the equation of the straight line does not differ from 1.
Figure 7. Field capacity (FC), permanent wilting point (PWP) and available water content (AW) measured and estimated by PTFs of the simple model: Particle size distribution of the soil, organic matter and their interactions for the generation database (a, b, c) and validation database (d, e, f) for surface horizons of soils of the State of Santa Catarina.
Figure 8. Field capacity (FC), permanent wilting point (PWP) and available water content (AW) measured and estimated by PTFs of the simple model: Particle size distribution of the soil, organic matter and their interactions for the generation database (a, b, c) and validation database (d, e, f) for subsurface horizons of soils in the State of Santa Catarina.
(a) (b) (c)
(d) (e) (f)
(a) (c)
(d) (e) (f)
0.0 0.1 0.2 0.3 (c)
(f)
0.8
0.6
0.4
0.2
0.0 0.8
0.6
0.4
0.2
0.0
0.8
0.6
0.4
0.2
0.0
0.0 0.2 0.4 0.6 0.8 (a)
(d)
0.8
0.6
0.4
0.2
0.0
0.3
0.2
0.1
0.0
0.3
0.2
0.1
0.0 0.8
0.6
0.4
0.2
0.0
0.8
0.6
0.4
0.2
0.0
(b)
0.0 0.2 0.4 0.6 0.8 0.8
0.6
0.4
0.2
0.0
0.8
0.6
0.4
0.2
0.0
0.0 0.2 0.4 0.6 0.8
0.0 0.2 0.4 0.6 0.8 0.00 0.05 0.10 0.15 0.20 0.20
0.15
0.10
0.05
0.00 0.20
0.15
0.10
0.05