* Corresponding author: E-mail: [email protected]
Received: October 24, 2017 Approved: June 15, 2018
How to cite: Bortolini D, Albuquerque JA. Estimation of the retention and availability of water in soils of the state of Santa Catarina. Rev Bras Cienc Solo. 2018;42:e0170250.
https://doi.org/10.1590/18069657rbcs20170250
Copyright: This is an open-access article distributed under the terms of the Creative Commons Attribution License, which permits unrestricted use, distribution, and reproduction in any medium, provided that the original author and source are credited.
Division - Soil Processes and Properties | Commission - Soil Physics
Estimation of the Retention and
Availability of Water in Soils of the
State of Santa Catarina
Diego Bortolini(1) and Jackson Adriano Albuquerque(2)*
(1)
Universidade do Estado de Santa Catarina, Departamento de Solos e Recursos Naturais, Programa de Pós-Graduação em Ciência do Solo, Lages, Santa Catarina, Brasil.
(2)
Universidade do Estado de Santa Catarina, Departamento de Solos e Recursos Naturais, Lages, Santa Catarina, Brasil.
ABSTRACT: Soil water retention and availability are important properties for agricultural production, which can be measured directly or estimated by pedotransfer functions. Some studies on this topic were carried out in Santa Catarina, Brazil. To improve the estimates, it is necessary to evaluate other properties, to analyze more soil types, as well as to use
other analysis techniques such as artificial neural networks and regression trees. Thus, the objective of the study was to estimate the field capacity (FC), permanent wilting point (PWP), and available water (AW) in soils of Santa Catarina (SC), through multiple linear regressions (MLR), artificial neural networks (ANN), and regression trees (RT), more efficiently than the current pedotransfer functions. For this, samples of the horizons A and B of 70 profiles were collected to determine the texture, plasticity limit, FC, PWP, AW, specific surface (SS),
organic carbon (OC) content, and microporosity. Pedotransfer functions were generated
through MRL, ANN, and RT, considering as dependent variables the FC, PWP, and AW, and
as independent variables the content of clay, silt, OC, plasticity limit, SS, and microporosity,
through the test of four models, for surface and subsurface horizons. The RT estimated FC, PWP, and AW better than ANN and MRL. The best models to estimate water retention were those that used microporosity. When the database has few input variables, the model with clay, silt, and OC content is an alternative to estimate FC, PWP, and AW.
Keywords: pedotransfer functions, water retention curve, artificial neural networks,
INTRODUCTION
Data related to hydraulic properties are important and have been used in mathematical models, as in the case of the Brazilian agroclimatic risk zoning. The measurement of
these hydraulic properties is costly, which makes it difficult to use them under high demand. To overcome this difficulty, some researchers generated mathematical models
to indirectly estimate soil water retention (Arruda et al., 1987; Meng et al., 1987; Bell and van Keulen, 1995; van den Berg et al., 1997; Pachepsky and Rawls, 1999). The terminology “pedotransfer functions or pedofunctions” was introduced by Bouma (1989), describing them as “translating data we have into data we need”. In applied form, it can be understood as the use of easily obtainable properties of low cost within a function, to accurately estimate other soil properties.
Since then, researchers have been generating pedotransfer functions, mainly focusing on soil physical and chemical properties (Almeida et al., 2008a; Baker and Ellison, 2008; Álvarez et al., 2010; Dashtaki et al., 2010; Cagliari et al., 2011; Glendining et al., 2011; Costa et al., 2013). Measured water retention data and the available pedofunctions are still scarce in Brazil (Arruda et al., 1987; Silva et al., 1990; Masutti, 1997; Tomasella and Hodnett, 1998; Tomasella et al., 2000; Giarola et al., 2002; Oliveira et al., 2002; Silva et al., 2008; Reichert et al., 2009; Costa et al., 2013; Barros et al., 2013).
The first researchers to generate pedotransfer functions with soils of Santa Catarina and Rio
Grande do Sul, Brazil, were Giarola et al. (2002). Later, Costa et al. (2013) developed a broader study involving 44 soils from several mapping units of Santa Catarina, aiming to generate, test,
and validate pedotransfer functions to estimate water retention, and emphasized the effect of the finer texture and the organic matter (OM) on the retention and availability of water,
and of the OM on the availability of water. They recommended that the study should include more mapping units in Santa Catarina, as well as the evaluation of other soil properties related to the retention and availability of water in the soil. They used multiple linear regressions
(MLR), a widely used method to generate pedotransfer functions. The technique of artificial
neural networks (ANN) to generate pedotransfer functions was tested by Mendes (2014),
and this author reported that ANN was more efficiency than the use of MLR.
Another method that can be used is regression trees (RT), as used in mining and in data prediction. The use of RT is simple since each node has a property and each branch has a weight. Therefore, at each node, a decision is made as to which branches are to be followed through the information that the predictor variables (independent) have, and at the end, we will arrive at a certain result, called the class (Vasques et al., 2008).
Besides the choice of the technique used to build models for estimation, it is important to choose the predictor variables. Usually, to estimate soil water retention and availability, soil granulometry has been used for reasons of practicality, low cost, rapidity, and the
high correlation it has with the field capacity (FC), permanent wilting point (PWP), and available water (AW), plus other properties, such as OM content and bulk density, making
their use more complex and costly (Costa et al., 2013). Soil consistency limits are a fast and inexpensive alternative, with direct relation to soil water dynamics (Peraza, 2003).
This study aimed to estimate the field capacity, permanent wilting point, and available water through multiple linear regressions, artificial neural networks, and regression trees, in soils of Santa Catarina, in a more efficient manner than the current pedotransfer functions.
MATERIALS AND METHODS
Seventy soil profiles were sampled in the state of Santa Catarina, Brazil, which were the
object of research in the studies carried out by: Almeida et al. (1997, 2000, 2003), Corrêa (2003), Embrapa (2004), Paes Sobrinho (2005), Almeida et al. (2008b), Bringhenti (2010), and
existed, were sampled, resulting in 296 pedogenic horizons. For each horizon, samples with altered structure (296 samples) and with preserved structure (four field replicates, totaling
1,184 samples) were collected with a volumetric ring (diameter 6 cm and height 2.5 cm). The characteristics and properties of the horizons sampled are described in Bortolini (2016).
The samples with altered structure were air-dried, manually crushed, and sieved with a 2 mm sieve for the chemical and physical determinations. The samples with preserved structure were saturated and subjected to tensions of 6 and 10 kPa on a sand suction column (Reinert and Reichert, 2006), and tension of 1,500 kPa in Richards chambers (Richards, 1949). Microporosity was considered as the volumetric moisture retained at
a tension of 6 kPa, FC at 10 kPa, PWP at 1,500 kPa, and AW the volumetric moisture
retained between the tensions of 10 and 1,500 kPa.
For the determination of the particle size distribution, the contents of total clay (0-0.002 mm),
silt (0.002-0.053 mm), and sand (0.053-2.0 mm) were determined according to the methodology described by Day (1965). The plasticity limit (PL) was determined by the
Casagrande method and the specific surface (SS) was determined by the monoethyl
ethylene glycol ether (MEGE) method in 25 % of the samples, both described in Donagema
et al. (2011). In the air-dried fine earth (ADFE), the OC content was determined by the Walkley and Black method, modified by Tedesco et al. (1995).
Generation of the point continuous pedotransfer functions
The dependent variables FC, PWP, and AW were estimated using three statistical
techniques: MLR, ANN, and RT. The clay, silt, OC, SS, PL, and microporosity contents were used as independent variables in four statistical models for the surface and subsurface horizons. The independent variables, clay, silt, and OC were maintained because they are less expensive to obtain in the laboratory and more available in the literature, and the variables PL, SS, and microporosity were added in each model: Model 1 = clay, silt, and OC of soil; Model 2 = clay, silt, OC, and PL of soil; Model 3 = clay, silt, OC, and SS of soil; and Model 4 = clay, silt, OC, and soil microporosity.
Multiple linear regression
In the generation of pedotransfer functions by MLR, the stepwise option available in the
PROC REG procedure of the program SAS 9.2 was used (Statistical Analysis Systems - SAS, 2010). This option selects the main variables from a set of independent variables at
a predetermined significance level (p≤0.05), generating a regression coefficient for each of the selected variables. For the model generation, 410 samples of surface horizons and 474 of subsurface horizons were used from the 70 profiles sampled, in a total of 75 % of this database. For the validation, 638 samples of surface horizons and 240 of subsurface
horizons were used, making up 25 % of what remained in that database, plus 501 samples
from an additional database of superficial horizons and 82 of subsurface horizons that
were obtained from the studies of Bognola (1995), Mertz et al. (2004), Espanhol (2005), Lunardi Neto et al. (2008), Costa et al. (2009), Morales et al. (2010), and Silva et al. (2017).
Artificial neural networks
The ANN were developed using the free software WEKA (Waikato Environment for Knowledge Analysis), version 3.8 of the University of Waikato, Hamilton, New Zealand.
The Multiple Layer Perceptron (MultiLayerPerceptron - MLP) function was used, as well
as the backpropagation algorithm for ANN training, with a hidden layer. First, we tested
variations in the structure and in the network parameters (the number of neurons in
the hidden layer, learning rate, moment, and training time), to better fit the ANN, since
In conjunction with this, the criterion of cross-validation in ten subsets (cross-validation) was adopted to estimate the accuracy of the method. The data set is randomly divided into ten groups (subsets) of similar size and distribution. A subset is separated as a test and the remaining nine subsets are considered for network training. Each pair (test subset, training subset) is an iteration for the validation of the algorithm, totaling ten iterations. After the training, using the training subset, the test subset is presented to the
network in question and the error is computed. Finally, the average of the ten subsets provides an estimate of the performance of the algorithm (Ferreira, 2005). In the program
the data are normalized automatically, through the option normalizeNumericClass and
normalizeAttributes, so the data are transformed to have values between -1 and 1.
For validation, the auxiliary database used in the MLR was not used, since cross-validation already uses a greater number of samples. For this procedure the one used
by Mendes (2014) was followed.
Regression trees
The RT were also obtained with the free software WEKA, quoted above. The data were normalized by the WEKA software by selecting the option normalizeAttributes. The
REPTree was used as the classifier algorithm. This is a fast classifier that constructs RT using gain/variance information to reduce the errors (WEKA, 2017). It was defined, after
previous tests, that the maximum pruning depth of the tree should be ten, which is an alterable parameter in the software that serves to reduce the size of the tree and to simplify it, through tests with a variation of this parameter. As in the ANNs, the cross-validation criterion was used for the cross-validation of the RT in 10 subsets. The REPtree
classifier is based on the algorithm C4.5 and it classifies each numerical attribute only once to each node and produces classification trees which result in an absolute value
(Giasson et al., 2011).
Statistical indicators to evaluate the pedotransfer functions
Linear regression analysis
The data between the estimated moisture versus the measured moisture were plotted and adjusted through linear regression. The slope and the intercept of the adjusted regression equation were calculated. These indicators analyze how similar the estimated data are in relation to those observed. The slope indicates the relative relationship between the estimated and measured contents. The intercept on the Y-axis indicates the presence of discrepancy or advancement between the estimates of the model and the measured moisture. A slope equal to 1 and intercept on the Y-axis equal to zero indicate that the
model perfectly reproduces the magnitude of the measured moisture (Willmott, 1981). Also obtained were the correlation coefficients (r), Pearson determination coefficients
(R2
), and the root of the mean square error (RMSE) (Schultz and Schultz, 1992).
RESULTS
Multiple linear regressions: generation and validation
For the MLR, the four models were generated from generation data with samples of
the surface and subsurface horizons (Table 1), and these models were validated in the databases of the surface and subsurface horizons (Table 2). Therefore, statistical indicators were obtained for each pedotransfer function proposed in the generation and validation databases.
In the MLR, the silt content, PL, SS, and microporosity were directly related to retention
and AW. The clay content, however, reduced the AW, a fact also observed by Costa et
al. (2013), while the OC content, for some models, reduced the water retention in the
functions indicate that the estimates for the FC and PWP were better than the estimate for the AW in the four models generated. The estimates for the surface horizons were
better than those of the subsurface horizons.
The addition of the PL (model 2), SS (Model 3) and microporosity (model 4) as predictor variables was tested separately on model 1. It was observed that the use of the PL worsened the estimation of water retention and availability compared to model 1. It was
expected that the inclusion of PL would improve the estimation of FC and PWP, mainly because of their significant relation with water retention (Peraza, 2003) and because it
is directly related to soil–water adhesion forces.
For model 3, with the inclusion of the SS, there was an improvement in the retention estimate and, mainly, in the AW. The SS represents the surface of the particles (external
and internal) and with its increase, the retention of water at the soil surface by adsorption must increase and be an important predictor variable to estimate water retention, mainly
at a more negative matric potential (ψm), that is, closer to the PWP (Grohmann, 1977). The best estimates of the FC and PWP were obtained when microporosity was inserted
(model 4) as a predictor variable. The R2
for the FC was 0.99 and for PWP was 0.67. This ability to estimate is due to the closeness to ψm to determine microporosity (-6 kPa) and FC (-10 kPa), which provides a high correlation between these variables. The stepwise
function has the ability to select from among a set of variables those that result in the best estimate, and eliminate, if necessary, other variables from the model. Thus, for model 4, only the microporosity variable was selected as a predictor variable, indicating that it
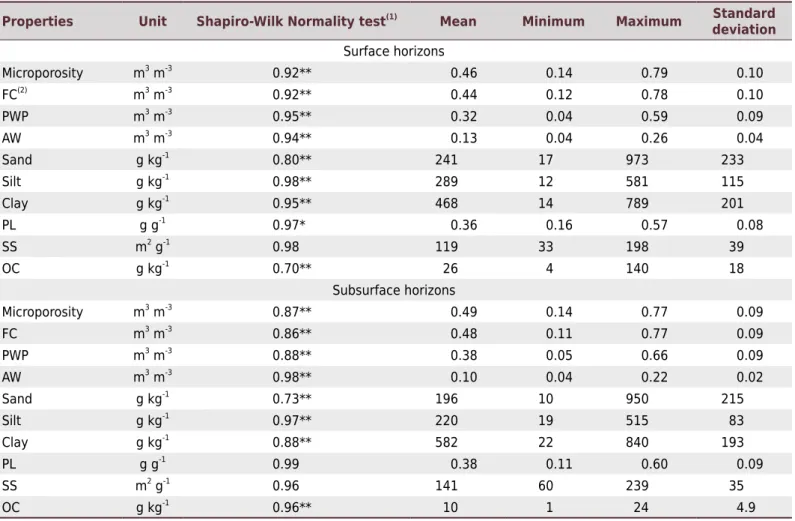
Table 1. Descriptive statistics of soil properties in surface and subsurface horizons of some soil profiles of the state of Santa Catarina, Brazil
Properties Unit Shapiro-Wilk Normality test(1) Mean Minimum Maximum Standard
deviation
Surface horizons Microporosity m3
m-3
0.92** 0.46 0.14 0.79 0.10
FC(2)
m3
m-3
0.92** 0.44 0.12 0.78 0.10
PWP m3
m-3
0.95** 0.32 0.04 0.59 0.09
AW m3
m-3
0.94** 0.13 0.04 0.26 0.04
Sand g kg-1
0.80** 241 17 973 233
Silt g kg-1
0.98** 289 12 581 115
Clay g kg-1
0.95** 468 14 789 201
PL g g-1
0.97* 0.36 0.16 0.57 0.08
SS m2
g-1
0.98 119 33 198 39
OC g kg-1
0.70** 26 4 140 18
Subsurface horizons Microporosity m3
m-3
0.87** 0.49 0.14 0.77 0.09
FC m3
m-3
0.86** 0.48 0.11 0.77 0.09
PWP m3
m-3
0.88** 0.38 0.05 0.66 0.09
AW m3 m-3 0.98** 0.10 0.04 0.22 0.02
Sand g kg-1
0.73** 196 10 950 215
Silt g kg-1
0.97** 220 19 515 83
Clay g kg-1
0.88** 582 22 840 193
PL g g-1 0.99 0.38 0.11 0.60 0.09
SS m2
g-1
0.96 141 60 239 35
OC g kg-1
0.96** 10 1 24 4.9
(1) Ho hypothesis: the samples come from a normal population. Ho is rejected when: * = significant (0.01<p<0.05) and ** = significant (p<0.01). (2) FC = field capacity; PWP = permanent wilting point; AW = available water; PL = plasticity limit; SS = specific surface; OC = organic carbon.
alone can estimate with great efficiency the FC in the soils of Santa Catarina. As for the PWP estimation, the stepwise procedure selected, in addition to microporosity, the OC
content as a predictor variable. However, the model containing only the microporosity
was not adequate to estimate the AW and presented an inferior performance to the one
that contained the SS (model 2).
The models generated when tested with the validation database (Table 3) showed a
worsening of the estimates, except for model 4 to estimate the FC, in superficial horizons. In general, the best model to use for the estimation of water retention in FC and PWP was model 4, indicating that the linear relationship between microporosity and FC and PWP was high and sufficient to estimate water retention in the soils of Santa Catarina.
The use of microporosity was better adjusted when samples from surface horizons were used to generate and validate. In the absence of microporosity data, model 1 is an alternative, since in this one the best results in models that do not have microporosity as a predictor variable were observed.
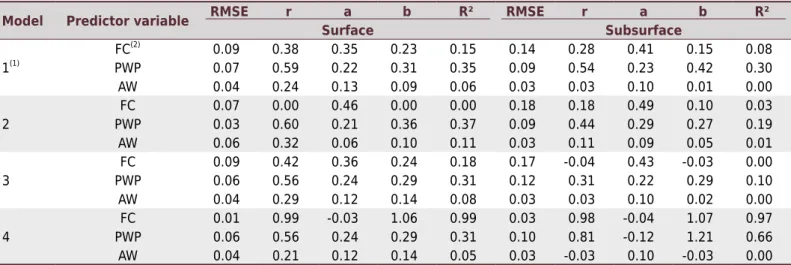
Table 2. Root mean square error (RMSE), correlation coefficient (r), intercept (a), angular coefficient (b), and determination coefficient
(R²) between the measured and estimated moisture by multiple linear regressions (MLR) in four models generated with the surface and subsurface horizons database
Model Predictor variable RMSE r a b R² RMSE r a b R²
Surface Subsurface
1(1) FC
(2)
0.06 0.84 0.13 0.71 0.70 0.06 0.78 0.19 0.61 0.61
PWP 0.05 0.81 0.11 0.66 0.66 0.06 0.80 0.14 0.65 0.64
AW 0.03 0.61 0.08 0.38 0.37 0.02 0.32 0.09 0.10 0.10
2
FC 0.05 0.66 0.26 0.44 0.44 0.08 0.62 0.32 0.48 0.38
PWP 0.05 0.63 0.20 0.40 0.40 0.06 0.77 0.21 0.47 0.60
AW 0.07 0.49 0.04 0.22 0.24 0.02 0.38 0.08 0.14 0.15
3
FC 0.06 0.81 0.14 0.70 0.66 0.03 0.76 0.20 0.58 0.59
PWP 0.06 0.80 0.11 0.67 0.64 0.03 0.81 0.14 0.65 0.65
AW 0.03 0.59 0.08 0.41 0.35 0.03 0.32 0.08 0.19 0.10
4
FC 0.01 1.00 0.00 0.99 0.99 0.01 1.00 0.01 0.99 0.99
PWP 0.06 0.80 0.11 0.67 0.64 0.03 0.96 0.03 0.92 0.92
AW 0.03 0.68 0.07 0.45 0.46 0.02 0.40 0.09 0.16 0.16
(1) Model 1 = clay, silt, and organic carbon; Model 2 = clay, silt, organic carbon, and plasticity limit; Model 3 = clay, silt, organic carbon, and specific surface; Model 4 = clay, silt, organic carbon, and microporosity. (2) FC = field capacity; PWP = permanent wilting point; AW = available water.
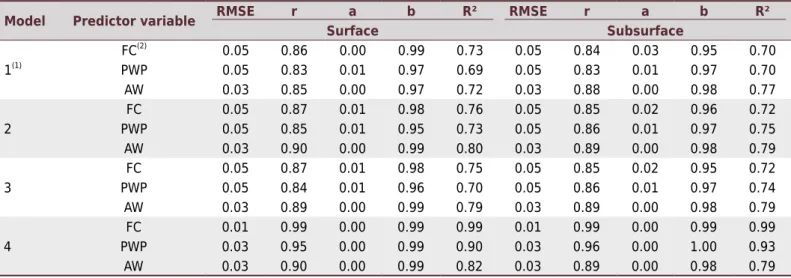
Table 3. Root mean square error (RMSE), correlation coefficient (r), intercept (a), angular coefficient (b), and coefficient of determination
(R²) between measured and estimated moisture by multiple linear regressions (MLR) in four models validated with the surface and subsurface horizons database
Model Predictor variable RMSE r a b R² RMSE r a b R²
Surface Subsurface
1(1) FC
(2)
0.09 0.38 0.35 0.23 0.15 0.14 0.28 0.41 0.15 0.08
PWP 0.07 0.59 0.22 0.31 0.35 0.09 0.54 0.23 0.42 0.30
AW 0.04 0.24 0.13 0.09 0.06 0.03 0.03 0.10 0.01 0.00
2
FC 0.07 0.00 0.46 0.00 0.00 0.18 0.18 0.49 0.10 0.03
PWP 0.03 0.60 0.21 0.36 0.37 0.09 0.44 0.29 0.27 0.19
AW 0.06 0.32 0.06 0.10 0.11 0.03 0.11 0.09 0.05 0.01
3
FC 0.09 0.42 0.36 0.24 0.18 0.17 -0.04 0.43 -0.03 0.00
PWP 0.06 0.56 0.24 0.29 0.31 0.12 0.31 0.22 0.29 0.10
AW 0.04 0.29 0.12 0.14 0.08 0.03 0.03 0.10 0.02 0.00
4
FC 0.01 0.99 -0.03 1.06 0.99 0.03 0.98 -0.04 1.07 0.97
PWP 0.06 0.56 0.24 0.29 0.31 0.10 0.81 -0.12 1.21 0.66
AW 0.04 0.21 0.12 0.14 0.05 0.03 -0.03 0.10 -0.03 0.00
With the use of MLR, low performances were observed to estimate the AW of the soils
of Santa Catarina, regardless of the variables that make up each model tested. Thus,
it is necessary to use other statistical techniques to generate more efficient models to estimate, mainly, AW.
Artificial neural networks: generation and validation
The results obtained by cross-validation of ANN are presented in table 4. It is observed
that the estimates in the subsurface horizons presented results (a, b, r, R2
, and RMSE)
equal to or better than those in the superficial horizons.
The best result for the FC was observed in model 4, which has microporosity as a predictor
variable, which was not included in the other models, for the surface and subsurface
horizons. For these models, the R2
was 0.99 and the RMSE was 0.01 m3
m-3. For FC, there was an improvement in estimation with more predictor variables (models 2, 3, and 4),
compared to the simpler model (1). For the PWP, the best estimate was also with model
4. In model 4, R2
was 0.90 and 0.93, respectively, when the database was used with the surface and subsurface horizons.
The estimate of AW improved in models 2, 3, and 4 compared to model 1 and was similar
in the comparison between these models. It can also be observed that in some models,
the estimate of AW was better than the estimate of retention (FC and PWP). Model 3,
in which PL was included as a predictor variable, only slightly improved the estimate of
retention and AW in the soil using ANN.
It was observed that the increase in the number of input variables improves the estimates, corroborating the results of Soares et al. (2014) for soils of Rio Grande do Sul. However, it is necessary to consider this increase of input variables, since it generates a higher acquisition cost and longer time to feed the model, due to the need for more analysis.
Regression trees
The results of the RT are presented in table 5. With the separation of horizons for estimation,
it is noticed that for water retention the results were better for the subsurface horizons
and for AW they were better for the surface horizons in most models. The best estimate of water retention in FC and PWP was through model 4, which has microporosity as a
predictor variable.
Table 4. Root mean square error (RMSE), correlation coefficient (r), intercept (a), angular coefficient (b), and coefficient of determination
(R²) for relationship between measured moisture and estimated moisture by artificial neural networks (ANN) with the surface and
subsurface horizons database
Model Predictor variable RMSE r a b R² RMSE r a b R²
Surface Subsurface
1(1)
FC(2)
0.05 0.86 0.00 0.99 0.73 0.05 0.84 0.03 0.95 0.70
PWP 0.05 0.83 0.01 0.97 0.69 0.05 0.83 0.01 0.97 0.70
AW 0.03 0.85 0.00 0.97 0.72 0.03 0.88 0.00 0.98 0.77
2
FC 0.05 0.87 0.01 0.98 0.76 0.05 0.85 0.02 0.96 0.72
PWP 0.05 0.85 0.01 0.95 0.73 0.05 0.86 0.01 0.97 0.75
AW 0.03 0.90 0.00 0.99 0.80 0.03 0.89 0.00 0.98 0.79
3
FC 0.05 0.87 0.01 0.98 0.75 0.05 0.85 0.02 0.95 0.72
PWP 0.05 0.84 0.01 0.96 0.70 0.05 0.86 0.01 0.97 0.74
AW 0.03 0.89 0.00 0.99 0.79 0.03 0.89 0.00 0.98 0.79
4
FC 0.01 0.99 0.00 0.99 0.99 0.01 0.99 0.00 0.99 0.99
PWP 0.03 0.95 0.00 0.99 0.90 0.03 0.96 0.00 1.00 0.93
AW 0.03 0.90 0.00 0.99 0.82 0.03 0.89 0.00 0.98 0.79
(1)
Model 1 = clay, silt, and organic carbon; Model 2 = clay, silt, organic carbon, and plasticity limit; Model 3 = clay, silt, organic carbon, and specific
The estimate of AW by RT resulted in R2
of 0.83 to 0.86 and RMSE of 0.02 and 0.03 m3 m-3
in the surface horizons. In the subsurface horizons, R2
varied from 0.81 to 0.83, with
RMSE of 0.02 m3
m-3
. It is observed that the inclusion of predictor variables in addition
to those of model 1 did not improve soil AW estimates.
For the estimation of water retention in FC and PWP, the best models were those with
soil microporosity as a predictor variable, together with silt, clay, and OC contents, and in cases where microporosity data are not available, the use of the simplest model with
silt, clay, and OC is indicated. On the other hand, the AW is estimated in a similar way in
all the models, and thus the use of models with a smaller number of predictor variables is indicated, due to the greater availability and practicality of obtaining data.
DISCUSSION
When analyzing the three statistical techniques and the models used, the different performances in the estimates of FC, PWP, and AW depending on the model and its
predictor variables, horizon (surface or subsurface), and method (MLR, ANN and RT) were evident.
Model 1 (clay, silt, and OC content) is the simplest, that is, with a lower number of predictor variables. This makes it faster and cheaper to obtain results as it uses properties routinely obtained in soil analysis laboratories. In this model, the MLR performance was similar to ANN in estimating soil water retention. However, when the MLR were validated
with samples different from those of the generation database, their performance was reduced. For the state of Santa Catarina, Costa et al. (2013) also reported a reduction in the predictive capacity when the models were tested with different samples from those
of the database that generated the pedotransfer functions. These results show that, although there is a high variability (amplitude) in the soil properties that integrate the database, the linear models are not the most suitable for the estimation of retention
and, especially, for soil AW. This can be explained by the non-linear relationship between clay and water retention, for example. The direct effect of clay on SS and water retention is well known. However, more clayey soils also have modifications in their structure
and this alters the distribution of pore size and water retention. On the other hand, in
estimating AW, the MLR had low performance, even in the model generation database,
a fact commonly observed in studies of the estimation of soil water properties, which,
Table 5. Root mean square error (RMSE), correlation coefficient (r), intercept (a), angular coefficient (b), and coefficient of determination
(R²) for relationship between measured moisture and estimated moisture by regression trees (RT) with the surface and subsurface horizons database
Model Predictor variable RMSE r a b R² RMSE r a B R²
Surface Subsurface
1(1)
FC(2)
0.05 0.90 0.01 0.98 0.80 0.04 0.91 0.00 0.99 0.83
PWP 0.04 0.88 0.01 0.98 0.78 0.04 0.90 0.01 0.98 0.81
AW 0.02 0.93 0.00 0.99 0.86 0.02 0.91 0.00 0.98 0.83
2
FC 0.05 0.90 0.00 0.99 0.80 0.04 0.91 0.00 0.99 0.83
PWP 0.04 0.90 0.00 1.00 0.81 0.04 0.90 0.01 0.98 0.81
AW 0.03 0.92 -0.01 1.06 0.85 0.02 0.90 -0.01 1.11 0.81
3
FC 0.05 0.90 0.01 0.98 0.80 0.04 0.91 0.00 0.99 0.83
PWP 0.04 0.88 0.01 0.98 0.78 0.04 0.90 0.01 0.98 0.81
AW 0.03 0.91 -0.01 1.06 0.83 0.02 0.91 0.01 1.11 0.83
4
FC 0.01 0.99 0.00 0.99 0.98 0.02 0.99 0.01 0.99 0.97
PWP 0.03 0.95 0.01 0.97 0.89 0.03 0.95 0.01 0.99 0.91
AW 0.03 0.91 0.01 0.94 0.84 0.02 0.90 0.00 0.97 0.81
as commented previously, is due to the low linear dependence of other soil properties,
mainly because AW represents a range of the soil water retention curve. In addition, the AW is a variable that depends on both FC and PWP, that is, it can accumulate the errors
of the estimation of these two variables.
For this reason, ANN and RT are more suitable for estimating retention and, mainly, for estimating AW, in the surface and subsurface horizons, because in both techniques the algorithms work to find nonlinear solutions to improve the estimates. Therefore, RT was the technique with better results to estimate FC, PWP, and AW in both horizons studied. In
the development of pedotransfer functions to estimate bulk density in Rwanda, Ghehi et al. (2012) obtained better results using RT compared to other non-parametric techniques.
In the RT, a figure is generated in the format of branches and leaves, which is easy to
use; to reach the estimated result (leaves, which are the water contents retained in
FC, PWP, and AW), the user must run across the branches of the tree through the soil
properties, taking care to follow through the branches that represent the properties of the evaluated soil. According to Staver and Hansen (2015), a limitation of RT is that it produces only an estimate in the “leaf”, with the consequence that, for a certain class of soil properties, the result of the estimation is the same, unlike the MLR and ANN
that result in different estimates, as they vary the values of the input variables of the
model (independent variables). The MLR is also easy to use, but the predictive capacity
is inferior to other techniques. For ANN, although giving the best estimates, Looy et al. (2017) warn that a disadvantage is that they have many coefficients that make them difficult to publish in the form of an equation.
In addition to the variables used in model 1 (clay, silt, and OC content), PL, SS, and soil
microporosity were added, each of these variables being tested in a different model. These variables had not been tested as predictor variables of retention and AW in the
soils of Santa Catarina in the studies of Costa et al. (2013) and Mendes (2014), carried out prior to the present study. Among these, microporosity was the variable that best
improved the estimate of water retention in the soil, mainly for FC, where R2
was higher
than 0.97 and the RMSE less than 0.03 m3
m-3
. It was expected that the incorporation of
the SS into the model would improve the estimates, mainly of the PWP, which represents
the capacity of water adsorption at more negative matric potentials, as is the case of
PWP, but that was not observed, since the water retained in the PWP is also affected
by capillarity in addition to adsorption. It was also expected that the PL would improve estimates of soil water retention because it is a function of the balance between cohesion and adhesion forces. However, because it is expressed gravimetrically and has little dependence on the bulk density, the capacity of this variable to estimate the volumetric
water content was not confirmed.
In general, for the soils of Santa Catarina, the RT was better than the ANN and MLR for
water retention estimation and, especially for estimating AW. The ANN, although inferior in performance to the RT, presented better results than the use of MLR, confirming the
conclusions of Mendes (2014) for soils of Santa Catarina, Soares et al. (2014) for soils of Rio Grande do Sul, and Koekkoek and Booltink (1999) for soils of the Netherlands and Scotland. However, Merdun et al. (2006) found similar results between the two methods, but they recommended the use of ANN because it allows more input and output variables to be used and time and labor to be saved.
Specifically, for Santa Catarina, better results were obtained in the present study compared
to the pedotransfer functions obtained through MLR by Costa et al. (2013). The models
that include microporosity were more efficient in estimating soil water retention. This
is because the microporosity itself represents a point in the soil water retention curve
(tension of 6 kPa). The performance of the models to estimate FC did not vary between
MLR, ANN, and RT, but the complexity of the equation and the way of estimating (equation
MLR was simpler to use, since the stepwise procedure only selected microporosity as a predictor variable among those available in model 4.
In a study with soils of Rio Grande do Sul, Michelon et al. (2010) used the contents of sand, silt, and clay, bulk density, particle density, macroporosity, microporosity, and total porosity to generate pedotransfer functions through MLR, which estimate the water retention. They found a high correlation of microporosity with water retention,
and the stepwise procedure selected microporosity as a predictor variable to estimate
the retention up to 500 kPa, but not as a single predictor variable. In soils managed in conventional and no-tillage systems, Auler et al. (2017) also found microporosity as a
predictor variable for FC and PWP, but with a lower correlation than bulk density. These findings indicate the importance of the selection of input variables in the models, as well
as that of the statistical technique used to estimate soil water retention.
CONCLUSIONS
Artificial neural networks and regression trees were better at estimating the field capacity,
permanent wilting point, and water availability than multiple linear regression. The best models to estimate water retention were those that included soil microporosity as an
input variable. For soils or regions where the availability of input variables is restricted,
the simplest model (clay, silt, and OC content) may be an alternative to estimate the
field capacity, permanent wilting point, and water availability in the soil.
ACKNOWLEDGMENTS
The authors thank the Universidade do Estado de Santa Catarina (Udesc), the CNPq
and Fapesc for providing financial support for research. The first author thanks Capes
for granting a scholarship.
REFERENCES
Almeida CX, Centurion JF, Freddi OS, Jorge RF, Barbosa JC. Funções de pedotransferência para a curva de resistência do solo à penetração. Rev Bras Cienc Solo. 2008a;32:2235-43. https://doi.org/10.1590/S0100-06832008000600003
Almeida JA, Kämpf N, Almeida R. Caracterização mineralógica de Cambissolos originados de rochas pelíticas nos patamares do alto rio Itajaí e no planalto de Lages (SC). Rev Bras Cienc Solo. 1997;21:181-90.
Almeida JA, Maçaneiro KC, Klamt E. Mineralogia da fração argila de solos vermelhos com horizontes superficiais brunados do planalto de Lages (SC). Rev Bras Cienc Solo. 2000;24:815-28. https://doi.org/10.1590/S0100-06832000000400014
Almeida JA, Torrent J, Barrón V. Cor de solo, formas de fósforo e adsorção de fosfato em Latossolos desenvolvidos de basalto do extremo-sul do Brasil. Rev Bras Cienc Solo. 2003;27:985-1002. https://doi.org/10.1590/S0100-06832003000600003
Almeida JA, Oliveira JB, Laus Neto JA, Pundeck M. VIII Reunião nacional de correlação e classificação de solos (Santa Catarina). Florianópolis: Epagri/Embrapa Solos; 2008b.
Álvarez CR, Micucci FG, Bustingorri C, Taboada MA. Pedotransfer functions to estimate proctor test parameters under different tillage systems. Rev Bras Cienc Solo. 2010;34:1787-93. http://dx.doi.org/10.1590/S0100-06832010000600002.
Arruda FB, Zullo Junior J, Oliveira JB. Parâmetros de solo para cálculo de água disponível com base na textura do solo. Rev Bras Cienc Solo. 1987;11:11-5.
Baker L, Ellison D. Optimisation of pedotransfer functions using an artificial neural network ensemble method. Geoderma. 2008;144:212-24. https://doi.org/10.1016/j.geoderma.2007.11.016 Barros AHC, van Lier QJ, Maia AHN, Scarpare FV. Pedotransfer functions to estimate water retention parameters of soils in northeastern Brazil. Rev Bras Cienc Solo. 2013;37:379-91. https://doi.org/10.1590/S0100-06832013000200009
Bell MA, van Keulen H. Soil pedotransfer functions for four Mexican soils. Soil Sci Soc Am J. 1995;59:865-71. https://doi.org/10.2136/sssaj1995.03615995005900030034x
Bognola IA. Caracterização química, física e mineralógica de solos intermediários entre Latossolos Brunos e Latossolos Roxos [dissertação]. Viçosa, MG: Universidade Federal de Viçosa; 1995. Bortolini D. Estimativa da retenção e disponibilidade de água nos solos do Estado de Santa Catarina [tese]. Lages: Universidade do Estado de Santa Catarina; 2016.
Bouma J. Using soil survey data for quantitative land evaluation. Adv Soil Science. 1989;9:177-213. https://doi.org/10.1007/978-1-4612-3532-3_4
Bringhenti I. Mineralogia e gênese dos solos das serras litorâneas do norte catarinense [dissertação]. Lages: Universidade do Estado de Santa Catarina; 2010.
Cagliari J, Veronez MR, Alves ME. Remaining phosphorus estimated by pedotransfer function. Rev Bras Cienc Solo. 2011;35:203-12. https://doi.org/10.1590/S0100-06832011000100019 Corrêa J. Mineralogia e gênese das principais classes de solos de encostas basálticas do estado de Santa Catarina [dissertação]. Lages: Universidade do Estado de Santa Catarina; 2003.
Costa A, Albuquerque JA, Almeida JA, Costa A, Luciano RV. Pedotransfer functions to estimate retention and availability of water in soils of the state of Santa Catarina, Brazil. Rev Bras Cienc Solo. 2013;37:889-910. https://doi.org/10.1590/S0100-06832013000400007
Costa A, Albuquerque JA, Mafra AL, Silva FR. Propriedades físicas do solo em sistemas de manejo na integração agricultura-pecuária. Rev Bras Cienc Solo. 2009;33:235-44. https://doi.org/10.1590/S0100-06832009000200001
Dashtaki SG, Homaee M, Khodaverdiloo H. Derivation and validation of pedotransfer functions for estimating soil water retention curve using a variety of soil data. Soil Use Manage. 2010;26:68-74. https://doi.org/10.1111/j.1475-2743.2009.00254.x
Day PR. Particle fractionation and particle-size analysis. In: Black CA, editor. Methods of soil analysis. Physical and mineralogical methods. Madison: American Society of Agronomy; 1965. Pt. 1. p. 545-67.
Donagema GK, Campos DVB, Calderano SB, Teixeira WG, Viana JHM. Manual de métodos de análise do solo. 2. ed. rev. Rio de Janeiro: Embrapa Solos; 2011.
Empresa Brasileira de Pesquisa Agropecuária - Embrapa. Solos do estado de Santa Catarina. Rio de Janeiro: Embrapa Solos; 2004. (Boletim de Pesquisa e Desenvolvimento, 46).
Espanhol GL. Controle de ervas e adubação orgânica em macieira: propriedades químicas e físicas do solo [dissertação]. Lages: Universidade do Estado de Santa Catarina; 2005.
Ferreira EJ. Abordagem genética para seleção de um conjunto reduzido de características para construção de ensembles de redes neurais: aplicação à língua eletrônica [dissertação]. São Carlos: Universidade de São Paulo; 2005.
Ferreira ERNC. Química e mineralogia de solos desenvolvidos de rochas alcalinas e ultrabásicas do Domo de Lages [tese]. Lages: Universidade do Estado de Santa Catarina; 2013.
Ghehi NG, Nemes A, Verdoodt A, Van Ranst E, Cornelis WM, Boeckx P. Nonparametric
techniques for predicting soil bulk density of tropical rainforest topsoils in Rwanda. Soil Sci Soc Am J. 2012;76:1172-83. https://doi.org/10.2136/sssaj2011.0330
Giarola NFB, Silva AP, Imhoff S. Relações entre propriedades físicas e características de solos da região sul do Brasil. Rev Bras Cienc Solo. 2002;26:885-93. https://doi.org/10.1590/S0100-06832002000400005
Glendining MJ, Dailey AG, Powlson DS, Richter GM, Catt JA, Whitmore AP. Pedotransfer
functions for estimating total soil nitrogen up to the global scale. Eur J Soil Sci. 2011;62:13-22. https://doi.org/10.1111/j.1365-2389.2010.01336.x
Grohmann F. Correlação entre superfície específica e outras propriedades de solo de São Paulo. Rev Bras Cienc Solo. 1977;1:9-12.
Koekkoek EJW, Booltink H. Neural network models to predict soil water retention. Eur J Soil Sci. 1999;50:489-95. https://doi.org/10.1046/j.1365-2389.1999.00247.x
Looy KV, Bouma J, Herbst M, Koestel J, Minasny B, Mishra U, Montzka C, Nemes A, Pachepsky YA, Padarian J, Schaap MG, Tóth B, Verhoef A, Vanderborght J, van der Ploeg MJ, Weihermüller L, Zacharias S, Zhang Y, Vereecken H. Pedotransfer functions in earth system science: challenges and perspectives. Rev Geophys. 2017;55:1199-256. https://doi.org/10.1002/2017RG000581
Lunardi Neto A, Albuquerque JA, Almeida JA, Mafra AL, Medeiros JC, Alberton A. Atributos físicos do solo em área de mineração de carvão influenciados pela correção da acidez, adubação orgânica e revegetação. Rev Bras Cienc Solo. 2008;32:1379-88. https://doi.org/10.1590/S0100-06832008000400002
Masutti MM. Caracterização da água disponível a partir de parâmetros físico-hídricos em solos da zona da mata do Estado de Pernambuco [dissertação]. Recife: Universidade Federal Rural de Pernambuco; 1997.
Mendes RB. Predição da retenção de água em solos de Santa Catarina através de redes neurais artificiais [dissertação]. Lages: Universidade do Estado de Santa Catarina; 2014.
Meng TP, Taylor HM, Fryrear DW, Gomez JF. Models to predict water retention in semiarid sandy soil. Soil Sci Soc Am J. 1987;51:1563-5. https://doi.org/10.2136/sssaj1987.03615995005100060028x Merdun H, Çinar Ö, Meral R, Apan M. Comparison of artificial neural network and regression pedotransfer functions for prediction of soil water retention and saturated hydraulic conductivity. Soil Till Res. 2006;90:108-16. https://doi.org/10.1016/j.still.2005.08.011
Mertz LM, Albuquerque JA, Mafra AL. Atributos químicos e físicos do solo em pomares de macieira nos sistemas de produção orgânico e convencional. In: Anais da XXVI Reunião Brasileira de Fertilidade do Solo e Nutrição de Plantas; julho 2004; Lages. Lages: Universidade do Estado de Santa Catarina; 2004.
Michelon CJ, Carlesso R, Oliveira ZB, Knies AE, Petry MT, Martins JD. Funções de
pedotransferência para estimativa da retenção de água em alguns solos do Rio Grande do Sul. Cienc Rural. 2010;40:848-53. https://doi.org/10.1590/S0103-84782010005000055
Morales CAS, Albuquerque JA, Almeida JA, Marangoni JM, Stahl J, Chaves DM. Qualidade do solo e produtividade de Pinus taeda no Planalto Catarinense. Cienc Florest. 2010;20:629-40. http:// dx.doi.org/10.5902/198050982421.
Oliveira LB, Ribeiro MR, Jacomine PKT, Rodrigues JJV, Marques FA. Funções de pedotransferência para predição da umidade retida a potenciais específicos em solos do estado de Pernambuco. Rev Bras Cienc Solo. 2002;26:315-23. https://doi.org/10.1590/S0100-06832002000200004 Pachepsky YA, Rawls WJ. Accuracy and reliability of pedotransfer functions as affected by grouping soils. Soil Sci Soc Am J. 1999;63:1748-57. https://doi.org/10.2136/sssaj1999.6361748x
Paes Sobrinho JB. Mineralogia da fração argila de solos das serras do leste catarinense [dissertação]. Lages: Universidade do Estado de Santa Catarina; 2005.
Peraza JES. Retenção de água e pedofunções para solos do Rio Grande do Sul [dissertação]. Santa Maria: Universidade Federal de Santa Maria; 2003.
Reichert JM, Albuquerque JA, Kaiser DR, Reinert DJ, Urach FL, Carlesso R. Estimation of water retention and availability for Rio Grande do Sul soils. Rev Bras Cienc Solo. 2009;33:1547-60. https://doi.org/10.1590/S0100-06832009000600004
Reinert DJ, Reichert JM. Coluna de areia para medir a retenção de água no solo - protótipos e teste. Cienc Rural. 2006;36:1931-5. https://doi.org/10.1590/S0103-84782006000600044
Richards L. Methods of measuring moisture tension. Soil Sci. 1949;68:95-112.
Silva AP, Tormena CA, Fidalski J, Imhoff S. Funções de pedotransferência para as curvas de retenção de água e de resistência do solo à penetração. Rev Bras Cienc Solo. 2008;32:1-10. https://doi.org/10.1590/S0100-06832008000100001
Silva AS, Brito LTL, Oliveira CAV, Moita AW. Parâmetros de solo em função da umidade na capacidade de campo em área irrigáveis do trópico semi-árido Brasileiro. Pesq Agropec Bras. 1990;25:103-16.
Silva L, Sequinatto L, Almeida JA, Bortolini D. Methods for quantifying shrinkage in Latossolos (Ferralsols) and Nitossolos (Nitisols) in Southern Brazil. Rev Bras Cienc Solo. 2017;41:e0160364. https://doi.org/10.1590/18069657rbcs20160364
Soares FC, Robaina AD, Peiter MX, Russi JL, Vivan GA. Redes neurais artificiais na estimativa da retenção de água do solo. Cienc Rural. 2014;44:293-300. https://doi.org/10.1590/S0103-84782014000200016 Statistical Analysis Systems - SAS. STAT®
9.22 User’s guide. Cary: Statistical Analysis Systems Institute Inc.; 2010.
Staver AC, Hansen MC. Analysis of stable states in global savannas: is the CART pulling the horse? - a comment. Global Ecol Biogeogr. 2015;24:985-7. https://doi.org/10.1111/geb.12285 Tedesco MJ, Gianello C, Bissani CA, Bohnen H, Volkweiss SJ. Análise de solo, plantas e outros materiais. 2. ed. Porto Alegre: Universidade Federal do Rio Grande do Sul; 1995. (Boletim técnico, 5). Tomasella J, Hodnett M. Estimating soil water retention characteristics from limited data in Brazilian Amazonia. Soil Sci. 1998;163:190-202. https://doi.org/10.1097/00010694-199803000-00003
Tomasella J, Hodnett MG, Rossato L. Pedotransfer functions for the estimation of soil water retention in Brazilian soils. Soil Sci Soc Am J. 2000;64:327-38. https://doi.org/10.2136/sssaj2000.641327x
van den Berg M, Klamt E, van Reeuwijk LP, Sombroek WG. Pedotransfer functions for the moisture retention characteristics of Ferralsols and related soils. Geoderma. 1997;78:161-80. https://doi.org/10.1016/S0016-7061(97)00045-1
Vasques GM, Grunwald S, Sickman JO. Comparison of multivariate methods for inferential modeling of soil carbon using visible/near-infrared spectra. Geoderma. 2008;146:14-25. https://doi.org/10.1016/j.geoderma.2008.04.007