* Corresponding author: E-mail: [email protected]
Received: February 1, 2017 Approved: July 07, 2017
How to cite: Tiecher T, Tiecher TL, Mallmann FJK, Zafar M, Ceretta CA, Lourenzi CR, Brunetto G, Gatiboni LC, Santos DR. Chemical, biological, and biochemical parameters of the soil P cycle after long-term pig slurry application in no-tillage system. Rev Bras Cienc Solo. 2017;41:e0170037.
https://doi.org/10.1590/18069657rbcs20170037
Copyright: This is an open-access article distributed under the terms of the Creative Commons Attribution License, which permits unrestricted use, distribution, and reproduction in any medium, provided that the original author and source are credited.
Chemical, Biological, and
Biochemical Parameters of the Soil
P Cycle After Long-Term Pig Slurry
Application in No-Tillage System
Tales Tiecher(1)*
, Tadeu Luis Tiecher(2)
, Fábio Joel Kochem Mallmann(3)
, Mohsin Zafar(4) , Carlos Alberto Ceretta(5)
, Cledimar Rogério Lourenzi(6)
, Gustavo Brunetto(5)
, Luciano Colpo Gatiboni(7)
and Danilo Rheinheimer dos Santos(5)
(1)
Universidade Federal do Rio Grande do Sul, Faculdade de Agronomia, Departamento de Solos, Porto Alegre, Rio Grande do Sul, Brasil.
(2)
Instituto Federal Farroupilha, Campus Alegrete, Rio Grande do Sul, Brasil. (3)
Universidade Regional Integrada do Alto Uruguai e das Missões, Departamento de Ciências Agrárias, Frederico Westphalen, Rio Grande do Sul, Brasil.
(4)
University of Poonch Rawalakot, Department of Soil & Environmental Sciences, Pakistan. (5)
Universidade Federal de Santa Maria, Departamento de Solos, Santa Maria, Rio Grande do Sul, Brasil. (6)
Universidade Federal de Santa Catarina, Departamento de Engenharia Rural, Florianópolis, Santa Catarina, Brasil.
(7)
Universidade do Estado de Santa Catarina, Departamento de Solos e Recursos Naturais, Lages, Santa Catarina, Brasil.
ABSTRACT: In Southern Brazil, agricultural soils are often treated over long periods
with annual pig slurry (PS) applications, and their influence on soil nutrient dynamics
should be monitored. This study aimed to evaluate the P forms accumulated in the soil and some biological and biochemical parameters of the P cycle after 19 successive PS applications over eight years, in a no-tillage (NT) system. Pig slurry was applied at rates of 0, 20, 40, and 80 m3 ha-1 per crop. Several P forms (available P, microbial P, phosphatase enzyme, total organic and inorganic P) in the 0.00-0.05 and 0.05-0.10 m soil layers were analyzed. Increases up to 5,523 % in available P, 308 % in microbial P, 104 % in phosphatase enzyme activity, 91 % in organic P, 251 % in inorganic P, and 19 % in Total-P were observed in the 0.00-0.05 m soil layer in response to the highest PS rate compared to the treatment with no PS. Results also indicated that P added via PS was preferentially accumulated in the inorganic fractions (83-98 %). The increase in organic P was limited by the increase in soil organic carbon. The increase in soil microbial
biomass-P was more influenced by available P, while the increase in phosphatase enzyme
activity was more related to the increase in organic P and C. Therefore, PS applied to the
soil affected the chemical, biological, and biochemical components of the soil P cycle.
Results indicate that even half of the PS rate normally used by farmers (20 m3 ha-1
) poses
a high risk of pollution of water bodies by runoff from these soils.
Keywords: organic phosphorus, inorganic phosphorus, microbial biomass phosphorus, acid phosphatase.
INTRODUCTION
Brazil is the fourth largest producer and exporter of pork meat in the world. Pig production has increased from 368 million tons in 1960 to 3,643 million tons in 2015 (ABPA, 2016). Currently, the swine production industry sustains 610 thousand direct and indirect jobs, and there are 24 thousand pig producers in Brazil, of which 80 % are concentrated in the three southernmost states of Brazil (Paraná - PR, Santa Catarina - SC, and Rio Grande do Sul - RS) (ABPA, 2016). In Southern Brazil, 63 % of the national pig production is concentrated in an area that represents only 6 % of the national territory (513 million km2
). These three states are also responsible for more than
80 % of pork exports from Brazil. This farming activity is widespread, profitable, and
popular among small farmers in southern Brazil, where pig slurry (PS) application on
agricultural fields is a common practice of nutrient management (Grohskopf et al.,
2016; Hentz et al., 2016; Lourenzi et al., 2016; Couto et al., 2017). The use of manures as alternative to mineral P fertilizer is becoming an increasingly essential practice in order to decrease the demand of mineral P fertilizers in agriculture, in view of the expected global rock phosphate scarcity in the coming decades (Cordell et al., 2009).
The field-applied P contained in PS in Brazil is estimated at around 123 thousand tons
per year (Tiecher et al., 2014), representing about 3.2 % of the annual consumption of P contained in phosphate fertilizers in Brazil (3,860 thousand tons per year) (IFA, 2013).
On farms, PS is often stored in anaerobic dunghills and later applied as nutrient source on pastures and annual crops. Generally, PS is applied in limited areas because pig farms in Southern Brazil normally have small areas. Hence, repeated PS applications on
the same fields result in the accumulation of nutrients and heavy metals in the topsoil,
especially when the soil is not plowed (Ceretta et al., 2010a; Girotto et al., 2010; Guardini et al., 2012a; Xue et al., 2013). In this context, P accumulation in the soil surface is of particular concern, due to the high environmental risk of eutrophication of water bodies (Panuelas et al., 2009; Wang et al., 2013).
Higher soil P availability results in higher uptake by plants, which may increase the yield and dry matter production (Ceretta et al., 2005; Adeli et al., 2008). In this process, part of the inorganic P absorbed by plants is incorporated into organic compounds. After plant senescence and later decomposition in the soil, the soil organic P content increases (Ceretta et al., 2010a; Tiecher et al., 2012a). In addition, part of the P contained in PS is already in organic form, thus directly increasing the organic P fraction (McDowell and Stewart, 2005). However, to become available to plants,
the organic phosphorus must be mineralized first because plants only absorb P as
inorganic orthophosphate. This process is catalyzed by periplasmic and extracellular
phosphatase enzymes, which are either secreted by plant roots and soil flora and
microorganisms to meet their P requirement, or passively released after cell death and lysis (Quiquampoix and Mousain, 2005). Generally, plants and soil microorganisms
respond to inorganic P starvation by an intensification of the phosphatase enzyme
activity in the soil, while high levels of soil available P tend to decrease phosphatase enzyme activity (Gatiboni et al., 2008a).
Soil microorganisms affect the soil P dynamics not only by mineralization of soil
Accordingly, our hypothesis is that P applied via PS is accumulated in the soil mainly in inorganic forms, increasing P availability, which in turn may stimulate P accumulation in soil microbial biomass and suppress phosphatase enzyme activity in the soil. These
effects will be the greater, the higher the PS rate applied. Therefore, this study aimed
to evaluate the impact of successive PS applications on P forms in the soil and on some biological and biochemical parameters related to the soil P cycle.
MATERIALS AND METHODS
Study site, and experimental design and description
The study was carried out on a Typic Hapludalf soil (Soil Survey Staff, 2014), or Argissolo
Vermelho Distrófico arênico (Santos, 2013), in Santa Maria, Rio Grande do Sul, Brazil (29° 42’ 52” S, 53° 42' 10" W; 90 m a.s.l.). The soil is well-drained and has strong clay eluviation. The parent material is upper Triassic sandstone, called Santa Maria
formation (Silva, 1997). The soil mineralogical composition includes interstratified
illite-smectite, kaolinite-illite-smectite, hydroxy-aluminum vermiculite, and kaolinite clay minerals
(Bortoluzzi et al., 2008). The climate is subtropical (Cfa, Köppen classification system)
with annual means of around 1,600 mm precipitation and temperature of 19 °C. Mean monthly rainfall and temperatures during the experimental period (2000-2008) are
listed in figure 1.
According to the recommendation of the regional committee for soil chemistry and fertility (CQFS-RS/SC, 2016), there are two possible ways to determine correct PS rates for application as fertilizer: (i) based on previous manure chemical analysis, which is time-consuming and expensive, or (ii) evaluation of manure density to estimate N, P,
and K contents. In both cases, the rate is defined as the amount of PS required to meet
N, P or K demands. In order to meet the other nutrient requirements, complementary mineral fertilization is recommended. In practice, however, local farmers do not follow this recommendation and use the soil for easy disposal of PS. In this scenario, the PS rate commonly used is about 40 m3
ha-1
per crop, which often exceeds the nutritional requirements of plants. Therefore, in order to investigate the impact of these management practices in the soil P dynamics, we tested three application rates: a 40 m3
ha-1
standard rate, as usually applied by pig farmers, and half of and double the standard rate, plus a control treatment without PS application.
0 5 10 15 20 25 30
0 50 100 150 200 250
Jan
Temperature
(°C)
Rainfall (mm)
Rainfall Temperature
Feb Mar Apr May Jun Jul Aug Sep Oct Nov Dec
The experimental area was cultivated in a no-tillage (NT) system since 1992 with annual
crops and fertilization according to official recommendations (CQFS-RS/SC, 2016). In May
2000, the experiment began with the application of PS rates of 0, 20, 40, and 80 m3 ha-1 on 12 m2
plots (4 × 3 m). The experiment was arranged in a randomized block design with three replications and conducted until January 2008 under NT. Prior to the experiment, soil
samples were taken between 0.00 to 0.10 m depth at different locations in the field and then
mixed to blend a composite soil sample, and analyzed for physical and chemical properties. The background soil sample contained 170 g kg-1
clay, 300 g kg-1
silt, and 530 g kg-1 sand (sandy-loam soil). The chemical properties were determined as follows: pH 4.7 (pH in water at a ratio of 1:1), 9.3 g kg-1
of total organic carbon; 15 mg kg-1
of available P, and 96 mg kg-1
of available K (extracted by Mehlich-1); 0.8 cmolc kg-1 of Al3+
, 2.7 cmolc kg-1 of Ca2+
, and 1.1 cmolc kg-1 of Mg2+
(extracted by KCl 1.0 mol L-1
), and cation exchange capacity of 9.6 cmolc kg-1
. The crop sequence, the dry matter and P content of the PS used in each crop, and the amount of P applied (kg ha-1
) per PS rate are shown in table 1.
Soil sampling and analysis
In January 2008, three bulk soil samples were collected from each plot at two layers: from 0.00-0.05 and 0.05-0.10 m. The soil samples were air-dried, ground, sieved through a 2-mm
mesh, and stored at 4 °C before use. Approximately 200 g of soil was moistened to 80 % field
capacity and incubated at 25 °C for 21 days to achieve the soil biological equilibrium, and then the P stored in the soil microbial biomass and acid phosphatase enzyme activity were analyzed.
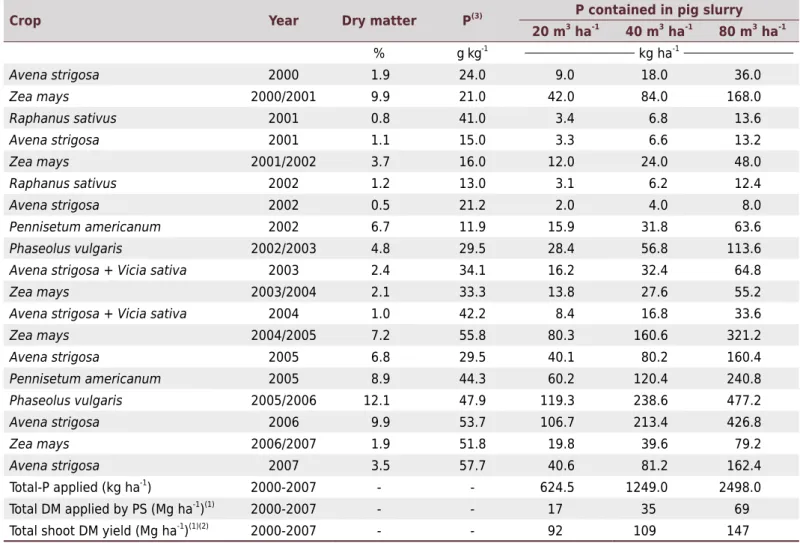
Table 1. Cropping history, chemical composition of PS, and amount of P applied by PS at each application during experiment, and the total amount of dry matter (DM) applied by PS, and total amount of shoot yield in eight experimental years in Santa Maria, Rio Grande do Sul, Southern Brazil
Crop Year Dry matter P(3) P contained in pig slurry
20 m3 ha-1
40 m3 ha-1
80 m3 ha-1
% g kg-1
kg ha-1
Avena strigosa 2000 1.9 24.0 9.0 18.0 36.0
Zea mays 2000/2001 9.9 21.0 42.0 84.0 168.0
Raphanus sativus 2001 0.8 41.0 3.4 6.8 13.6
Avena strigosa 2001 1.1 15.0 3.3 6.6 13.2
Zea mays 2001/2002 3.7 16.0 12.0 24.0 48.0
Raphanus sativus 2002 1.2 13.0 3.1 6.2 12.4
Avena strigosa 2002 0.5 21.2 2.0 4.0 8.0
Pennisetum americanum 2002 6.7 11.9 15.9 31.8 63.6
Phaseolus vulgaris 2002/2003 4.8 29.5 28.4 56.8 113.6
Avena strigosa + Vicia sativa 2003 2.4 34.1 16.2 32.4 64.8
Zea mays 2003/2004 2.1 33.3 13.8 27.6 55.2
Avena strigosa + Vicia sativa 2004 1.0 42.2 8.4 16.8 33.6
Zea mays 2004/2005 7.2 55.8 80.3 160.6 321.2
Avena strigosa 2005 6.8 29.5 40.1 80.2 160.4
Pennisetum americanum 2005 8.9 44.3 60.2 120.4 240.8
Phaseolus vulgaris 2005/2006 12.1 47.9 119.3 238.6 477.2
Avena strigosa 2006 9.9 53.7 106.7 213.4 426.8
Zea mays 2006/2007 1.9 51.8 19.8 39.6 79.2
Avena strigosa 2007 3.5 57.7 40.6 81.2 162.4
Total-P applied (kg ha-1
) 2000-2007 - - 624.5 1249.0 2498.0
Total DM applied by PS (Mg ha-1)(1) 2000-2007 - - 17 35 69
Total shoot DM yield (Mg ha-1
)(1)(2)
2000-2007 - - 92 109 147
(1)
Data from Lourenzi et al. (2014b). (2)
Total shoot dry matter (DM) yield in the control treatment (0 m3 ha-1
PS) was 58 Mg ha-1 . (3)
In chemical analysis, soil pH was determined in distilled water with a glass electrode (pH in water at a ratio of 1:1 v/v), exchangeable Ca2+
, Mg2+
, and Al3+
extracted by KCl 1.0 mol L-1
(soil:extractant ratio of 1:20) whereas available K+
was extracted by Mehlich-1 (soil:extractant ratio of 1:10) as described by Tedesco et al. (1995). Exchangeable Al3+
in the KCl extract was determined by titrating with NaOH 0.0125 mol L-1 , Ca2+ and Mg2+
were determined by atomic absorption spectrophotometry and K+ by flame photometry. The potential acidity (H+Al) was calculated as a function of pH SMP (Kaminski et al., 2001). The Cu and Zn contents were determined by extraction with HCl 0.1 mol L-1
(CQFS-RS/SC, 2016). These soil chemical properties are presented in table 2.
Available P (Av-P) was estimated by extraction with Mehlich-1 (soil:extractant ratio of 1:10) and determined by the molybdenum-blue method (Murphy and Riley, 1962). The soil microbial biomass P (SMB-P) was estimated by the chloroform fumigation extraction method, after inorganic P extraction with anion exchange resin membrane (Hedley and Stewart, 1982). The P content stored in the soil microbial biomass (SMB) was calculated as proposed by Morel et al. (1996).
The acid phosphatase enzyme activity (P-ase) was estimated by measuring the release of
p-nitrophenol from p-nitrophenyl phosphate, after exposure to soil in a modified universal
buffer (MUB) at pH 6.5, as described by Tabatabai and Bremner (1969).
Organic P (Org-P) estimated by the ignition method was calculated by the difference
between the amount of P extracted with 0.5 mol L-1
H2SO4 from ignited (550 °C, 2h) and non-ignited soil samples (Olsen and Sommers, 1982). Total-phosphorus (Total-P) was estimated by digestion with H2SO4 and H2O2 in the presence of saturated MgCl2 (Brookes and Powlson, 1981; Hedley et al., 1982). The content of inorganic P (Inorg-P)
was obtained by the difference between the content of Total-P and Org-P estimated by
the ignition method. The accumulation of P added via PS in inorganic form to the soil was calculated according to equation 1:
Accumulation of inorganic P (%) =
(Inorganic PPS-Inorganic P0)
(Total PPS-Total P0)
x 100 Eq. 1
Table 2. Chemical properties of soil treated with 19 successive PS applications over 8 years, in Santa Maria, Rio Grande do Sul, Southern Brazil
Soil property Soil layer
0.00-0.05 m 0.05-0.10 m
PS rate (m3
ha-1
)
0 20 40 80 0 20 40 80
pH(H2O)
(1)
5.2 5.4 5.4 5.5 5.4 5.3 5.3 5.5
Ca2+
(cmolc dm
-3
)(2)
3.4 3.9 4.7 5.2 3.0 3.0 3.6 4.1
Mg2+
(cmolc dm
-3
)(2)
2.2 2.7 3.3 4.1 1.8 2.1 2.7 3.9
Al3+ (cmolc dm
-3
)(2) 0.3 0.2 0.2 0.2 0.7 0.6 0.3 0.2
K+
(cmolc dm
-3
)(3)
0.2 0.2 0.2 0.3 0.0 0.1 0.1 0.2
H+Al (cmolc dm
-3
) 4.4 4.5 4.8 4.5 5.3 5.2 4.8 4.7
Effective CEC (cmolc dm
-3
) 6.1 7.0 8.3 9.8 5.4 5.8 6.7 8.3
Potential CEC (cmolc dm
-3
) 10.2 11.3 13.0 14.1 10.1 10.3 11.1 12.7
Al saturation (%) 4.7 2.7 2.0 2.0 12.6 11.6 4.3 2.2
Base saturation (%) 57.1 60.0 62.9 68.2 47.4 49.6 57.8 63.4
Available Cu (mg kg-1
)(4)
1.7 11.0 20.5 42.8 1.8 4.1 6.8 11.4
Available Zn (mg kg-1)(4) 5.3 16.9 35.1 79.7 2.0 6.0 9.5 20.6
(1)
Soil:water ratio of 1:1. (2)
Extracted by 1.0 mol L-1
KCl (soil: extractant ratio 1:20). (3)
Extracted by Mehlich-1 (soil:extractant ratio 1:10). (4)
Extracted by HCl 0.1 mol L-1
where P0 is the P concentration in the soil in the control treatment (0 m3 ha-1
of PS) and
PPS is the P concentration in the soil treated with PS rates (20, 40, and 80 m3 ha-1
).
The total organic carbon (TOC) content was determined by wet oxidation with K2Cr2O7 and H2SO4 (Walkley and Black, 1934), with modifications proposed by Tedesco et al. (1995), and the result was corrected to the TOC content obtained by dry combustion (elementary analyzer) using a correction factor (Rheinheimer et al., 2008a).
Statistical analyses
The data were submitted to analysis of variance (ANOVA). When treatment effects were significant at p<0.05 by the F test, regression equations were adjusted for PS rates and the differences between soil layers were compared by the Tukey test at p<0.05. We also
performed Principal Component Analysis (PCA) using the variables: Av-P, SMB-P, P-ase, Org-P, Inorg-P, Total-P, and TOC. Later cluster analysis was performed using the method of k-means. All statistical analyses were performed using software R (R Core Team, 2013).
RESULTS
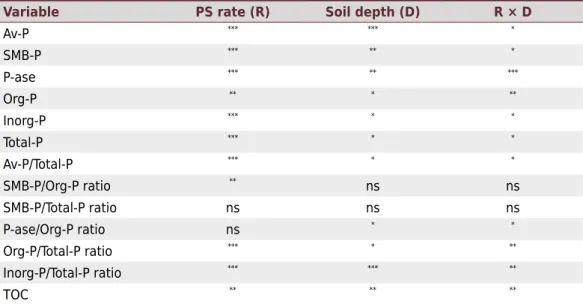
Successive PS applications altered the P content and forms and some biological and
biochemical parameters of the P cycle in the soil (Table 3). The results indicated significant
interactions for all forms of soil P with the factors PS rates (R) and soil depth (D) (Table 3).
However, for the ratios SMB-P/Org-P and SMB-P/Total-P, no effect of interaction between
the factors R and D was observed.
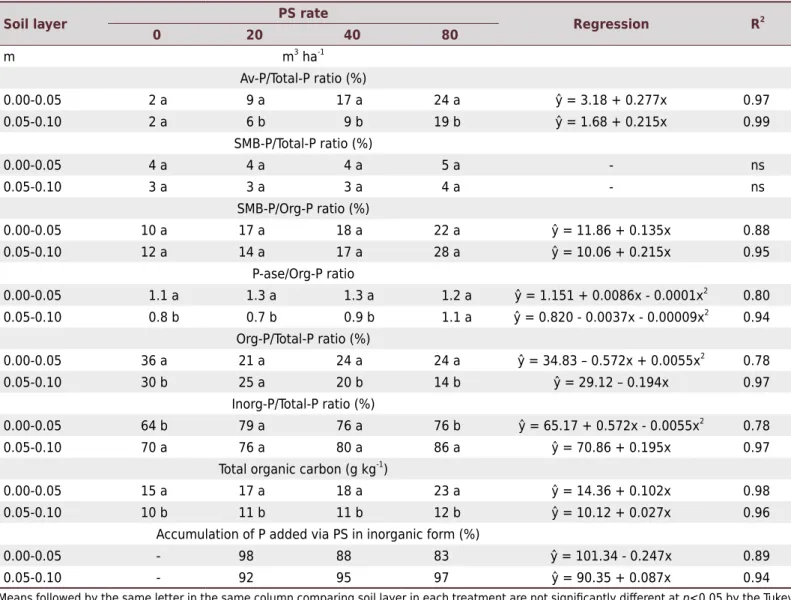
Pig slurry applications increased the levels of Av-P, SMB-P, P-ase, Inorg-P, Total-P, and TOC (Figure 2), and the ratios of Av-P/Total-P, SMB-P/Org-P, and P-ase/Org-P in both soil layers (Table 4). On the other hand, Org-P increased with increasing PS rates applied only on the soil surface layer (0.00-0.05 m) (Figure 2d), and SMB-P/Total-P ratio in the evaluated layers was not increased by PS applications (Table 4).
Highest increases were observed in the 0.00-0.05 m soil layer. Compared to the control treatment with application of 80 m3 ha-1 of PS, the increases were: 5,523 % for Av-P; 308 % for SMB-P; 104 % for P-ase; 91 % for Org-P; 251 % for Inorg-P; 194 % for Total-P; and 56 % for TOC.
Table 3. Analysis of variance (ANOVA) for different P pools in response to different PS rates
application (R), soil layers (D) and their interaction (R × D)
Variable PS rate (R) Soil depth (D) R × D
Av-P *** *** *
SMB-P *** ** *
P-ase *** ** ***
Org-P ** * **
Inorg-P *** * *
Total-P *** * *
Av-P/Total-P *** * *
SMB-P/Org-P ratio **
ns ns
SMB-P/Total-P ratio ns ns ns
P-ase/Org-P ratio ns * *
Org-P/Total-P ratio *** * **
Inorg-P/Total-P ratio *** *** **
TOC ** ** **
Phosphorus added as PS was mostly accumulated in the soil in inorganic form (83-98 % - Table 4). In this experiment, the increase in Total-P was followed by an increase in Inorg-P proportion and a decrease in Org-P proportion (R2
= 0.58 - Figure 3a). However, the variation in the P accumulation form in the soil was better explained when taking into account the variation of TOC content (R2
= 0.87 - Figure 3b), highlighting that the increase in Org-P was limited by the increase in organic carbon in the soil.
There were significant correlations (p<0.001) among all variables in this study (Table 5),
and the highest correlations (R2
>0.8) were found among P-ase, TOC, and Org-P, and among Av-P, Inorg-P, and Total-P. For SMB-P, the highest correlation was obtained with Av-P (R2
=0.87), and P-ase showed the highest correlation with TOC (R2
=0.94). The SMB-P content was less correlated with P-ase (R2=0.62), Org-P (R2=0.56), and TOC (R2=0.56), and P-ase had a weaker correlation with Av-P (R2
=0.57) and Inorg-P (R2
=0.45).
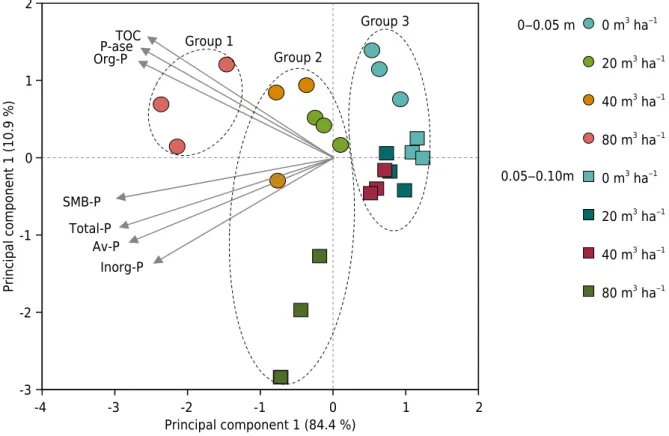
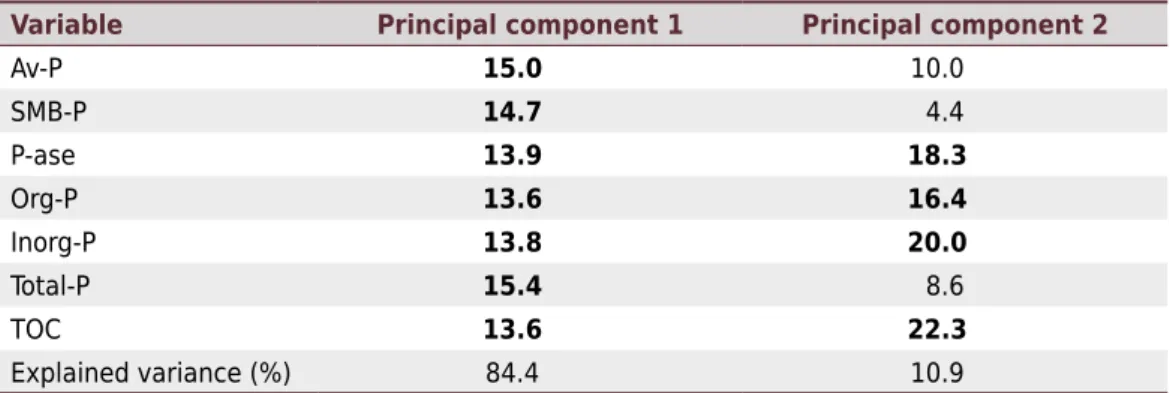
Together, the first two principal components (Figure 4) explained 95.4 % of the total variation in both soil layers (0.00-0.05 and 0.05-0.10 m). The first principal component
explained 84.4 % and the second principal component 10.9 % (Table 6). The contribution
of variables in the first principal component was on average 14.3±0.7 % for each variable.
The variable contribution in the second principal component was 22.3 % due to TOC, 20.0 % due to Inorg-P, 18.3 % due to P-ase, and 16.4 % due to Org-P (Table 6).
Cluster analysis clearly formed three distinct groups (Figure 4). Group 1 contained the 0.00-0.05 m soil layer treated with 80 m3 ha-1 PS. Group 2 comprised the surface soil layer treated with 20 and 40 m3
ha-1
PS and the 0.05-0.10 m layer treated with 80 m3 ha-1
PS. Group 3 comprised both soil layers of the control treatment and the 0.05-0.10 m soil layer treated with PS rates of 20 and 40 m3
ha-1 .
Gatiboni et al. (2015)
R2 = 0.99 R2 = 0.99
0 200 400 600 800 1000
Available P (mg kg
-1 ) 0.00-0.05 m 0.05-0.10 m * * * ns Environmental P threshold (a) 0 20 40 60 80 100
SMB-P (mg kg
-1 )
* *
*
ns
R2 = 0.99
R2 = 0.97
(b) 0 100 200 300 400 500
Acid phosphatase enzyme
activity (µg
g
-1 h -1 )
* *
* R2 = 0.99
R2 = 0.91
(c) * 0 100 200 300 400
0 20 40 60 80
Organic-P (mg
kg
-1 )
* *
R2 = 0.99
(d) * * 0 200 400 600 800 1000 1200 1400
0 20 40 60 80
Inorganic-P (mg
kg
-1 )
Rate of PS (m3ha-1) *
*
R2 = 0.97
(e)
ns
*
R2 = 0.99
0 300 600 900 1200 1500 1800
0 20 40 60 80
Total-P (mg
kg
-1 )
* *
R2 = 0.99 (f)
*
*
R2 = 0.99
Total-P (mg kg-1)
Proportion of inorganic and organic P (%
)
10 20 30 40 50 60 70 80 90
(a)
Ratio of Total-P/TOC (mg kg-1)
(b)
Org-P (%) Inorg-P (%)
Inorg-P (%) = -10128+[89.7/Total-P(mg kg-1 ), R2
= 0.58 Org-P (%) = 10128+[10.3/Total-P(mg kg-1
), R2 = 0.58 95% Confidence Band
Org-P (%) Inorg-P (%)
Inorg-P (%) = -1.18+[97.4/Ratio of Total-P/TOC], R2 = 0.87 Org-P (%) = 1.18+[2.6/Ratio of Total-P/TOC], R2 = 0.87 95% Confidence Band
400 600 800 1000 1200 1400 1600 0.03 0.04 0.05 0.06 0.07 0.08 0.09 0.10
Figure 3. Effect of increase in the total-P content (a) and increase in the ratio total-P/TOC (b) in the soil and the proportion of
inorganic and organic P.
Table 4. Ratios of Av-P/Total-P, SMB-P/Total-P, SMB-P/Org-P, P-ase/Org-P, Org-P/Total-P, Inorg-P/Total-P, total organic carbon, and accumulation of P added via PS in inorganic form in soil treated with 19 PS applications over 8 years, in Santa Maria, Rio Grande do Sul, Southern Brazil
Soil layer PS rate Regression R2
0 20 40 80
m m3
ha-1
Av-P/Total-P ratio (%)
0.00-0.05 2 a 9 a 17 a 24 a ŷ = 3.18 + 0.277x 0.97
0.05-0.10 2 a 6 b 9 b 19 b ŷ = 1.68 + 0.215x 0.99
SMB-P/Total-P ratio (%)
0.00-0.05 4 a 4 a 4 a 5 a - ns
0.05-0.10 3 a 3 a 3 a 4 a - ns
SMB-P/Org-P ratio (%)
0.00-0.05 10 a 17 a 18 a 22 a ŷ = 11.86 + 0.135x 0.88
0.05-0.10 12 a 14 a 17 a 28 a ŷ = 10.06 + 0.215x 0.95
P-ase/Org-P ratio
0.00-0.05 1.1 a 1.3 a 1.3 a 1.2 a ŷ = 1.151 + 0.0086x - 0.0001x2 0.80
0.05-0.10 0.8 b 0.7 b 0.9 b 1.1 a ŷ = 0.820 - 0.0037x - 0.00009x2
0.94 Org-P/Total-P ratio (%)
0.00-0.05 36 a 21 a 24 a 24 a ŷ = 34.83 – 0.572x + 0.0055x2
0.78
0.05-0.10 30 b 25 a 20 b 14 b ŷ = 29.12 – 0.194x 0.97
Inorg-P/Total-P ratio (%)
0.00-0.05 64 b 79 a 76 a 76 b ŷ = 65.17 + 0.572x - 0.0055x2
0.78
0.05-0.10 70 a 76 a 80 a 86 a ŷ = 70.86 + 0.195x 0.97
Total organic carbon (g kg-1
)
0.00-0.05 15 a 17 a 18 a 23 a ŷ = 14.36 + 0.102x 0.98
0.05-0.10 10 b 11 b 11 b 12 b ŷ = 10.12 + 0.027x 0.96
Accumulation of P added via PS in inorganic form (%)
0.00-0.05 - 98 88 83 ŷ = 101.34 - 0.247x 0.89
0.05-0.10 - 92 95 97 ŷ = 90.35 + 0.087x 0.94
Table 5. Linear correlation (r2) coefficients between Av-P, SMB-P, P-ase, Org-P, Inorg-P, and Total-P
in response to 19 successive PS applications over 8 years, in Santa Maria, Rio Grande do Sul, Southern Brazil
Av-P SMB-P P-ase Org-P Inorg-P Total-P
SMB-P 0.87*
P-ase 0.57*
0.62*
Org-P 0.55*
0.56*
0.81*
Inor-P 0.88* 0.75* 0.45* 0.45*
Total-P 0.90*
0.80*
0.57*
0.60*
0.98*
TOC 0.52*
0.56*
0.94*
0.86*
0.44*
0.57*
Av-P: available P; SMB-P: microbial P; P-ase: acid phosphatase enzyme activity; Org-P: organic P; Inorg-P: inorganic P; Total-P: total-phosphorus; Av-P/Total-P: available P/total-phosphorus ratio; TOC: total organic carbon. * Significant at p<0.001.
DISCUSSION
Phosphorus application through PS to the soil surface at amounts exceeding the P crop uptake increased the P levels in all pools evaluated. Highest increases were observed in Av-P and Inorg-P, because between 60 % (Cassol et al., 2001) and 99 % (Tiecher et al., 2014) of P contained in PS is in inorganic forms. This increase was up to 12.5-fold in the Av-P/Total-P ratio in the 0.00-0.05 m soil layer where PS was applied at the maximum rate
(Table 4). Moreover, it induced high linear correlation coefficients between Av-P × Total-P,
Av-P × Inorg-P, and Inorg-P × Total-P (Table 5). Similar changes also occurred in the 0.05-0.10 m soil layer, but were less distinctive. This is because under repeated P soil application through PS, the ability of plants to absorb P from deeper soil layers and deposit it
Figure 4. Projection of the variables related to the soil phosphorus cycle in the first factorial plan and principal component analysis
of the 0.00-0.05 and 0.05-0.10 m layers of soil treated with 19 PS applications in 8 years, in Santa Maria, Rio Grande do Sul, Southern Brazil. Numbers in parentheses indicate percent of variation explained by each axis. Av-P: available phosphorus; SMB-P: microbial phosphorus; P-ase: acid phosphatase enzyme activity; Org-P: organic phosphorus; Inorg-P: inorganic phosphorus; Total-P: total-phosphorus; Av-P/Total-P: available phosphorus/total-phosphorus ratio; TOC: total organic carbon.
-3 -2 -1 0 1 2
-4 -3 -2 -1 0 1 2
Principal component 1 (10.9 %)
Principal component 1 (84.4 %)
0‒0.05 m
0.05‒0.10m TOC
P-ase Org-P
SMB-P
Total-P Av-P
Inorg-P
Group 1
Group 2
Group 3 0 m3 ha‒1
20 m3 ha‒1
40 m3 ha‒1
80 m3 ha‒1
0 m3 ha‒1
20 m3 ha‒1
40 m3 ha‒1
Table 6. Percentage explained by each principal component and percentage explained by each variable in each principal component. Bold numbers >|0.7|
Variable Principal component 1 Principal component 2
Av-P 15.0 10.0
SMB-P 14.7 4.4
P-ase 13.9 18.3
Org-P 13.6 16.4
Inorg-P 13.8 20.0
Total-P 15.4 8.6
TOC 13.6 22.3
Explained variance (%) 84.4 10.9
Av-P: available P; SMB-P: microbial P; P-ase: acid phosphatase enzyme activity; Org-P: organic P; Inorg-P: inorganic P; Total-P: Total-P; Av-P/Total-P: available P/Total-P ratio; TOC: total organic carbon.
on the soil surface is exceeded by the transfer of P to the soil profile as a result of infiltration
and biological activities. The increase in P in the 0.05-0.10 m layer varies according to
the PS rates (Table 4). These results are similar to findings of Gatiboni et al. (2008b) for a
Hapludalf under natural pasture, and of Guardini et al. (2012a,b) for a cultivated Hapludalf, treated with successive PS applications in Southern Brazil.
There are two other factors that increase the soil Av-P content after PS application. Firstly, P accumulation on the soil surface is a result of its absorption by plants in the deeper soil layers and its subsequent deposition on the soil surface through decomposition of plant residues (Rheinheimer and Anghinoni, 2001; Tiecher et al., 2012b). Secondly, the increased plant biomass production in treatments with PS application (Table 1) was coupled with the direct input of organic material by PS, which resulted in the increase of the TOC content of the soil (Table 4). Thus, the higher amount of low-molecular-weight
organic acids released due to the increased TOC content may cause a competition effect
with phosphate for the soil adsorption sites (Jones and Oburger, 2011). Moreover, the implementation of the NT system in subtropical regions has decreased soil erosion and changed the soil element dynamics, particularly those related to the carbon cycle (Mellek et al., 2010; Santos et al., 2011; Conceição et al., 2013).
In Southern Brazil, according to recommendations of CQFS-RS/SC (2016) for soils with a clay content of less than 20 %, the optimum amount of Mehlich-1 available P is 30 mg kg-1 for grain crops (e.g. soybean, maize, wheat). Below this range, there is a high probability of crop response to P addition. Only the treatment without PS application was below this limit (15.4 and 10.1 mg kg-1
in the 0.00-0.05 and 0.05-0.10 m soil layers - Figure 2a).
On the other hand, Gatiboni et al. (2015) proposed an environmental P threshold based on a simple model considering soil available P and clay content (P threshold in mg kg-1 = 40 + % of clay). Applying the threshold to this study, the maximum available P in the soil without causing environmental concerns is 57 mg kg-1
in the 0.00-0.10 m soil layer. The Av-P levels in the 0.00-0.10 m (considering the mean of the layers 0.00-0.05 and 0.05-0.10 m) in the treatments with PS applications of 20, 40, and 80 m3
ha-1
are 2.1, 4.8, and 13.2 times higher, respectively, than this environmental critical level. In other words, even half of the rate normally applied by farmers (20 m3
ha-1
) poses a high risk of environmental contamination with P. In subtropical regions such as Southern Brazil, the
high precipitation often exceeds the capacity of water infiltration into the soil, resulting in runoff. However, according to Ceretta et al. (2010b) and Lourenzi et al. (2014a), if well managed, the runoff water from the soil surface under NT does not result in large soil
losses by erosion, which would remove P as particulate P. Unfortunately, this is not the
case of most fields in the state of Rio Grande do Sul, Southern Brazil, where cropland
The increase in SMB-P observed with the increase in PS rates (Table 4) is a beneficial effect, for delaying phosphate adsorption by the soil, and after cell death and lysis, it
releases P to the soil solution for plant uptake (Martinazzo et al., 2007; Gatiboni et al.,
2008a). The results indicated a high linear correlation coefficient between SMB-P × Av-P
and SMB-P × Total-P, because the soil microbial biomass is a dynamic compartment that immobilizes P when P availability increases in the soil solution (Rheinheimer et al., 2008b).
The higher amount of organic residues (Table 1) and TOC (Table 4) resulting from PS applications favors the growth and development of soil microbial biomass. In addition, the
intensified development of plant roots grown in soil with PS application may also result in
an increased exudation of organic compounds (Souza et al., 2010), which serve as energy and carbon source for the soil microbial community (Rheinheimer et al., 2000). According to Dakora and Phillips (2002), fungi and plants are mainly responsible for the production of acid phosphatase in the soil. In addition, the organic material protects the enzymes and keeps them in their active forms through the formation of complexes with humic compounds (Quiquampoix and Mousain, 2005). Thus, the increase in P-ase in treatments with higher PS rates may be attributed to the increased biological activity (plants and microorganisms) and the further protection of the enzyme by soil organic matter in both soil layers. Furthermore, the high correlation between P-ase, TOC, and Org-P, and the low correlation between P-ase and SMB-P shows that biochemical mineralization of the
soil organic P forms is not a specific function of the soil microorganisms.
The P-ase generally increases with decreasing soil Av-P content, acting as a compensatory mechanism of the low soil P availability (Gatiboni et al., 2008a). However, in this study, P-ase increased even where Av-P was high (Table 4). In this context, several controversial
findings are reported in the literature, stating the complexity of the relationship between
acid phosphatase enzyme activity and soil available P. To some extent, this increase is natural, especially in view of the complex interaction of biological, chemical, and biochemical mobilization processes of P in soils (Jones and Oburger, 2011). In our experiment, the higher biological activity due to PS addition increased the acid phosphatase enzyme activity in the soil. In addition, the increase in P-ase, even at higher soil available P, may be due to the presence of extracellular phosphomonoesterases stabilized by the soil (Nannipieri et al., 2011).
There is little information about the factors that favor an increase in soil organic P, but it usually occurs in systems where there is an increase in TOC and Total-P, or when they are not considerably altered (Nziguheba and Bünemann, 2005). This trend is clearly
shown (Figure 3) by the influence of TOC and Total-P on the pattern of P form distribution
in the soil, and that the increase in Org-P was limited by the increase in soil organic carbon. Although Org-P in PS is low (McDowell and Stewart, 2005), the transformation of inorganic into organic P is evident in soils in well-managed NT systems, where soil TOC is increased. Under such conditions, inorganic P is incorporated from the soil solution into organic forms by plants and soil microorganisms (Shen et al., 2011). Thus, the increase in the soil Av-P content (Figure 2a) and in the deposition of organic residues
(Table 1), associated with an intensified microbial activity in the soil surface, resulted in
an approximately two-fold increase in the content of soil Org-P in the 0.00-0.05 m soil layer in the treatment with the highest PS rate, compared to the control. Despite the large increase in Total-P in both soil layers, the increase in Org-P content in the
0.05-0.10 m soil layer was less evident. This effect is attributed to the small increase in the
TOC content in this soil layer, a fact that also explains the close relationship between these two variables (Table 5).
P in highly labile organic forms, which are easily mineralized after application to the soil. Therefore, P applied in PS has the same pattern of adsorption by soil inorganic colloids as that of P applied in mineral fertilizers, with preferential accumulation in inorganic forms.
The combined analysis of the variables by Principal Component Analysis shows that the soil P dynamics are changed mainly in the soil surface layer and with increasing amounts of P applied by PS (Figure 4). The variables related to the P cycle in the treatment with highest PS rate were substantially altered, even in the 0.05-0.10 m layer. Furthermore,
the loadings of the first principal component (explaining 84.4 % of the variation in the
experiment) were very similar among all variables, indicating that all variables were equally impacted by PS application and also that the evaluated variables are strongly related with each other, as also shown by the correlation among all variables (Table 5).
The figure 4 also shows two clusters of variables; the first is related to TOC, Org-P, and
P-ase, and shows that P-ase depends on TOC and Org-P in soil under successive PS application. The second one is related to Av-P, Inorg-P, Total-P, and SMB-P, and shows that SMB-P depends on the availability of inorganic P forms.
CONCLUSIONS
Phosphorus applied in pig slurry is preferentially accumulated in the soil in inorganic form (83-98 %). The increase in organic P was limited by the increase in soil organic carbon. The increase in pig slurry rates also led to an increase in the levels of available P, soil microbial biomass-P content, and even in the acid phosphatase enzyme activity. These
results show that pig slurry application to the soil affects the chemical, biological, and
biochemical components of the soil P cycle. The increase in soil microbial biomass-P was
more influenced by available P, while the increase in phosphatase enzyme activity was
more related to the increase in organic P and C. Moreover, results indicate that even half of the pig slurry rates normally applied by farmers (20 m3
ha-1
) poses a high risk of
pollution of water bodies, due to runoff from the soil.
ACKNOWLEDGMENTS
The authors express their gratitude to the National Council for Scientific and Technological Development (CNPq) for financial support, and to the Coordination for the Improvement of Higher Education Personnel (CAPES), for supporting the first author with a doctoral scholarship.
REFERENCES
Adeli A, Bolster CH, Rowe DE, McLaughlin MR, Brink GE. Effect of long-term swine effluent application on selected soil properties. Soil Sci. 2008;173:223-35.
https://doi.org/10.1097/ss.0b013e31816408ae
Bortoluzzi EC, Velde B, Pernes M, Dur JC, Tessier D. Vermiculite, with hydroxy-aluminium interlayer, and kaolinite formation in a subtropical sandy soil from south Brazil. Clay Miner. 2008;43:185-93. https://doi.org/10.1180/claymin.2008.043.2.03
Brazilian Association of Animal Protein - ABPA. Annual Report 2016 [internet]. São Paulo: Brazilian Association of Animal Protein; 2016 [accessed 04 dec 2016]. Available in: http://abpa-br.com.br/
storage/files/abpa_relatorio_anual_2016_ingles_web_versao_para_site_abpa_bloqueado.pdf.
Brookes PC, Powlson DS. Preventing phosphorus losses during perchloric acid digestion of sodium bicarbonate soil extracts. J Sci Food Agr. 1981;32:671-4. https://doi.org/10.1002/jsfa.2740320707
Cassol PC, Gianello C, Costa VEU. Frações de fósforo em estrumes e sua eficiência como adubo
fosfatado. Rev Bras Cienc Solo. 2001;25:635-44. https://doi.org/10.1590/S0100-06832001000300012
nabo forrageiro com aplicação de dejeto líquido de suínos. Cienc Rural. 2005;35:1287-95. https://doi.org/10.1590/S0103-84782005000600010
Ceretta CA, Girotto E, Lourenzi CR, Trentin G, Vieira RCB, Brunetto G. Nutrient transfer by runoff
under no tillage in a soil treated with successive applications of pig slurry. Agr Ecosyst Environ. 2010b;139:689-99. https://doi.org/10.1016/j.agee.2010.10.016
Ceretta CA, Lorensini F, Brunetto G, Girotto E, Gatiboni LC, Lourenzi CR, Tiecher TL, De Conti L, Trentin G, Miotto A. Frações de fósforo no solo após sucessivas aplicações de dejetos de suínos em plantio direto. Pesq Agropec Bras. 2010a;45:593-602. https://doi.org/10.1590/S0100-204X2010000600009
Comissão de Química e Fertilidade do Solo - CQFS-RS/SC. Manual de adubação e calagem para os estados do Rio Grande do Sul e Santa Catarina. Xanxerê: Sociedade Brasileira de Ciência do Solo - Núcleo Regional Sul; 2016.
Conceição PC, Dieckow J, Bayer C. Combined role of no-tillage and cropping systems in soil carbon stocks and stabilization. Soil Till Res. 2013;129:40-7. https://doi.org/10.1016/j.still.2013.01.006
Cordell D, Drangert J-O, White S. The story of phosphorus: global food security and food for thought. Global Environ Chang. 2009;19:292-305. https://doi.org/10.1016/j.gloenvcha.2008.10.009
Couto RR, Ferreira PAA, Ceretta CA, Lourenzi CR, Facco DB, Tassinari A, Piccin R, De Conti L, Gatiboni LC, Schapanski D, Brunetto G. Phosphorus fractions in soil with a long history of organic waste and mineral fertilizer addition. Bragantia. 2017;76:155-66. https://doi.org/10.1590/1678-4499.006
Dakora FD, Phillips DA. Root exudates as mediators of mineral acquisition in low-nutrient environments. Plant Soil. 2002;245:35-47. https://doi.org/10.1023/A:1020809400075
Gatiboni LC, Brunetto G, Kaminski J, Rheinheimer DS, Ceretta CA, Basso CJ. Formas de fósforo no solo após sucessivas adições de dejeto líquido de suínos em pastagem natural. Rev Bras Cienc Solo. 2008a;32:1753-61. https://doi.org/10.1590/S0100-06832008000400040
Gatiboni LC, Kaminski J, Rheinheimer DS, Brunetto G. Fósforo da biomassa microbiana e atividade de fosfatases ácidas durante a diminuição do fósforo disponível no solo. Pesq Agropec Bras. 2008b;43:1085-91. https://doi.org/10.1590/S0100-204X2008000800019
Gatiboni LC, Smyth TJ, Schmitt DE, Cassol PC, Oliveira CMB. Soil phosphorus thresholds in evaluating risk of environmental transfer to surface waters in Santa Catarina, Brazil. Rev Bras Cienc Solo. 2015;39:1225-34. https://doi.org/10.1590/01000683rbcs20140461
Girotto E, Ceretta CA, Brunetto G, Rheinheimer DS, Silva LS, Lourenzi CR, Lourensini F, Vieira RCB, Schmatz R. Acúmulo e formas de cobre e zinco no solo após aplicações sucessivas de dejeto líquido de suínos. Rev Bras Cienc Solo. 2010;34:955-65. https://doi.org/10.1590/S0100-06832010000300037
Grohskopf MA, Cassol PC, Corrêa JC, Albuquerque JA, Ernani PR, Mafra MSH, Mafra AL. Soil solution nutrient availability, nutritional status and yield of corn grown in a Typic Hapludox under twelve years of pig slurry fertilizations. Rev Bras Cienc Solo. 2016;40:e0150341. https://doi.org/10.1590/18069657rbcs20150341
Guardini R, Comin JJ, Rheinheimer DS, Gatiboni LC, Tiecher T, Schmitt D, Bender MA, Belli Filho P, Oliveira PAV, Brunetto G. Phosphorus accumulation and pollution potential in a hapludult fertilized with pig manure. Rev Bras Cienc Solo. 2012b;36:1333-42. https://doi.org/10.1590/S0100-06832012000400027
Guardini R, Comin JJ, Schmitt DE, Tiecher T, Bender MA, Rheinheimer DS, Mezzari CP, Oliveira BS, Gatiboni LC, Brunetto G. Accumulation of phosphorus fractions in typic Hapludalf soil after long-term application of pig slurry and deep pig litter in a no-tillage system. Nutr Cycl Agroecosys. 2012a;93:215-25. https://doi.org/10.1007/s10705-012-9511-3
Hedley MJ, Stewart JWB. Method to measure microbial phosphate in soils. Soil Biol Biochem. 1982;14:377-85. https://doi.org/10.1016/0038-0717(82)90009-8
International Fertilizer Industry Association – IFA [internet]. Paris: International
Fertilizer Industry Association; 2013 [accessed on 20 Aug 2013]. Available at: http://www.fertilizer.org/ifa/ifadata/results.
Jones DL, Oburger E. Solubilization of phosphorus by soil microorganism. In: Bünemann EK, Oberson A, Frossard E, editors. Phosphorus in action: biological processes in soil phosphorus cycling. New York: Springer; 2011. p.169-98.
Kaminski J, Rheinheimer DS, Bartz HR, Gatiboni LC, Bissani CA, Escosteguy PAV. Proposta de nova equação para determinação do valor de H+Al pelo uso do índice SMP em solos do RS e de
SC. In: 33a Reunião anual da rede oficial de laboratórios de análise de solo e de tecido vegetal
dos estados do Rio Grande do Sul e de Santa Catarina; 2001; Frederico Westphalen. Frederico Westphalen: Sociedade Brasileira de Ciência do Solo - Núcleo Regional Sul; 2001. p.21-26
Lourenzi CR, Ceretta CA, Brunetto G, Girotto E, Tiecher TL, Vieira RCB, Cancian A, Ferreira PAA. Pig slurry and nutrient accumulation and dry matter and grain yield in various crops. Rev Bras Cienc Solo. 2014b;38:949-58. https://doi.org/10.1590/S0100-06832014000300027
Lourenzi CR, Ceretta CA, Cerini JB, Ferreira PAA, Lorensini F, Girotto E, Tiecher TL, Schapanski
DE, Brunetto G. Available content, surface runoff and leaching of phosphorus forms in a
Typic Hapludalf treated with organic and mineral nutrient sources. Rev Bras Cienc Solo. 2014a;38:544-56. https://doi.org/10.1590/S0100-06832014000200019
Lourenzi CR, Scherer EE, Ceretta CA, Tiecher TL, Cancian A, Ferreira PAA,
Brunetto G. Atributos químicos de Latossolo após sucessivas aplicações de composto
orgânico de dejeto líquido de suínos. Pesq Agropec Bras. 2016;51:233–242.
https://doi.org/10.1590/S0100-204X2016000300005
Martinazzo R, Rheinheimer DS, Gatiboni LC, Brunetto G, Kaminski J. Fósforo microbiano do solo sob sistema plantio direto em resposta à adição de fosfato solúvel. Rev Bras Cienc Solo. 2007;31:563-70. https://doi.org/10.1590/S0100-06832007000300016
McDowell RW, Stewart I. Phosphorus in fresh and dry dung of grazing dairy cattle, deer, and sheep. J Environ Qual. 2005;34:598-607. https://doi.org/10.2134/jeq2005.0598
Mellek JE, Dieckow J, Silva VL, Favaretto N, Pauletti V, Vezzani FM, Souza JLM. Dairy liquid manure and no-tillage: physical and hydraulic properties and carbon stocks in a Cambisol of Southern Brazil. Soil Till Res. 2010;110:69-76. https://doi.org/10.1016/j.still.2010.06.005
Morel C, Tiessen H, Stewart JWB. Correction for P sorption in the measurement of
soil microbial biomass P by CHCl3 fumigation. Soil Biol Biochem. 1996;28:1699-706.
https://doi.org/10.1016/S0038-0717(96)00245-3
Murphy J, Riley JP. A modified single solution method for the determination of phosphate in
natural waters. Anal Chim Acta. 1962;27:31-6. https://doi.org/10.1016/S0003-2670(00)88444-5
Nannipieri P, Giagnoni L, Landi L, Renella G. Role of phosphatase enzymes in soil. In: Bünemann EK, Oberson A, Frossard E, editors. Phosphorus in action: biological processes in soil phosphorus cycling. New York: Springer; 2011. p.215-43.
Nziguheba G, Bünemann EK. Organic phosphorus dynamics in tropical agroecosystems. In: Turner BL, Frossard E, Baldwin D, editors. Organic phosphorus in the environmental. Wallingford: CAB International; 2005. p.243-68.
Olsen SR, Sommers LE. Phosphorus. In: Page AL, Miller RH, Keeney DR, editors. Methods of soil analysis. 2nd ed. Madison: American Society of Agronomy; 1982. Pt 2. p.403-30.
Panuelas J, Sardans J, Alcaniz JM, Poch JM. Increased eutrophication and nutrient imbalances in the agricultural soil of NE Catalonia, Spain. J Environ Biol. 2009;30:841-6.
Quiquampoix H, Mousain D. Enzymatic hydrolysis of organic phosphorus. In: Turner BL, Frossard E, Baldwin D, editors. Organic phosphorus in the environmental. Wallingford: CAB International; 2005. p.89-112.
R Core Team R: A language and environment for statistical computing. R Foundation for Statistical Computing. Vienna, Austria: 2013. Available at: https://www.r-project.org/.
Rheinheimer DS, Anghinoni I, Conte E. Fósforo da biomassa microbiana em solos sob diferentes sistemas de manejo. Rev Bras Cienc Solo. 2000;24:589-97. https://doi.org/10.1590/S0100-06832000000300012
Rheinheimer DS, Campos BHC, Giacomini SJ, Conceição PC, Bortoluzzi EC. Comparação de métodos de determinação de carbono orgânico total no solo. Rev Bras Cienc Solo. 2008a;32:435-40. https://doi.org/10.1590/S0100-06832008000100041
Rheinheimer DS, Martinazzo R, Gatiboni LC, Kaminski J, Silva LS. Amplitude no fósforo microbiano em um Argissolo em pastagem nativa submetida nativa submetida à roçada e à introdução de espécies forrageiras à roçada e à introdução de espécies forrageiras com fertilização fosfatada em diferentes épocas. Acta Sci-Agron. 2008b;30:561-7. https://doi.org/10.4025/actasciagron.v30i4.5319
Santos NZ, Dieckow J, Bayer C, Molin R, Favaretto N, Pauletti V, Piva JT. Forages, cover crops and related shoot and root additions in no-till rotations to C sequestration in a subtropical Ferralsol. Soil Till Res. 2011;111:208-18. https://doi.org/10.1016/j.still.2010.10.006
Santos HG, Jacomine PKT, Anjos LHC, Oliveira VA, Oliveira JB, Coelho MR, Lumbreras JF, Cunha
TJF. Sistema brasileiro de classificação de solos. 3a ed. Rio de Janeiro: Embrapa Solos; 2013.
Shen J, Yuan L, Zhang J, Li H, Bai Z, Chen X, Zhang W, Zhang F. Phosphorus dynamics: from soil to plant. Plant Physiol. 2011;156:997-1005. https://doi.org/10.1104/pp.111.175232
Silva JLS. Estudo dos processos de silicificação e calcificacão em Rochas Sedimentares
Mesozóicas do Rio Grande do Sul, Brasil [tese]. Porto Alegre: Universidade Federal do Rio Grande do Sul; 1997.
Soil Survey Staff. Keys to soil taxonomy. 12th ed. Washington, DC: United States Department of
Agriculture, Natural Resources Conservation Service; 2014.
Souza ED, Costa SEVGA, Anghinoni I, Lima CVS, Carvalho PCF, Martins AP. Biomassa microbiana do solo em sistema de integração lavoura-pecuária em plantio direto, submetido a intensidades de pastejo. Rev Bras Cienc Solo. 2010;34:79-88. https://doi.org/10.1590/S0100-06832010000100008
Tabatabai MA, Bremner JM. Use of p-nitrophenyl phosphate for assay of soil phosphatase
activity. Soil Biol Biochem. 1969;1:301-7. https://doi.org/10.1016/0038-0717(69)90012-1
Tedesco MJ, Gianello C, Bissani CA, Bohnen H, Volkweiss SJ. Análises de solo, plantas e outros materiais. 2a ed. Porto Alegre: Universidade Federal do Rio Grande do Sul; 1995. (Boletim técnico, 5).
Tiecher T, Caner L, Minella JPG, Bender MA, Rheinheimer DS. Tracing sediment sources in a subtropical rural catchment of southern Brazil by using geochemical tracers and near-infrared spectroscopy. Soil Till Res. 2016;155:478-91. https://doi.org/10.1016/j.still.2015.03.001
Tiecher T, Caner L, Minella JPG, Rheinheimer DS. Combining visible-based-color parameters and geochemical tracers to improve sediment source discrimination and apportionment. Sci Total Environ. 2015;527-528:135-49. https://doi.org/10.1016/j.scitotenv.2015.04.103
Tiecher T, Minella JPG, Caner L, Evrard O, Zafar M, Capoane V, Le Gall M, Rheinheimer DS. Quantifying land use contributions to suspended sediment in a large cultivated catchment of Southern Brazil (Guaporé River, Rio Grande do Sul). Agr Ecosyst Environ. 2017;237:95-108. https://doi.org/10.1016/j.agee.2016.12.004
Tiecher T, Rheinheimer DS, Calegari A. Soil organic forms under different soil management
systems and winter crops, in a long term experiment. Soil Till Res. 2012a;124:57-67. https://doi.org/10.1016/j.still.2012.05.001
Tiecher T, Rheinheimer DS, Kaminski J, Calegari A. Forms of inorganic phosphorus in soil under
different long term soil tillage systems and winter crops. Rev Bras Cienc Solo. 2012b;36:271-81.
https://doi.org/10.1590/S0100-06832012000100028
Tiecher T, Zafar M, Mallmann FJK, Bortoluzzi EC, Bender MA, Ciotti LH, Rheinheimer DS. Animal manure phosphorus characterization by sequential chemical fractionation,
release kinetics and 31
Xue QY, Shamsi IH, Sun DS, Ostermann A, Zhang QC, Zhang YS, Lin XY. Impact of manure
application on forms and quantities of phosphorus in a Chinese Cambisol under different land
use. J Soils Sediments. 2013;13:837-45. https://doi.org/10.1007/s11368-012-0627-5
Walkley A, Black IA. An examination of the Degtjareff method for determining soil organic matter and a proposed modification of the chromic acid titration method. Soil Sci.
1934;37:29-38. https://doi.org/10.1097/00010694-193401000-00003
Wang W, Liang T, Wang L, Liu Y, Wang Y, Zhang C. The effects of fertilizer applications on runoff loss of phosphorus. Environ Earth Sci. 2013;68:1313-19.