ABSTRACT:Phosphorus (P) applications at dosages higher than the necessary may cause P buildup in the soil labile fractions and, consequently, pollution of water sources. This study aimed to assess accumulation of P fractions as well as the parameters of adsorption isotherms in soil profiles having a history of application of phosphate fertilizers and cultivated with apple trees. Soil samples were collected from an area with no history of cultivation and 2 apple orchards cultivated for 8 (P8) and 18 (P18) years, in the city of Urubici, Santa Catarina, southern Brazil. Soil samples were air dried, sieved in a 2-mm mesh, and subjected to chemical analyses (P adsorption) besides P chemical
SOIL AND PLANT NUTRITION -
Article
Phosphorus fractions in apple orchards in
southern Brazil
Djalma Eugênio Schmitt1, Gustavo Brunetto2*, Elaine dos Santos3, Winicius de Lima Wagner3,
Paula Beatriz Sete4, Monique Souza4, Vítor Gabriel Ambrosini5, Matheus Ademir dos Santos3,
Tales Tiecher2, Jucinei José Comin3, Rafael da Rosa Couto4, Luciano Colpo Gatiboni1, Admir Giachini3
1. Universidade do Estado de Santa Catarina - Departamento de Solos e Recursos Naturais - Lages (SC), Brazil. 2. Universidade Federal de Santa Maria - Centro de Ciências Rurais - Departamento de Solos - Santa Maria (RS), Brazil. 3. Universidade Federal de Santa Catarina - Engenharia Rural - Florianópolis (SC), Brazil.
4. Universidade Federal de Santa Catarina - Programa de Pós-Graduação em Agroecossistemas - Florianópolis (SC), Brazil. 5. Universidade Federal do Rio Grande do Sul - Programa de Pós-Graduação em Ciência do Solo - Porto Alegre (RS), Brazil.
*Corresponding author: [email protected]
Received: May 9, 2016 – Accepted: Oct. 3, 2016
INTRODUCTION
The southern region of Brazil, especially the states of Rio Grande do Sul (RS) and Santa Catarina (SC), has climate characteristics that are favorable to the growing of apple trees (Malus domestica), with dominant humid mesothermal climate and mild summers (Cfb, according to Köppen-Geiger climate classification).
Santa Catarina has 17,604.00 ha of apple orchards, which is the largest area among the Brazilian states. Every year, 613,828 t of apples are grown, representing 46% of the national production (Goulart Junior 2015). Soils cultivated with apple trees are often shallow, with high potential acidity and low natural fertility (Nava et al. 2002). Therefore, before the introduction of apple seedlings, the soil acidity should be corrected with the application of lime to raise the pH levels in water to around 6.0. Additionally, fertilizers should be added to increase phosphorus (P), potassium (K) (CQFS-RS/SC 2004), and nitrogen (CQFS-RS/SC 2004) contents to the necessary levels for plant growth. Maintenance fertilization is performed when the plants start producing and is determined by a combined analysis of total nutrients in leaves, fruits, soil (every 3 years), and expected production (CQFS-RS/SC 2004). However, the fertilization in soils grown with fruit species is not always consistent with the recommended technical criteria, which may cause P buildup, particularly in the upper soil layers, and saturation of the adsorption sites of the soil reactive particles (Schmitt et al. 2013a).
The concentration of P in soil depends on the source material, pedogenesis, soil texture, and environmental factors. In addition, the rate and type of P applied as well as the cultivation history also affect P availability (Sharpley 2011). Numerous studies dealing with accumulation of P fractions in the soil have been conducted, based on the chemical fractionation method proposed by Hedley et al. (1982). This method uses, sequentially, chemical extractors that remove inorganic and organic P from the most available to the most stable fractions. Through the chemical fractionation of P, it has been observed the occurrence of inorganic and organic fractions of this nutrient in soils with a history of successive applications of phosphate fertilizers in annual crops (Ciampitti et al. 2011; Linquist et al. 2011; Tiecher et al. 2012a,b) as well as in fruit crops (Schmitt et al. 2013a,b; Brunetto et al.
2013; Schmitt et al. 2014). However, such accumulation is often more pronounced in the inorganic fractions. The adsorption of the applied P takes place in the most avid — and with the highest binding strength — sites first, and later the remaining P is redistributed into fractions with lower energy (Rheinheimer and Anghinoni 2001). Thus, it is expected that, if regular applications of phosphate fertilizer in maintenance fertilization over the years are greater than the amounts required by the apple trees and the plants that coexist in the orchard lines, even the amount of P extracted from the fruits which are very low (1.5 to 3.0 g·kg–1) (Nava 2012), P
accumulation and redistribution into different organic and inorganic fractions will occur, with possible decrease in the maximum P adsorption capacity (MPAC) (Schmitt et al. 2013a). MPAC is an indicator of the soil capacity for P adsorption, which is highly associated with clay contents (Oliveira et al. 2014) and P application rates (Schmitt et al. 2013a). MPAC can be established by adsorption isotherms, adjusted by mathematical models, such as the one proposed by Koski-Vähälä and Hartikainen (2001). With this model, we can determine the decrease in MPAC of soils that have a history of frequent application of phosphate fertilizers, especially on the topsoil layers (Schmitt et al. 2013a).
This work aimed to assess P fractions and the parameters associated with P adsorption in the profile of soils cultivated with apple trees in southern Brazil, with historical application of phosphate fertilizers.
MATERIAL AND METHODS
Site description
Soil samples from 2 commercial apple orchards and 1 from a native area were collected in the city of Urubici (SC), southern region of Brazil (long 49°35′30′W, lat 28°0′5′S). Soils were classified as Humic Cambisol (Embrapa 2013). The climate in the region is humid mesothermal with mild summers (Cfb, Köppen’s classification), with mean annual rainfall of 1,537 mm, mean temperature of 15.4 °C, with potential occurrences of 20 to 29 frosts over the year, and the accumulated chilling hours under 7.2 °C ranging from 642 to 847 h per year.
and 0.5 m between plants in the line). Orchard 2, 18 years old (P18), was implemented in 1993, with density of 1,482 plants per ha (4.5 m between rows and 1.5 m between plants in the line). The orchards have 2 commercial apple varieties, Gala and Fuji, corresponding to 70 and 30% of the plants, respectively. The chosen system consisted of the central leader. Plants of both orchards were grafted onto Marubakaido rootstocks, P8 with an M9 20-cm filter, and P18 with no filter. Before planting, the lime was applied at a dosage sufficient to raise pH in water to 6.0. It was applied to the surface and incorporated into approximately 0.20 m depth with 1 plowing and 1 harrowing pass. In the pre-planting fertilization stage, 33 kg of K·ha–1 and 130 kg
of P2O5·ha
–1 were added to the orchard soils. Every year,
approximately 91 kg of N·ha–1, 145 kg of P 2O5·ha
–1, and
509 kg of K2O·ha
–1 were applied to the P8 orchard soil, as
well as 64 kg of N·ha–1, 91 kg of P 2O5·ha
–1, and 364 kg of
K2O·ha
–1 were applied to the P18 orchard soil. N, P 2O5,
and K2O were applied as urea, triple superphosphate, and
potassium chloride, respectively. The fertilizers were applied only in the planting row soil (tree canopy projection), on the topsoil, and not incorporated into lower layers. On a yearly basis, the control of weeds within lines was made with the use of herbicides (glyphosate as active ingredient), whereas, between rows, the vegetation was mowed every 90 days, with residues disposed onto the soil surface. The predominant plants that grew spontaneously between the orchard rows were white clover (Trifolium repens), red clover (Trifolium pratenses), bahiagrass (Paspalum notatum), and Chaptalia nutans, a genus of the daisy family. The native field used as reference did not have a history of farming and fertilizer addition, consisting primarily of Paspalum notatum and Desmodium spp.
Soil collecting
In October 2011, 8 years after implementing orchard 1 (P8) and 18 years after implementing orchard 2 (P18), 6 trenches were opened in each orchard, measuring 0.3 × 0.5 × 0.5 m. The trenches were open in the rows. In the native area, 6 trenches were dug randomly in the same dimensions as for the orchards. Soil samples were collected from 0.0 – 0.025; 0.025 – 0.05; 0.05 – 0.10; 0.10 – 0.15; 0.15 – 0.20, and 0.20 – 0.40 m depths in each trench. The soil was air dried, sieved in a 2-mm mesh, and set aside for further analysis.
Physical and chemical characteristics of the soil
For the soil samples, the particle size distribution of the soil constituents was determined by the pipette method (Embrapa 1997) (Table 1). Soil organic carbon was calculated by the Walkley-Black (Embrapa 1997) method, and soil organic matter (SOM) by multiplying the total organic carbon content by 1.724 (Tedesco et al. 1995). Soil pH (in water) was measured using a soil:water suspension at 1:1 v/v, determined after 30 min of equilibrium. Subsequently, a SMP pH 7.5 buffer solution was added to the suspension, and the pH was measured again after 15 min. Available P and K were extracted with Mehlich-1 solution (0.05 mol·L–1 HCl + 0.0125 mol·L–1
H2SO4). P was determined by spectrophotometry, while
K, by flame photometry. Exchangeable Ca,Mg, and Al levels were extracted with 1 mol·L–1 KCl. Ca and Mg
concentrations were determined by atomic absorption spectrometry (AAS), and A1 titration, with 0.025 mol·L–1
NaOH. Effective cation exchange capacity (CECeffective)
was calculated by the sum of the exchangeable cations Al + Ca + Mg + K. Cation exchange capacity at pH 7.0
(CECpH7.0) was calculated by the sum of exchangeable
bases (Ca + Mg + K), plus H + Al, and estimated using the equation proposed by Kaminski et al. (2002), adopted by CQFS-RS/SC (2004) (Table 1).
Phosphorus chemical fractionation and phosphorus adsorption isotherms
P chemical fractionation was performed according to the method of Hedley et al. (1982), with modifications proposed by Condron and Goh (1989) and Gatiboni et al. (2013), briefly described as follows: 0.5 g of soil were subjected to sequential extraction with an anion exchange resin (PiRTA), removing labile inorganic P fraction; inorganic
and organic P label forms extracted by 0.5 M NaHCO3
(Pibic and Pobic), which may contribute to the plants’ nutrient
supply; organic and inorganic P extracted by 0.1 M NaOH (Pihid and Pohid) and inorganic and organic P extracted by
0.5 M NaOH (Pihid05 and Pohid05), representing the inorganic
P on the oxides and silicate clays with intermediary binding energy and the moderate labile organic P fraction; and strongly adsorbed inorganic P extracted by 1 M HCl (PiHCl).
which may contribute to plant nutrition in situations of extreme shortage in the soil.
The inorganic P of the alkaline extracts of NaHCO3
and NaOH was determined by the method proposed by Dick and Tabatabai (1977). In such alkaline extracts, the total P was determined by autoclave digestion with ammonium persulfate + sulfuric acid; in turn, the organic P was determined by the difference between the total and the inorganic P. The concentration of P in the acid extracts was determined according to Murphy and Riley (1962). P fractions from the Hedley fractionation were grouped into total P inorganic and P organic fractions (Cross and Schlesinger 1995). The total P inorganic fraction was determined by the sum of the inorganic fractions (anion exchange resin + 0.5 M NaHCO3 + 0.1 M NaOH
+ 0.5 M NaOH + 1 M HCl), while the total P organic fraction, by the sum of the organic fractions (0.5 M NaHCO3 + 0.1 M NaOH + 0.5 M NaOH).
The remaining soil samples from the 0.0 – 0.025 and 0.15 – 0.20 m layers were subjected to determination of P
adsorption isotherm parameters, as described by Koski-Vähälä and Hartikainen (2001). For that, 1.0 g of dried soil was added to 15-mL Falcon tubes. Next, 10 mL of a 0.001 mol·L–1 CaCl
2 solution were added, containing 10
different P concentrations (0.0; 0.5; 1.0; 2.5; 5.0; 7.0; 10.0; 25.0; 50.0 and 75.0 mg·L–1), corresponding to 0, 5, 10, 25, 50, 70,
100; 250; 500 and 750 mg of P·kg–1 of soil, respectively. Soon
afterwards, the tubes underwent continuous stirring for 16 h in 33-rpm end-over-end, at a temperature of ±25 °C. Later on, the samples were centrifuged at 2,510 g for 10 min, and, in the extract, the remaining P level in solution was determined by the method proposed by Murphy and Riley (1962). The absorbed P was estimated by the difference between the amount added and the amount recovered in the equilibrium solution. Subsequently, the data were adjusted by the mathematical model (Eq.1) proposed by Koski-Vähälä and Hartikainen (2001):
Site Layer (m)
Chemical constituents
Clay(a) Silt(a) Sand(a) pH-H
2O (b)
Organic matter(b)
P available(c) Ca
2+(a) Mg2+(a) CEC
pH 7.0
(d) CEC
effective (d)
g·kg–1 g·kg–1 mg·kg–1 cmol
c·dm –3
Native area
0.0 – 0.025 91 545 364 5.0 105.5 7.1 4.6 3.6 31.5 10.2 0.025 – 0.05 106 560 334 4.0 73.1 3.9 2.4 2.4 32.9 7.2
0.05 – 0.10 113 540 347 3.9 72.8 2.9 1.4 1.3 32.1 6.0 0.10 – 0.15 111 537 352 3.8 69.8 1.9 0.8 1.0 38.4 5.6 0.15 – 0.20 139 515 345 3.7 45.2 1.6 0.7 0.7 40.6 6.1 0.20 – 0.40 151 483 366 3.7 41.5 0.6 0.5 0.6 33.6 5.7
P8
0.0 – 0.025 240 195 565 5.2 50.0 35.3 6.5 8.0 15.1 10.2 0.025 – 0.05 257 182 561 6.1 47.1 19.7 6.8 3.1 12.8 10.3 0.05 – 0.10 259 186 555 6.22 37.4 21.7 7.2 3.2 13.4 10.6 0.10 – 0.15 272 171 557 6.4 38.1 8.6 6.0 4.5 13.5 10.7 0.15 – 0.20 272 168 560 6.1 32.5 4.8 6.7 4.6 14.5 11.5 0.20 – 0.40 213 192 595 5.3 13.2 1.5 5.4 3.7 14.4 9.4
P18
0.0 – 0.025 209 211 580 5.2 63.5 95.6 6.8 6.5 21.7 14.2 0.025 – 0.05 216 199 585 4.9 55.4 95.3 7.7 2.4 18.7 10.5 0.05 – 0.10 209 210 582 5.1 41.1 83.1 13.7 3.2 17.5 10.9 0.10 – 0.15 212 201 587 5.4 27.1 83.3 8.2 3.1 16.7 11.7 0.15 – 0.20 213 208 580 5.5 27.3 79.1 9.0 3.0 17.0 12.3 0.20 – 0.40 241 185 574 5.5 29.6 51.8 6.7 3.4 14.3 10.4
Table 1. Chemical constituent levels of 6 layers of Humic Cambisol soils from a native area as well as from an 8-year-old (P8) and 18-year-old apple orchards (P18) grown in the plateau region of Santa Catarina, Brazil.
(a)Embrapa (1997); (b)Tedesco et al. (1995); (c)Murphy and Riley (1962); (d)CQFS-RS/SC (2004).
(1)
where: Psolution is the concentration of P in the equilibrium
solution; km is the concentration of P in the solution that allows for half of the maximum P adsorption; Qo is
the amount of P desorbed in distilled water.
The equilibrium phosphorus concentration (EPC) was determined by adjusting the data via the mathematical model proposed by Koski-Vähälä and Hartikainen (2001). These authors introduced the amount of P desorbed in distilled water (Qo) that is visually represented by the
intersection of lines in the ordinate axis and the EPC, by the intersection of the x axis (Eq. 1).
Statistical treatment of the data
P concentrations in the different soil layers in the same site, or within the same layer between the orchards and the native area, were subjected to analysis of variance (ANOVA). P content was used as a dependent variable, while soil layer and site, as independent variables. The results of all analyses were verified by F-test, and when ANOVA was significant, means were separated according to Tukey’s test (p ≤ 0.05).
RESULTS AND DISCUSSION
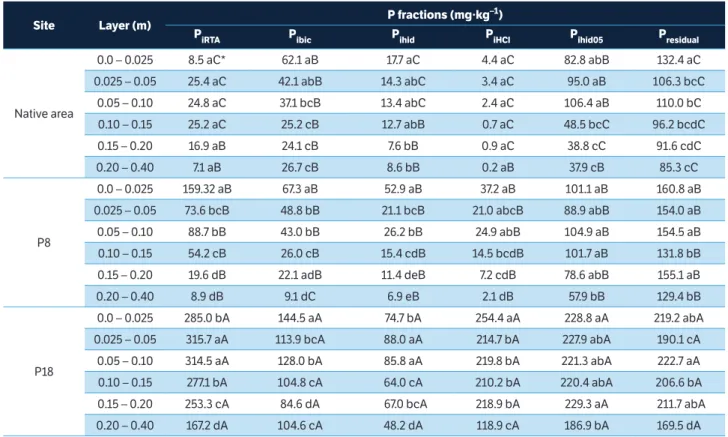
Continuous applications of phosphate fertilizers in apple tree orchards in southern Brazil increased the levels of inorganic P in all fractions assessed (Table 2). PiRTA and Pibic fractions were higher in apple-grown
soils, especially P18. Levels of PiRTA (mg·kg
–1)at the
20-cm layer (weighted mean) were 20.95 for the native area, 69.73 for P8, and 286.31 for P18. Such contents are considered high (over 20 mg·kg–1) for a native soil
and very high (over 40 mg·kg–1) for cultivated (P8 and
P18) soils (CQFS-RS/SC 2004). Nonetheless, average contents of available P extracted by Mehlich-1 in the same soil fraction were 3.0; 15.6 and 85.2 mg·kg–1 for
the native, P8, and P18 soils, respectively (Table 1). These contents are considered very low (≤ 3 mg·kg–1 for native
area soil), high (12.1 – 24 mg·kg–1 for P8), and very high
(> 24 mg·kg–1 for P18) for such soils (CQFS-RS/SC
2004). These values indicate appropriate P contents in the P8 soil and above the recommended levels in the P18 one. The latter shows no production increases when
Site Layer (m) P fractions (mg·kg
–1)
P
iRTA Pibic Pihid PiHCl Pihid05 Presidual
Native area
0.0 – 0.025 8.5 aC* 62.1 aB 17.7 aC 4.4 aC 82.8 abB 132.4 aC 0.025 – 0.05 25.4 aC 42.1 abB 14.3 abC 3.4 aC 95.0 aB 106.3 bcC
0.05 – 0.10 24.8 aC 37.1 bcB 13.4 abC 2.4 aC 106.4 aB 110.0 bC 0.10 – 0.15 25.2 aC 25.2 cB 12.7 abB 0.7 aC 48.5 bcC 96.2 bcdC 0.15 – 0.20 16.9 aB 24.1 cB 7.6 bB 0.9 aC 38.8 cC 91.6 cdC 0.20 – 0.40 7.1 aB 26.7 cB 8.6 bB 0.2 aB 37.9 cB 85.3 cC
P8
0.0 – 0.025 159.32 aB 67.3 aB 52.9 aB 37.2 aB 101.1 aB 160.8 aB 0.025 – 0.05 73.6 bcB 48.8 bB 21.1 bcB 21.0 abcB 88.9 abB 154.0 aB 0.05 – 0.10 88.7 bB 43.0 bB 26.2 bB 24.9 abB 104.9 aB 154.5 aB 0.10 – 0.15 54.2 cB 26.0 cB 15.4 cdB 14.5 bcdB 101.7 aB 131.8 bB 0.15 – 0.20 19.6 dB 22.1 adB 11.4 deB 7.2 cdB 78.6 abB 155.1 aB 0.20 – 0.40 8.9 dB 9.1 dC 6.9 eB 2.1 dB 57.9 bB 129.4 bB
P18
0.0 – 0.025 285.0 bA 144.5 aA 74.7 bA 254.4 aA 228.8 aA 219.2 abA 0.025 – 0.05 315.7 aA 113.9 bcA 88.0 aA 214.7 bA 227.9 abA 190.1 cA
0.05 – 0.10 314.5 aA 128.0 bA 85.8 aA 219.8 bA 221.3 abA 222.7 aA 0.10 – 0.15 277.1 bA 104.8 cA 64.0 cA 210.2 bA 220.4 abA 206.6 bA 0.15 – 0.20 253.3 cA 84.6 dA 67.0 bcA 218.9 bA 229.3 aA 211.7 abA 0.20 – 0.40 167.2 dA 104.6 cA 48.2 dA 118.9 cA 186.9 bA 169.5 dA
Table 2. Fractions of inorganic and residual P (Presidual) extracted by anion exchange resin (PiRTA), 0.5 mol·L –1 NaHCO
3 (Pibic), 0.1 mol·L –1 NaOH
(Pihid), 1 mol·L–1 HCl (Pi
HCl), and 0.5 mol·L
–1 NaOH (Pi
hid05) of Humic Cambisol soils from a native area as well as from an 8-year-old (P8) and
18-year-old apple orchards (P18) grown in the plateau region of Santa Catarina, Brazil.
compared to the former; it only increases the risk for environmental contamination (CQFS-RS/SC 2004; Bai et al. 2013). Gatiboni et al. (2014) conducted a study in soils from Santa Catarina state to assess the potential of P released to water as a function of clay contents in the soil, as well as the contents of available P determined by Mehlich-1. These authors recommend that the limit of P contents in the soil is reached when the available P extracted by Mehlich-1 exceeds the percentage of clay plus 40. Therefore, for P18, which has 21% of clay, the P critical limit is 61 mg·kg–1. Above this threshold, the
amount of P desorbed in water would increase dramatically. In the P18 soil, Mehlich-1 resulted in 85.2 mg P·kg–1,
indicating high potential of P transfer to water. It can be seen that, for P18, the amount of P applied in maintenance fertilization during crop cycles is probably higher than the amount of P required by the soil and the trees; therefore, it can explain the high contents of PiRTA and Pibic (Table 2).
Results for the Pihid and Pihid05 showed similar
tendencies as for the PiRTA and Pibic fractions, with
higher P contents in the upper surface layers and orchard areas, particularly P18 (Table 2). The P fraction obtained with NaOH extracts mainly the P linked to Fe and Al oxyhydroxides (Cross and Schlesinger1995). Such P levels are proportional to the amount of oxides present in the clay fraction of the soil (Rheinheimer et al. 2008), as well as the previous addition of phosphate fertilizers to the soil (Ciampitti et al. 2011). PiHCl contents were higher at
the topsoil, particularly in the P8 and P18 apple orchards. In the soil of the native area, PiHCl levels were lower and
considered consistent with the weathered soils found in southern Brazil (Rheinheimer et al. 2008; Schmitt et al. 2013b; Schmitt et al. 2014), where apatite is nearly absent. The highest PiHCl levels found in the P8 and P18
soils are results of the combined action of phosphate fertilizer additions, the raise in soil pH, and the addition of Ca from liming, conditions that are conducive to the neo-formation of Ca phosphate, which is solubilized by 1 mol·L–1 HCl. Rheinheimer and Anghinoni (2001)
comment that, in no-tillage soils in southern Brazil, an increase in Ca-bound P fractions may occur in soils under continuous application of topsoil phosphate fertilizers. Therefore, a similar phenomenon has likely occurred in the soils of both orchards, because apple growers usually do not define the need and dosage of P based on technical
standards for the crop, such as soil and tissue analysis and expected crop yields. Therefore, fertilizers are generally applied in dosages above the crop needs. In addition, P transport within the plant is low, usually 6 kg P·ha–1
year–1 in orchards that have an average production of
60 t·ha–1 (Nachtigall et al. 2004). The contents of P residual
extracted by H2SO4 + H2O2 + MgCl2 were higher in the
P18 soil. This portion represents recalcitrant P, to which plants have difficult access. It may contribute to the plants nutrition only when there is extreme lack of this nutrient in the soil (Schmitt et al. 2013a). Some studies have shown that, in numerous soils from southern Brazil, most of the available P is found in the residual fraction (Rheinheimer et al. 2008; Gonçalves and Meurer 2009). However, after the addition of phosphate fertilizers, a rearrangement of P in the soil and P buildup in all fractions may occur. The event magnitude depends on the P application rate and transport.
Similarly to the concentrations of inorganic P, there was an increase in organic P in all fractions of the soils cultivated with apple trees (Table 3). The highest concentrations of Pobic were found in the P18 soil, except
in the 0.05 – 0.10 m layer, where the concentrations were similar to those of the P8 soil. This organic P fraction can be easily mineralized by soil microorganisms (Cross and Schlesinger 1995) and so it can contribute to the inorganic P, especially in soils with low contents of available P, such as that of the native area. The concentrations of Pohid and Pohid05 were similar to those of Pobic, higher in
the P18 soil. Such higher contents can be explained by the application of fertilizers and lime, which improves the chemical conditions of the soil. Thus, there was an increased production of understory plants that coexist in the orchards, added to the deposition of apple senescent leaves and pruned branches on the soil surface. Following the decomposition of plant debris and thinnest senescent roots in the upper layers of the soil, part of the P present in those tissues may be transported to the soil, cycling the nutrient and incrementing its fractions in the soil (Brunetto et al. 2011).
Table 3. Fractions of organic P extracted by 0.5 mol·L–1 NaHCO
3 (Pibic), 0.1 mol·L
–1 NaOH (Po
hid), and 0.5 mol·L
–1 NaOH (Po
hid05) of Humic
Cambisol soils from a native area as well as from an 8-year-old (P8) and 18-year-old apple orchards (P18) grown in the plateau region of Santa Catarina, Brazil.
Site
P fractions
Layer (m) Po
bic(mg·kg
–1) Po
hid(mg·kg
–1) Po
hid05(mg·kg
–1)
Native area
0.0 – 0.025 73.2 aC* 195.2 aC 82.8 abB
0.025 – 0.05 54.9 abC 161.8 bC 95.0 aB
0.05 – 0.10 59.4 abB 118.1 cC 106.4 aB
0.10 – 0.15 45.3 abC 107.5 cdC 48.5 bcC
0.15 – 0.20 34.2 bcC 89.6 dC 38.8 cC
0.20 – 0.40 8.9 cC 56.2 eC 37.9 cB
P8
0.0 – 0.025 435.5 aB 338.9 aB 101.1 aB
0.025 – 0.05 224.3 cB 214.4 cB 88.9 abB
0.05 – 0.10 277.0 bA 248.5 bB 104.9 aB
0.10 – 0.15 196.8 cB 200.4 cB 101.7 aB
0.15 – 0.20 149.1 dB 145.5 dB 78.56 abB
0.20 – 0.40 78.0 eB 120.9 dB 57.9 bB
P18
0.0 – 0.025 549.1 aA 565.2 bA 228.8 aA
0.025 – 0.05 358.6 bA 630.2 aA 227.9 abA 0.05 – 0.10 301.8 cA 528.2 cA 221.3 abA 0.10 – 0.15 302.3 cA 499.7 dA 220.4 abA
0.15 – 0.20 293.7 cA 433.5 eA 229.3 aA
0.20 – 0.40 291.5 cA 272.8 fA 186.9 bA
.
*Means followed by the same lower case letter between layers of the same site and means followed by the same upper case letter in the column within the same layer between sites are not significantly different by Tukey’s test at 5% probability level.
(a)Total inorganic P, sum of inorganic fractions; (b)Total organic P, sum of organic fractions.*Means followed by the same lower case letter in the column and means
followed by the same upper case letter in the row are not significantly different according to Tukey’s test at 5% probability level. NA = Native area.
Table 4. Total inorganic and total organic P of Humic Cambisol soils from a native area as well as from an 8-year-old (P8) and 18-year-old apple orchards (P18) grown in the plateau region of Santa Catarina, Brazil.
P
fractions Layer (m) NA
P8 Increase in
relation to the NA P18
Increase in relation to the NA
mg·kg–1 times mg·kg-1 times
Total inorganic
P(a)
0.0 – 0.025 175.4 aC* 417.8 aB 1.1 987.5 aA 1.5 0.025 – 0.05 180.2 aC 253.4 cB 0.9 960.2 aA 1.3
0.05 – 0.10 184.1 aC 287.6 bB 0.8 970.4 aA 1.1
0.10 – 0.15 112.3 bC 211.9 cB 1.0 877.5 bA 1.5 0.15 – 0.20 88.4 bC 139.9 dB 0.9 853.2 bA 1.6 0.20 – 0.40 80.4 bB 84.8 eB 0.6 625.8 cA 1.3
CV% 1.9
Total organic
P(b)
into Po by higher biomass production, particularly by the understory opportunistic plants coexisting with the apple trees. Furthermore, studies show that additions of inorganic P above the plants extraction capacity cause accumulation of organic fractions (Ciampitti et al. 2011; Schmitt et al. 2014). Thus, plants and microorganisms have sufficient amounts of nutrients for development without the need to mineralize the organic sources. On the other hand, in the native soil, which shows low levels of P, plants and microorganisms must have adaptive strategies, such as exudation of phosphatases, to obtain the required amount of P (Schen et al. 2011).
Distribution of P in organic and inorganic forms in soils cultivated with apple trees was very similar to that found in the native area (Table 4). This shows that phosphate buildup by applications of fertilizers occurs in both organic and inorganic forms, contrasting the studies conducted by Brunetto et al. (2013) and Couto et al. (2014), who showed a preferential P accumulation in the inorganic forms, previously present in the soil. These results may be explained by the high concentrations of organic matter (> 5%; CQFS-RS/SC 2004), both in the native and in the orchards soils, caused by the higher altitude and, consequently, the lower atmosphere and soil temperature (Oliveira et al. 2014). In such conditions, there seems to be a higher conversion of P added via fertilization to organic forms, corroborating the results obtained by Tiecher et al. (2012a,b) for a 23-year-old no-tillage Latosol cultivated with different crop rotations in southern Paraná, Brazil.
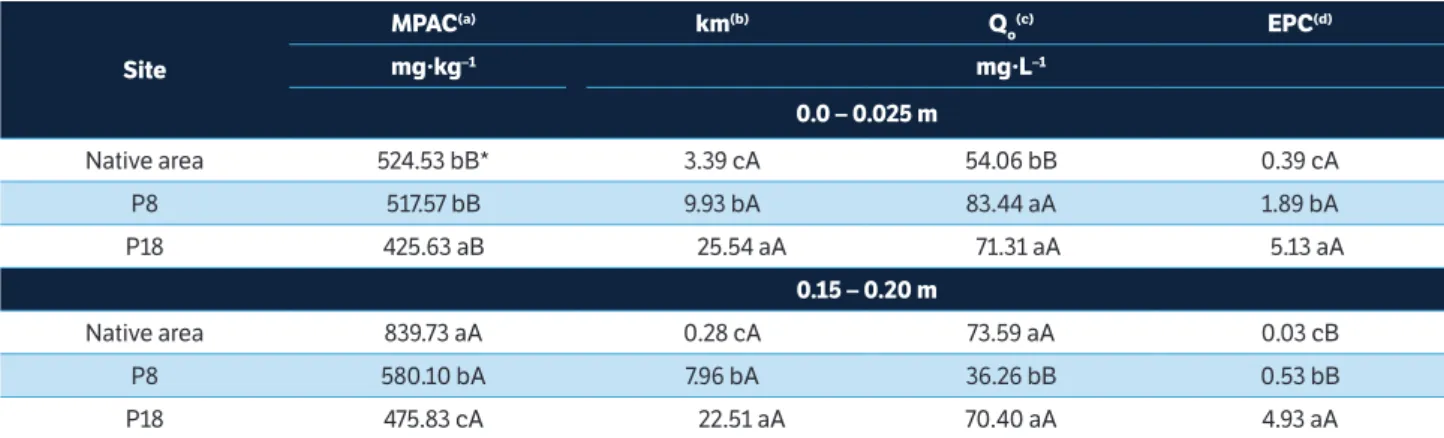
Parameters for the phosphorus adsorption isotherms
The highest MPAC values were found in the 0.15 – 0.20 m layer in relation to the 0.0 – 0.025 m one for all soils (Table 5). The soil of the native area and the P8 showed higher MPAC values in the 0.0 – 0.025 m layer. In the 0.15 – 0.20 m depths, the highest MPAC levels were found in the native area, followed by P8 and P18. These higher values in the soil of the native area are likely to be due to a lower saturation of the soil sorption sites. The lowest MPAC values in the P18 soil can be explained by the long history (over 18 years of cultivation) of phosphate fertilizers application, which favored the occupation of the sorption sites by that element, especially those located in the soil inorganic reactive particles (Nwoke et al. 2003). P concentration in the solution that allows for half of the maximum P adsorption (km) was higher in the P18 soil (24.02 mg·L–1), followed by the P8
(8.95 mg·L–1),and the native area soil (1.83 mg·L–1).
These results show that, in the native area, the shape of the curve is indicative of higher adsorption, whereas, in the fertilized areas, the isotherm curve is not as accentuated. However, the highest concentrations of P desorbed in water (Qo) were found in the 0.0 – 0.025 m layer of the P8 and P18 soils and in the 0.15 – 0.20 m layer of the native soil (Table 5).
Regarding the equilibrium phosphorus concentration (EPC) parameter, the highest values were found in the 0.0 – 0.025 m layer in relation to the 0.15 – 0.20 m one
Site
MPAC(a) km(b) Q
o
(c) EPC(d)
mg·kg–1 mg·L–1
0.0 – 0.025 m
Native area 524.53 bB* 3.39 cA 54.06 bB 0.39 cA
P8 517.57 bB 9.93 bA 83.44 aA 1.89 bA
P18 425.63 aB 25.54 aA 71.31 aA 5.13 aA
0.15 – 0.20 m
Native area 839.73 aA 0.28 cA 73.59 aA 0.03 cB
P8 580.10 bA 7.96 bA 36.26 bB 0.53 bB
P18 475.83 cA 22.51 aA 70.40 aA 4.93 aA
Table 5. Parameters related to the adsorption isotherms adjusted by Koski-Vähälä and Hartikainen equation in the 0.0 – 0.025 and 0.15 – 0.20 m depths of Humic Cambisol soils from a native area as well as from an 8-year-old (P8) and 18-year-old apple orchards (P18) grown in the plateau region of Santa Catarina, Brazil.
(a) Maximum phosphate adsorption capacity; (b) Equilibrium P concentration in the solution that allows for half the maximum P adsorption; (c)Amount of P desorbed
in water; (d)Equilibrium P concentration;*Means followed by the same lower case letter in the column and in the same depth and upper case letters in the same
in the soils of the native and P8 areas. This was expected, once the highest concentrations of available P, PiRTA,
and Pibic were found in the topsoil, particularly in the
P8 and P18 (Table 1). The highest EPC values were observed in the P18, followed by the P8 soil (Table 5). EPC is a key theoretical parameter in the study of potential soil contamination, because it indicates that, in the case of erosion of a P-rich soil (sediment) carried to a water body, the potential release of this element to the water will occur every time that the concentration of P soluble in the water body is lower than the EPC. Thus, regarding the highest EPC values, the km,and MPAC, the P18 orchard soil presented higher potential risk for P contamination in water bodies, mainly from surface runoffs.
CONCLUSION
Successive applications of phosphate fertilizers in apple orchards in the highland regions of Santa Catarina state increase P concentrations in all forms assessed by the Hedley fractionation method. Such increase is higher in older orchards and more pronounced in the soil upper layers.
Distribution of P in organic and inorganic forms in the soils planted with apple trees was similar to the distribution of P observed in the soil with native vegetation, indicating that the accumulation of phosphate via fertilizer occurs proportionally in the P forms previously present in the soil.
The combined assessment of P chemical fractionation with parameters of P adsorption isotherms in the soil indicates that the indiscriminate application of phosphate fertilizers onto the soils of apple orchards in the highland regions of Santa Catarina state is transforming such areas into critical environments, posing a great risk of phosphate contamination to water bodies due to surface runoffs.
ACKNOWLEDGEMENTS
The authors would like to thank the National Council for Scientific and Technological Development (CNPq) for the research productivity scholarships to GB, LCG, and JJC. They also would like to thank the Coordination for the Improvement of Higher Education Personnel (CAPES) for Master’s scholarships to ES and Doctorate scholarships to VGA and RRC.
Bai, Z., Li, H., Yang, X., Zhou, B., Shi, X., Wang, B., Li, D., Shen, J.,
Chen, Q., Qin, W., Oenema, O. and Zhang, F. (2013). The critical
soil P levels for crop yield, soil fertility and environmental safety in
different soil types. Plant Soil, 372, 27-37. http://dx.doi.org/10.1007/ s11104-013-1696-y.
Brunetto, G., Lorensini, F., Ceretta, C. A., Gatiboni, L. C., Trentin, G.,
Girotto, E., Miotto, A., Lourenzi, C. R. and Melo, G. W. B. (2013).
Soil phosphorus fractions in a sandy typic hapludaft as affected
by phosphorus fertilization and grapevine cultivation period.
Community Soil Science Plant Analysis, 44, 1937-1950. http:// dx.doi.org/10.1080/00103624.2013.794819.
Brunetto, G., Ventura, M., Scandellari, F., Ceretta, C. A., Kaminski, J.,
Melo, G. W. B. and Tagliavini, M. (2011). Nutrients release during
the decomposition of mowed perennial ryegrass and white clover
and its contribution to nitrogen nutrition of grapevine. Nutrient
Cycling in Agroecosystems, 90, 299-308. http://dx.doi.org/10.1007/ s10705-011-9430-8.
REFERENCES
Ciampitti, I. A., Picone, L. I., Rubio, G. and García, F. O. (2011).
Pathways of phosphorus fraction dynamics in field crop rotations of
the pampas of Argentina. Soil Science Society of America Journal,
75, 918-926. http://dx.doi.org/10.2136/sssaj2010.0361.
Comissão de Química e Fertilidade do Solo - RS/SC (2004) Manual
de adubação e de calagem para os Estados do Rio Grande do Sul
e Santa Catarina. Porto Alegre: SBCS/NRS.
Condron, L. M. and Goh, K. M. (1989). Effects of long-term phosphatic
fertilizer applications on amounts and forms of phosphorus in soils
under irrigated pasture in New Zealand. Journal of Soil Science,
40, 383-395. http://dx.doi.org/10.1111/j.1365-2389.1989.tb01282.x.
Couto, R. R., Santos, M. A., Comin, J. J., Martini, L. C. P., Gatiboni, L. C.,
Martins, S. R., Belli Filho, P. and Brunetto, G. (2014). Environmental
vulnerability and phosphorus fractions of areas with pig slurry
applied to the soil. Journal of Environmental Quality, 44, 162-73.
Cross, A. F. and Schlesinger, W. H. (1995). A literature review
and evaluation of the Hedley fractionation: aplications to
the biogeochemical cycle of soil phosphorus in natural
e c o s y s t e m s . G e o d e r m a , 6 4 , 1 9 7-214 . h t t p : / /d x .d o i . org/10.1016/0016-7061(94)00023-4.
Dick, W. A. and Tabatabai, M. (1977). A determination of
orthophosphate in aqueous solutions containing labile organic and
inorganic phosphorus compounds. Journal of Environmental Quality,
6, 82-85. http://dx.doi.org/10.2134/jeq1977.00472425000600010018x.
Empresa Brasileira de Pesquisa Agropecuária (1997). Manual de
métodos de análise de solo. Rio de Janeiro: Centro Nacional de
Pesquisas de Solo.
Empresa Brasileira de Pesquisa Agropecuária (2013). Sistema
Brasileiro de Classificação de Solos. Rio de Janeiro: Centro Nacional
de Pesquisas de Solo.
Gatiboni, L. C., Brunetto, G., Rheinheimer, D. S. and Kaminski, J.
(2013) Fracionamento químico das formas de fósforo do solo:
usos e limitações. In A. P. Araújo and B. J. R. Alves (Eds.), Tópicos
em ciência do solo (p. 141-187). Viçosa: Sociedade Brasileira de
Ciência do Solo.
Gatiboni, L. C., Smyth, T. J., Schmitt, D. E., Cassol, P. C. and Oliveira,
C. M. B. (2014). Proposta de limites críticos ambientais de fósforo
para solos de Santa Catarina. Lages: UDESC-CAV. Boletim técnico, 2.
Gonçalves, G. K. and Meurer, E. J. (2009). Phosphorus fractions
and their relationship with phosphorus uptake by flooded rice
in Rio Grande do Sul. Revista Brasileira de Ciência do Solo, 33,
357-362. http://dx.doi.org/10.1590/S0100-06832009000200013.
Goulart Junior, R. (2015). Maçã. In Epagri. Síntese anual da agricultura
de Santa Catarina. Florianópolis: Epagri.
Hedley, M. J., Stewart, J. W. B. and Chauhan, B. S. (1982). Changes
in inorganic and organic soil phosphorus fractions induced by
cultivation practices and by laboratory incubations. Soil Science
Society of America Journal, 46, 970-976. http://dx.doi.org/10.2136/ sssaj1982.03615995004600050017x.
Kaminski, J., Gatiboni, L. C., Rheinheimer, D. S., Martins, J. R.,
Santos, E. J. S., Tissot, C. A. (2002). Estimativa da acidez potencial
em solos e sua implicação no cálculo da necessidade de calcário.
Revista Brasileira de Ciência do Solo, 26, 1107-1113.
Koski-Vähälä, J. and Hartikainen, H. (2001). Assessment of the risk
of phosphorus loading due to resuspended sediment. Journal of
Environmental Quality, 30, 960-966.
Linquist, B. A., Ruark, M. D. and Hill, J. E. (2011). Soil order and
management practices control soil phosphorus fractions in managed
wetland ecosystems. Nutrient Cycling in Agroecosystems, 90, 51-62.
http://dx.doi.org/10.1007/s10705-010-9411-3.
Murphy, J. and Riley, J. P. (1962). A modified single solution method for
the determination of phosphate in natural waters. Analytica Chimica
Acta,27, 31-36. http://dx.doi.org/10.1016/S0003-2670(00)88444-5.
Nachtigall, G. R., Basso, C. and Freire, C. J. S. (2004). Nutrição e
adubação de pomares. In G. R. Nachtigall (Ed.), Maçã: produção.
Brasília: Embrapa Informação Tecnológica.
Nava, G. (2012). Aspectos nutricionais e manejo da adubação da
macieira no Sul do Brasil. Agropecuária Catarinense, 25, 103-109.
Nava, G., Basso, C., Nuemberg, N., Melo, G. W. B, Nachtigall, G. R.
and Suzuki, A. (2002). Fertilidade do solo e nutrição na produção
integrada de maçã. Bento Gonçalves: Embrapa. Circular Técnica 33.
Nwoke, O. C., Vanlauwe, B., Diels, J., Sanginga, N., Osonubi, O., Merckx, R.
(2003). Assessment of labile phosphorus fractions and adsorption
characteristics in relation to soil properties of West African savanna
soils. Agriculture Ecosystems and Environment, 100, 285-294. http:// dx.doi.org/10.1016/S0167-8809(03)00186-5.
Oliveira, C. M. B., Gatiboni, L. C., Miquelluti, D. J., Smyth, T. J. and Almeida,
J. A. (2014). Capacidade máxima de adsorção de fósforo e constante
de energia de ligação em Latossolo Bruno em razão de diferentes
ajustes do modelo de langmuir. Revista Brasileira de Ciência do Solo,
38, 1805-1815. http://dx.doi.org/10.1590/S0100-06832014000600015.
Rheinheimer, D. S. and Anghinoni, I. (2001). Distribuição do
fósforo inorgânico em sistemas de manejo de solo. Pesquisa
Agropecuária Brasileira, 36, 151-160. http://dx.doi.org/10.1590/ S0100-204X2001000100019.
Rheinheimer, D. S., Gatiboni, L. C. and Kaminski, J. (2008). Fatores
que afetam a disponibilidade do fósforo e o manejo da adubação
fosfatada em solos sob sistema plantio direto. Ciência Rural, 38, 576-586.
Schen, J., Yuan, L., Zhang, J., Li, H., Bai, Z., Chen, X., Zhang, W. and
Zhang, F. (2011). Phosphorus dynamics: from soil to plant. Plant
Phisiology, 156, 997-1005. http://dx.doi.org/10. 1104/ pp. 111. 175232.
Schmitt, D. E., Comin, J. J., Ceretta, C. A., Gatiboni, L. C., Tiecher, T.,
Lorensini, F., Heinzein, J., Ambrosini, V. G., Moraes, M. P. and Brunetto, G.
(2013a). Accumulation of phosphorus fractions and contamination
potential in vineyard soils in the southern region of the state of Santa
Catarina, Brazil. Revista Brasileira de Ciência do Solo, 37, 1256-1266.
Schmitt, D. E., Comin, J. J., Gatiboni, L. C., Tiecher, T., Lorensini, F.,
Melo, G. W. B., Girotto, E., Guardini, R., Heinzein, J. and Brunetto, G.
(2013b). Phosphorus fractions in sandy soils of vineyards in southern
Brazil. Revista Brasileira de Ciência do Solo, 37, 472-481. http://dx.doi. org/10.1590/S0100-06832013000200018.
Schmitt, D. E., Gatiboni, L. C., Girotto, E., Lorensini, F., Melo, G. W. B.
and Brunetto, G. (2014). Phosphorus fractions in the vineyard soil of
the Serra Gaúcha of Rio Grande do Sul, Brazil. Revista Brasileira de
Engenharia Agrícola e Ambiental, 18, 134-140. http://dx.doi.org/10.1590/ S1415-43662014000200002.
Sharpley, A. (2011). Phosphorus availability. In P. M. Huang, Y. Li and
M. E. Sumner (Eds.), Resource management and environmental
impacts. 2. ed. (p. 11.4-11.37). Boca Raton: CRC Press.
Tedesco, M. J., Gianello, C., Bissani, C. A., Bohnen, H. and Volkweiss, S. J.
(1995). Análises de solo, plantas e outros materiais. 2. ed. rev. e amp.
Porto Alegre: UFRGS. Boletim técnico, 5.
Tiecher, T., Rheinheimer, D. S. and Calegari, A. (2012a). Soil
organic phosphorus forms under different soil management
systems and winter crops, in a long term experiment. Soil
and Tillage Research, 124, 57-67. http://dx.doi.org/10.1016/j. still.2012.05.001.
Tiecher, T., Rheinheimer, D. S., Kaminski, J. and Calegari, A.
(2012b). Forms of inorganic phosphorus in soil under different
long term soil tillage systems and winter crops. Revista Brasileira