Benchmarking analogue models of brittle thrust wedges
Guido Schreurs
a,*, Susanne J.H. Buiter
b,c, Jennifer Boutelier
d, Caroline Burberry
e,1,
Jean-Paul Callot
f,2, Cristian Cavozzi
g, Mariano Cerca
h, Jian-Hong Chen
i,
Ernesto Cristallini
j, Alexander R. Cruden
k,3, Leonardo Cruz
l, Jean-Marc Daniel
f,9,
Gabriela Da Poian
j,4, Victor H. Garcia
j,4, Caroline J.S. Gomes
m, C
eline Grall
f,5,
Yannick Guillot
n, Cecilia Guzm
an
j, Triyani Nur Hidayah
o, George Hilley
p,
Matthias Klinkmüller
a, Hemin A. Koyi
e, Chia-Yu Lu
q, Bertrand Maillot
r,
Catherine Meriaux
s,6, Faramarz Nilfouroushan
e,7, Chang-Chih Pan
i, Daniel Pillot
f,
Rodrigo Portillo
h, Matthias Rosenau
t, Wouter P. Schellart
s, Roy W. Schlische
o,
Andy Take
u, Bruno Vendeville
v, Marine Vergnaud
f, Matteo Vettori
g,8,
Shih-Hsien Wang
i, Martha O. Withjack
o, Daniel Yagupsky
j, Yasuhiro Yamada
waInstitute of Geological Sciences, University of Bern, Baltzerstrasse 1&3, CH 3012, Bern, Switzerland bGeodynamics Team, Geological Survey of Norway, 7491, Trondheim, Norway
cThe Centre for Earth Evolution and Dynamics, University of Oslo, PO Box 1048, Blindern, 0316, Oslo, Norway dDepartment of Geology, University of Toronto, 22 Russell St., M5S 3B1, Toronto, Ontario, Canada
eHans Ramberg Tectonic Laboratory, Department of Earth Sciences, Uppsala University, Villav€agen, S-75326, Uppsala, Sweden f
IFP Energies Nouvelles, 1 et 4 avenue de Bois Preau, F-92500, Rueil Malmaison, Cedex, France
gNEXT
eNatural and Experimental Tectonics Research Group, Department of Physics and Earth Sciences“Macedonio Melloni”, University of Parma, Via G.
Usberti 157/A, I-43100, Parma, Italy
hUniversidad Nacional Autonoma de Mexico, Centro de Geociencias, Blvd Juriquilla 3001, Juriquilla, Queretaro, 76230, Mexico iDepartment of Geosciences, National Taiwan University, 1 Roosevelt Road Section 4, Taipei, 106, Taiwan
jDepartamento de Ciencias Geologicas, Universidad de Buenos Aires, Pabellon II, Ciudad Universitaria, C1428EHA, Buenos Aires, Argentina kDepartment of Geology, University of Toronto, 22 Russell St., Toronto, Ontario, M5S 3B1, Canada
l
Department of Geological and Environmental Sciences, Stanford University, Braun Hall 215, Stanford, CA, 94305-2115, USA
mDepartamento de Geologia, Universidade Federal de Ouro Preto, Morro do Cruzeiro s/n, 35, 400-000, Ouro Preto, Minas Gerais, Brazil nUniversite Lille-Nord de France, Laboratoire Geosystemes, FRE CNRS 3298, 59655, Villeneuve d
’Ascq, Cedex, France
oDepartment of Earth and Planetary Sciences, Rutgers University, 610 Taylor Road, Piscataway, NJ, 08854-8066, USA pDepartment of Geological and Environmental Sciences, Braun Hall 233, Stanford University, Stanford, CA, 94305-2115, USA qDepartment of Geosciences, National Taiwan University, 1 Roosevelt Road, Taipei, 106, Taiwan
r
Laboratoire Geosciences et Environnement Cergy, Universite de Cergy-Pontoise, 5 Mail Gay-Lussac, Neuville-sur-Oise, 95031, Cergy-Pontoise, Cedex, France
sSchool of Earth, Atmosphere and Environment, Monash University, Melbourne, Victoria, 3800, Australia
tHelmholtz-Centre Potsdam, GFZ German Research Centre for Geosciences, Telegrafenberg, D-14473, Potsdam, Germany uDepartment of Civil Engineering, Queen's University, Kingston, Ontario, K7L 3N6, Canada
vUniversite Lille, UMR 8187, LOG, Laboratoire d’Oceanologie et de Geosciences, F 59000, Lille, France wDepartment of Civil and Earth Resources Engineering, Kyoto University, Kyoto, 615-8540, Japan
*Corresponding author.
E-mail address:[email protected](G. Schreurs).
1 Now at: Department of Earth and Atmospheric Sciences, University of Nebraska-Lincoln, 214 Bessey Hall, PO Box 880340, Lincoln, NE, 68588-0340, USA. 2 Now at: Universite de Pau et des Pays de l’Adour, UMR5150 Laboratoire des Fluides Complexes et leurs Reservoirs, BP 1155, 64012, Pau Cedex, France. 3 Now at: School of Earth, Atmosphere and Environment, Monash University, Melbourne, Victoria 3800, Australia.
4 Now at: Instituto de Investigacion en Paleobiología y Geología, Universidad Nacional de Río Negro, Isidro Lobo 516 (8332) General Roca, Río Negro, Argentina. 5 Now at: Lamont-Doherty Earth Observatory, Columbia University, Marine Geology and Geophysics, Palisades, NY, 10964, USA.
6 Now at: Departamento de Engenharia Geografie, Geofisica e Energia, Universidade de Lisboa, Campo Grande, 1749-016, Lisboa, Portugal. 7 Now at: Department of Industrial Development, IT and Land Management, University of G€avle, Sweden.
8 Now at: CTO Area CAE Structural Analysis and Composite Design e-FEM srl, Parma, Italy.
9 Now at: Ifremer, Department of Physical Resources and Deep-Sea Ecosystems (PDG-REM), Centre Bretagne, ZI de la Pointe du Diable, CS 10070, 29280 Plouzane, France. Contents lists available atScienceDirect
Journal of Structural Geology
j o u r n a l h o m e p a g e : w w w . e l s e v i e r . c o m / l o c a t e / j s g
a r t i c l e
i n f o
Article history:
Received 17 July 2015 Received in revised form 8 March 2016
Accepted 9 March 2016 Available online 15 March 2016
Keywords:
Thrust wedges Brittle wedges Shear zones Analogue modeling Benchmarking Critical taper Sand Friction Cohesion
a b s t r a c t
We performed a quantitative comparison of brittle thrust wedge experiments to evaluate the variability among analogue models and to appraise the reproducibility and limits of model interpretation. Fifteen analogue modeling laboratories participated in this benchmark initiative. Each laboratory received a shipment of the same type of quartz and corundum sand and all laboratories adhered to a stringent model building protocol and used the same type of foil to cover base and sidewalls of the sandbox. Sieve structure, sifting height, filling rate, and details on off-scraping of excess sand followed prescribed procedures.
Our analogue benchmark shows that even for simple plane-strain experiments with prescribed stringent model construction techniques, quantitative model results show variability, most notably for surface slope, thrust spacing and number of forward and backthrusts. One of the sources of the variability in model results is related to slight variations in how sand is deposited in the sandbox. Small changes in sifting height, sifting rate, and scraping will result in slightly heterogeneous material bulk densities, which will affect the mechanical properties of the sand, and will result in lateral and vertical differences in peak and boundary friction angles, as well as cohesion values once the model is constructed. Initial variations in basal friction are inferred to play the most important role in causing model variability.
Our comparison shows that the human factor plays a decisive role, and even when one modeler re-peats the same experiment, quantitative model results still show variability. Our observations highlight the limits of up-scaling quantitative analogue model results to nature or for making comparisons with numerical models. The frictional behavior of sand is highly sensitive to small variations in material state or experimental set-up, and hence, it will remain difficult to scale quantitative results such as number of thrusts, thrust spacing, and pop-up width from model to nature.
©2016 Elsevier Ltd. All rights reserved.
1. Introduction
Scaled analogue experiments have a long history of modeling geological processes. Analogue models built of materials such as sand, silicone or clay have helped geoscientists to gain insights into the kinematic and dynamic evolution of a wide variety of geological structures. However, as for all models, their results reflect the initial boundary conditions, the choice of materials, the modeling appa-ratus and the technique of building the model. Unfortunately, many publications on analogue modeling do not adequately record experimental details and material properties, making a detailed comparison of model results among different laboratories simu-lating similar geological processes difficult. Additionally, experi-ments are rarely re-run to test the reproducibility and to determine the intrinsic variability of model results.
Schreurs et al. (2006)were thefirst to report a direct compar-ison of scaled analogue experiments to test the reproducibility of model results amongst ten analogue modeling laboratories. One of
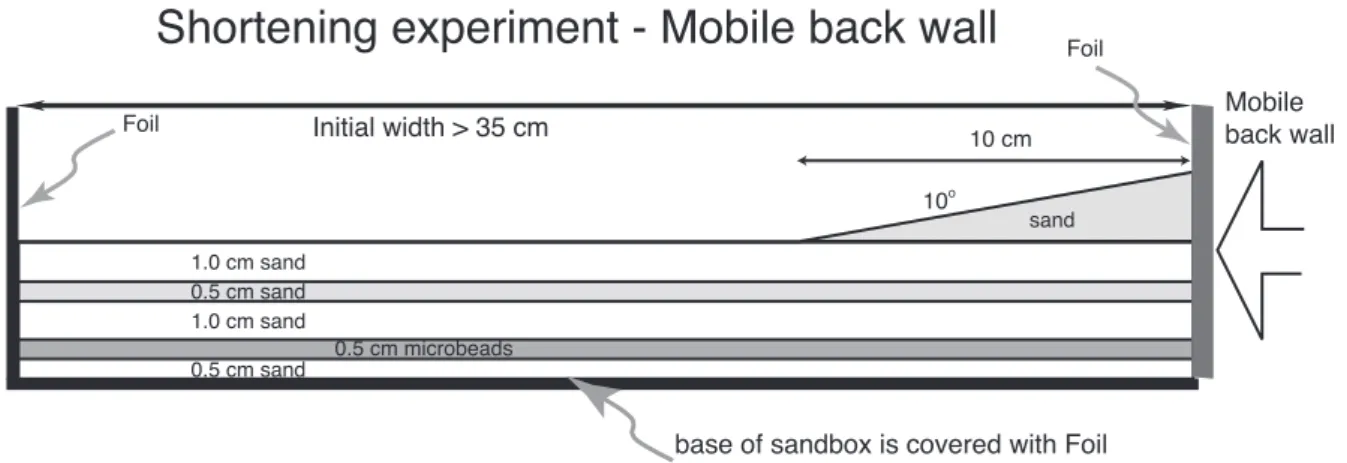
the two experimental set-ups chosen in their comparison was a brittle thrust wedge experiment (Fig. 1). The experimental set-up, the model-building technique, and the material covering walls and base were all prescribed. However, each laboratory used its own granular material to simulate brittle deformation. Conse-quently, in the comparison ofSchreurs et al. (2006)the material properties can be considered as extrinsic and were a major source of model variability.
The qualitative evolution of all models was broadly similar (Fig. 2) with the development of a thrust wedge characterized by in-sequence forward thrusting and by minor back thrusting. However, significant quantitative variations existed between models in parameters such as the spacing between thrusts, their dip angles, number of forward and back thrusts and surface slopes. In the analogue modeling comparison bySchreurs et al. (2006), each laboratory used its own granular material and differences existed in terms of material properties such as grain size, grain shape and grain size distribution. Hence, we suspect that the
Fig. 1.Experimental set-up used in model comparison experiments bySchreurs et al. (2006). Model consists of a 3.5 cm-thick sand layer with an embedded microbeads layer and an overlying sand wedge with a surface slope of 10adjacent to the mobile wall. All walls are covered by Alkor foil. Figure reproduced fromSchreurs et al. (2006)with permission
resulting inherent variations in material properties between the different labs may have been responsible for differences in the evolution of the experimental models.Lohrmann et al. (2003), for example, determined that the kinematics of thrust wedges is largely a function of their material properties. Differences in the observation techniques used to monitor the evolution of structures also contributed to model variability. Some research groups observed structures through transparent sidewalls, where sidewall friction is highest, whereas other labs used X-ray CT (XRCT) tech-niques to observe model evolution at the center of the model, where the effects of sidewall frictional stresses are less.
The outcome of the analogue comparison study by Schreurs et al. (2006) motivated us to propose new comparison experi-ments, with the aim to better understand the variability between models by discriminating extrinsic versus intrinsic variability. The main differences with the previous analogue model comparison are that in the present study we not only prescribe stringent model-building techniques, but all participating laboratories use exactly the same type of analogue materials for their experiments. By harmonizing boundary conditions and material properties we isolate intrinsic variability related to sources such as inherent randomness or other less obvious conditioning parameters (e.g., air humidity).
We also decided to choose simple experimental designs using brittle frictional materials only to minimize structural complexity and to better assess structural variability. Our new experiments are thrust wedge experiments that have frequently been performed in the analog modeling community. We choose three different ex-periments, referred to as experiment 1, 2 and 3, respectively. In each of these experiments deformation is imposed by displacement of one mobile, vertical wall. For practical reasons the maximum shortening is limited to 10 cm. This allowed sand box dimensions to be smaller than for larger amounts of shortening, and thereby
allowed more labs to participate. Fifteen analogue modeling labo-ratories joined in this comparison conducting the experiments in their local laboratory environment. In order to isolate the personal impact on experiments, two researchers ran models using the experimental apparatus from the laboratory in Bern. These models are referred to as“Bern”and“GFZ@Bern”, respectively.
In a companion paper,Buiter et al. (2016)present the results of a comparison of up to 11 numerical codes, simulating the same experimental set-ups, with the numerical material properties following the analogue material properties as closely as possible. Major sources of variability here are differences in the imple-mentation of boundary conditions and subtle differences between numerical solvers.
2. Modeling approach
2.1. Material properties
Each laboratory received a shipment of the quartz and corundum sand that is routinely used at the analogue modeling laboratory of the Institute of Geological Sciences at the University of Bern. Laboratories were asked to store the sands in a dry place for at least one month before conducting experiments and to record room temperature and humidity during experimental runs.
2.1.1. Physical characteristics
The physical characteristics of the sands are summarized in
125
m
m. Bulk density depends both on the material and on the physical handling technique, i.e. whether material is sieved or poured. As shown previously byKrantz (1991), Schellart (2000), Lohrmann et al. (2003), Panien et al. (2006), Gomes (2013)andMaillot (2013) the bulk density of sieved granular materials is higher than the bulk density of poured granular materials. In our experiments, the sands are sieved from a height of 20 cm using prescribed sieve (Appendix A) and sieving rates. The bulk densities of quartz and corundum sand sieved from 20 cm height are 1.6 g/ cm3and 1.9 g/cm3, respectively.
2.1.2. Friction angles and cohesion
The mechanical properties of the sands have been determined with a ring-shear tester, model RST-01.pc (Schulze, 2008), at the GFZ in Potsdam. The sands were stored for one month prior to testing to adapt to the air-conditioned environment. Sand storage and ring-shear testing occurred at temperatures of 23±1C and atmospheric humidity of 45±5%. The ring-shear tester allows the determination of the internal and boundary friction angles of granular materials at low normal stresses similar to those observed
in analog model experiments (<20 kPa). The ring-shear tester consists of an annular shear cell holding the tested material, a normal loaded shear lid placed onto the cell, and tie rods measuring the shear stress. Using a ring-shear tester,Lohrmann et al. (2003)
could show that granular materials such as quartz sand do not have constant frictional properties. Upon loading the granular materials undergo initially a limited elastic deformation, which is followed by strain hardening preceding failure at peak strength and subsequent strain softening until a stable strength value is reached (Fig. 4). The strain localisation at peak strength is associated with a material compactionedecompaction cycle as inferred from volu-metric changes, with maximum dilation rates close to peak strength when faults form (Lohrmann et al., 2003).
The ring-shear tests for measuring internal friction and boundary friction differ in the design of the shear cell and lid. The setup for measuring internal friction ensures that shear displace-ment occurs entirely within the sand such that only intergranular deformation occurs, whereas the setup for measuring boundary friction ensures that deformation occurs between sand and a sur-face with controlled roughness, in our case a transparent and super polished self-adhesive foil (brand Alkor-Venilia, article nr. 120010; this foil has been renamed, and is now available as Gekkofix article nr. 11325 from Van Merksteijn Plastics B.V. in the Netherlands,
www.gekkofix.nl).
The physical handling technique used tofill the annular cell of the ring-shear tester was identical to the one used to determine the bulk density and to the one prescribed in our thrust wedge ex-periments, i.e. material was sifted through a prescribed mesh sieve from c. 20 cm height into the shear cell at afilling rate of c. 250 ml/ min. Excess material was subsequently scraped off before assem-bling shear cell and shear lid.
Ring-shear measurements were performed at a shear velocity of 3 mm/min for 4 min at a given normal load. For each test, mea-surements were done for different normal stresses ranging from c. 500 Pa to c. 2240 Pa in steps of c. 435 Pa, and for each particular
Fig. 3.Physical characteristics of the quartz and corundum sand used in the experi-ments (modified afterPanien et al., 2006). Upper and lowermost images are photo-graphs and SEM images, respectively. Width of each SEM image is 1740mm.
normal stress, peak strength and stable strength values were determined. Each ring-shear test was repeated three times for both quartz sand and corundum sand.
Measured shear stress values at peak strength and at stable strength are plotted against the applied normal stresses and a linear regression analysis is applied to the data, to obtain the fric-tion coefficient,
m
, which corresponds to the slope of the line and the friction angle,f
, which is tan 1m
. The cohesion is the linearly extrapolated value at zero normal stress. We report the range of friction angles and (apparent) cohesion values inTable 1.The angle of internal friction at peak strength (
f
p) of the tested quartz and corundum sand are about 35e36. The angles of internal friction at stable strength (f
s) are in both cases lower, with values around 30e31. The angle of boundary friction (f
b) varies more for quartz sand on Alkor foil, with values between 15and 21, than for corundum sand on Alkor foil with values of 24±1. At the range of applied normal stresses the cohesion at peak strength (Cp) for both granular materials is in the order of a few tens of Pa. Boundary cohesion values (Cb) range from 14 to 141 Pa for quartz sand and from 23 to 44 Pa for corundum sand. The large spread in cohesion values is due to the linear extrapolation to zero normal stress on shear stress versus normal stress curves. Strain softening corre-sponds to the weakening of the shear zone after its formation. By comparing the mean values of the peak internal friction coefficient and the stable friction coefficient for each granular material, the mean strain softening can be determined, which amounts to c. 15e20% for both quartz and corundum sand.Panien et al. (2006)used the same ring-shear tester at identical laboratory climatic conditions to determine the material properties of the same quartz and corundum sand as used in this model comparison. Their filling procedure (filling height and rate) is identical to ours, albeit with a slightly different sieve. The obtained values for repeated measurements correspond closely to ours. Their mean values for
f
pof quartz and corundum sand are 36and 37, respectively and their mean values forf
sare 31and 32, respec-tively. Using the same Alkor foil,Panien et al. (2006)also found that boundary friction angles at peak strength and at stable strength are lower for quartz sand than for corundum sand.2.1.3. Dilation and elasticity
Deformation of the granular materials used in our experiments occurs by localization along shear zones in combination with dilation. The dilation angles at peak strength for our dry quartz and corundum sand are difficult to determine with a ring-shear tester. It requires measurements of the changes in volumetric strain, but the volumetric strain depends on the width of the initial shear zone that forms. Assuming an initial shear zone width of about 10 times the average grain size (Panien et al., 2006), we obtain very small dilation angles of less than 2. Measurements of shear zone for-mation in dry sands indicate that dilation approaches zero once the shear zone has formed (Lohrmann et al., 2003; Bernard et al., 2007). The elastic behaviour of the granular materials is characterized by at least two elastic parameters, e.g. Young's modulus E and
Poisson's ratio
n
. Young's modulus is the ratio of uniaxial stress and strain: E¼s
/e, while Poisson's ratio is the negative ratio of trans-verse strain (ex) to longitudinal strain (ez) under conditions of uniaxial stress, i.e.n
¼ ex/ez. Another elastic parameter is the bulk modulus K defined by the ratio of mean stress over volumetric strain. K is related to E andn
and can be expressed as K ¼E/ (3(1 2n
)). Importantly, one has to differentiate between the elas-ticity of individual granular particles (which is in the order of tens of GPa for sand) and the elasticity of the bulk solid, i.e. the structure made by many grains in contact, which is generally much lower and the one relevant in our modelling approach.The bulk moduli (K) of dry quartz and corundum sand were measured performing loadingeunloading cycles (maximum load: 20 kPa) on sieved sand samples with a uniaxial confined compression tester at GFZ Potsdam. The values vary depending on the degree of compaction, which increases mainly during thefirst few loadingeunloading cycles. Linear regression analysis of the stressestrain curves (up to a strain of 0.00003) during loading of thefirst ten cycles suggests an effective bulk modulus of around 200 MPa for both sands under laboratory conditions. Assuming a Poisson's ratio,
n
, of about 0.25 results in a Young's modulus E of 300 MPa. Though orders of magnitude smaller than for single grains these values are so high that elastic deformation in the ex-periments is expected to be below the detection threshold of even sophisticated optical strain measurement systems (e.g. microns when applying subpixel-resolution particle image velocimetry,Adam et al., 2005). Stress is therefore expected to accumulate and relax without obvious deformation in sandbox experiments. This is in contrast to more elastic modelling approaches where proper scaling of elasticity from nature to the analogue model yields observable elastic effects (Rosenau et al., 2009).
2.2. Brittle thrust wedges
The formation of fold-and-thrust belts and accretionary wedges in compressional settings is comparable to the process of forming a wedge of snow in front of a moving bulldozer with a taper angle described by the critical taper theory (e.g.Davis et al., 1983; Dahlen et al., 1984; Zhao et al., 1986; seeBuiter, 2012for an extensive re-view of brittle compressional wedge models). The material being pushed will reach an equilibrium angle, the so-called critical taper angle, which is the sum of the surface slope angle (
a
) and the basal dip angle of the wedge (b
). The critical taper angle depends on the material properties within the wedge, the porefluid pressure and the strength of the decollement along the base of the wedge.Under the assumption that the material deforms according to the Coulomb failure criterion and that the base of the wedge is cohesionless (i.e., Cb ¼0), the critical taper theory permits the derivation of the critical taper angle for a dry sand wedge (pore fluid pressure is zero) knowing the angle of internal friction, the internal cohesion and the angle of basal friction (Fig. 5). Dahlen et al. (1984)show that a cohesionless wedge results in a perfectly triangular form, whereas a wedge with a constant internal cohesion
Table 1
Range of mechanical properties of quartz and corundum sand obtained with a ring-shear tester. Values are rounded to nearest degree for friction angles and to nearest whole number for cohesion. n is number of ring-shear tests at normal stresses ranging from c. 500e2240 Pa.
Mechanical parameter Quartz sand n¼3 Corundum sand n¼3
Angle of internal friction at peak strength (fp) 34e37 35e36
Cohesion at peak strength (Cp) in Pa 19e69 15e28
Angle of internal friction at stable strength (fs) 30e31
31
Angle of boundary friction (fb) 15e21
23
e25
Boundary cohesion (Cb) in Pa 14e141 23e44
will acquire a concave upward surface.
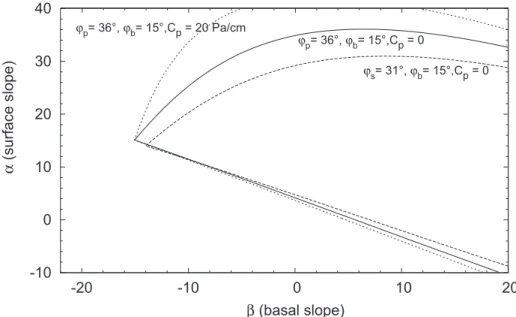
Fig. 5shows wedge stabilityfields for cohesionless and internal cohesive sands with frictional properties that closely correspond to those obtained from ring-shear tests on our sands: for a cohe-sionless sand at peak strength and at stable strength, and for a cohesive sand at peak strength with depth-dependent internal cohesion (Buiter et al., 2016).
Wedges in the stable field will slide stably without internal deformation as long as no new material is accreted. This is our experiment 1, which has an initial wedge shape with a horizontal base and a 20surface slope (Fig. 5). Unstable, subcritical wedges will deform internally upon compression towards the critical taper angle. Our experiment 2 and 3 models with initial horizontal layering start out as subcritical wedges (Fig. 5).
2.3. General model building procedure
Although each lab used its own experimental apparatus, all labs applied the same type of self-adhesive Alkor foil to cover the base and the four vertical walls of their experimental apparatus in order to guarantee identical shear stresses at the boundaries. In addition, each lab received a detailed document outlining the prescribed model-building techniques including details on mesh sieve struc-ture for model construction and leveling techniques (Appendix A). The model was built by sifting sand through a sieve with specified mesh sieve from a height of 20 cm at afilling rate of c. 250 ml/min. This procedure is identical to the one used tofill the test cell during ring-shear test measurements. The minimum width of the model (measured along the mobile wall) was prescribed at 20 cm. Model widths as well as laboratory temperature and relative humidity are shown inTable 2.
2.4. Model analysis
We analyse our models in a qualitative way by comparing cross-sectional views and top views and in a quantitative way by cross section measurements. As boundary stresses created significant drag of structures along the sidewalls, our visual comparison is done for sections away from the sidewalls. Consequently, for models analysed in a conventional way by physically cutting the
model, we only show cross sections through the final stage of deformation. However, for models analysed by X-ray computed tomography (XRCT) we show the cross-sectional evolution at suc-cessive increments of mobile wall displacement, hereafter termed shortening.
Our quantitative analysis consisted of measuring surface slope (Fig. 6a), thrust spacing between forward thrusts (Fig. 6b), dip angle of newly formed forward thrusts at base, mid and top (Fig. 6c), thrust initiation (i.e. at how much shortening a particular thrust forms) and number of thrusts at the end of the experiment. We define a thrust as formed when it shows a small, visible offset in cross section. As in the previous model comparison (Schreurs et al., 2006), two of us (Guido Schreurs and Susanne Buiter) performed the quantitative analysis by measuring the aforementioned pa-rameters in the same manner and averaging the obtained values. In general the differences between the two measurers were small, with average difference in slope values of 1e2 and maximum difference in dip values of 3. Also differences in measured distance values were generally small. In models analysed by XRCT all pa-rameters were measured using cross-sectional images taken at 0.5 cm increments of displacement for Experiment 1, and at 0.2 cm increments of displacement until 1 cm and subsequently at 0.5 cm increments until 10 cm shortening for Experiments 2 and 3.
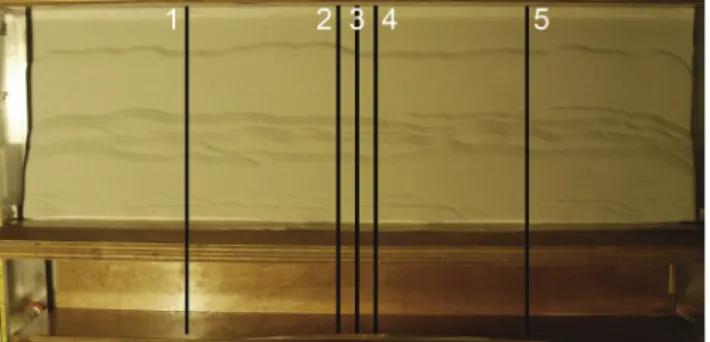
To document lateral variations of structures, we compared sections atfive different positions. As model width varied between laboratories, we defined thefive sections in terms of along-strike model width at 25%, 50%e2 cm, 50%, 50%þ2 cm, and 75% posi-tions (seeFig. 7).
3. Experiment 1
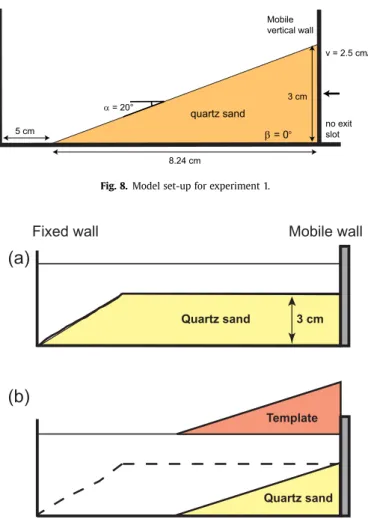
3.1. Experiment 1: model set-up
In the first experimental set-up, a quartz sand wedge with a horizontal base (
b
¼0) and a surface slope (a
) of c. 20was con-structed adjacent to the mobile wall (Fig. 8). The height of the wedge immediately adjacent to the mobile wall is 3 cm.Model building consisted of two steps (Fig. 9). In afirst step quartz sand was sieved in the sandbox partly sloping towards the fixed wall (Fig. 9a). In a second step a template with a 20 slope-Fig. 5.Zoom of critical taper curves for cohesionless sand at peak strength (fp¼36,f
b¼15and C¼0 Pa), cohesionless sand at stable strength (f
s¼31,f
b¼15and C¼0 Pa),
angle was attached onto each sidewall and excess material was scraped towards the tip of the wedge and taken out (Fig. 9b). Adjacent to thefixed wall, there was at least 5 cm space where no sand covered the base. The model was shortened 4 cm by inward movement of the mobile wall. Eleven analogue modeling labora-tories ran experiment 1 once.
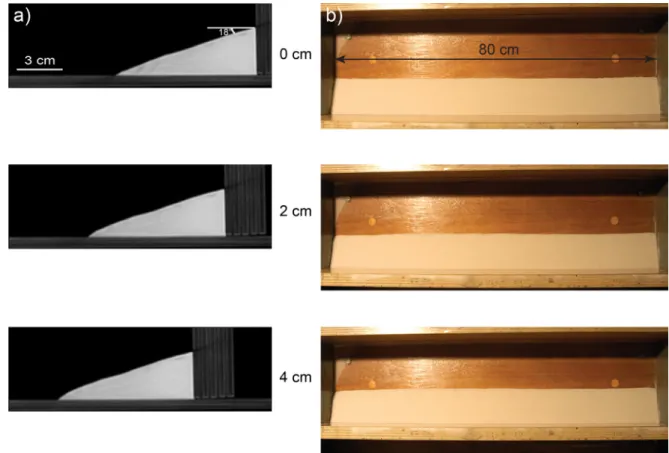
3.2. Experiment 1: results
Three intrinsic material parameters are important in the critical taper theory: the internal peak friction, internal cohesion, and basal friction. Of these three parameters, the basal friction of quartz sand is the least constrained, varying between 15 and 21 (Table 1). However, even when taking into account this uncertainty, the quartz sand wedge of experiment 1 is well within the stable domain. Hence, the wedge should slide stably without internal deformation and consequently the surface slope should remain constant throughout the experiment.
All experiment 1 models do conform to the critical taper theory and are stable. The quartz sand wedge is translated along the horizontal base and is not affected by internal localized deforma-tion. Apart from a slight slope change in the extreme front region of the wedge in a number of experiments, the overall surface slope remains constant (Figs. 10 and 11).
4. Experiment 2
4.1. Experiment 2: model set-up
In experiment 2 alternating horizontal layers of quartz and corundum sand are shortened by inward movement of a mobile wall (Fig. 12). Both the base and the surface of the model are hor-izontal (
a
¼b
¼0) and the“wedge”starts in the unstablefield (Fig. 5). The minimum length of the undeformed model, measured parallel to the movement direction of the mobile wall, was 35 cm.The model had an initial thickness of 3 cm and directly overlies the base of the model. Total shortening of the model by inward displacement of the mobile wall was 10 cm. No exit slot existed below the mobile vertical wall and the base of the model.
Fourteen laboratories participated in experiment 2, running a total of 25 models, of whichfive were analysed by XRCT.
4.2. Experiment 2: results
4.2.1. Evolution of models analysed by XRCT
Fig. 13shows the cross-sectional evolution through the centre of five thrust wedge models analysed by XRCT after 1, 2, 6 and 10 cm of shortening. Movies showing additional stages in the cross-sectional evolution are given in the journal's repository. Shortening is accommodated by forward thrusts, which propagate in-sequence towards the foreland, and by back thrusts.
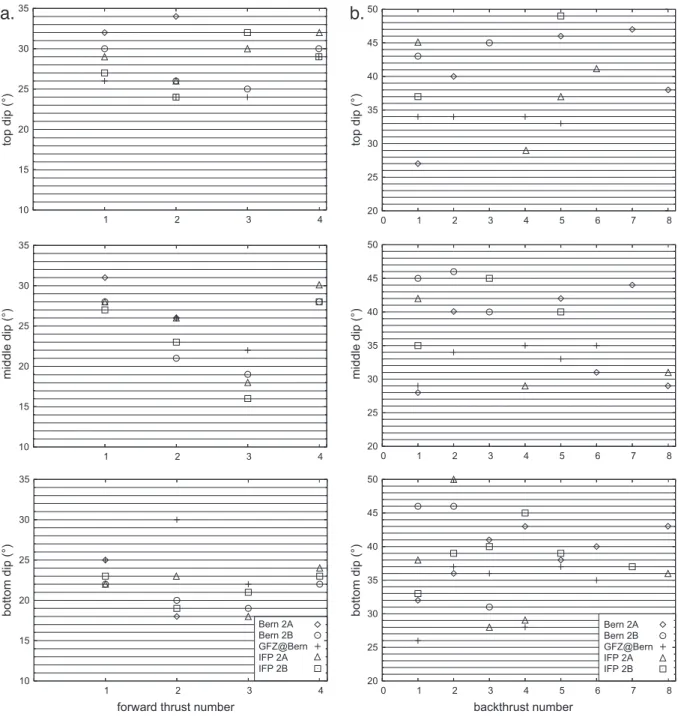
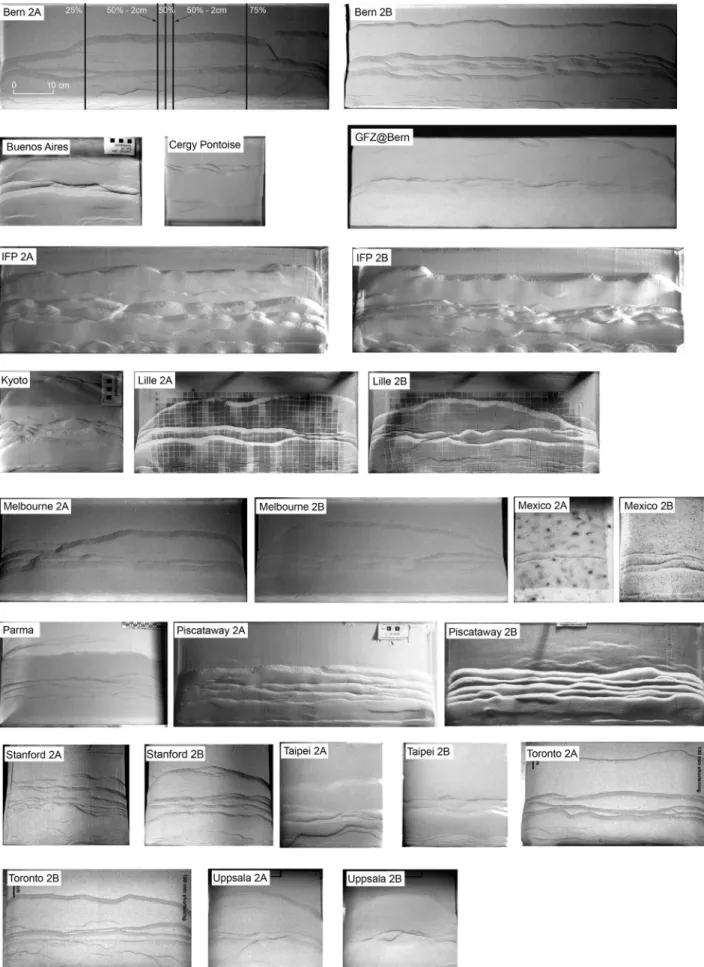
Thefirst pop-up structure develops between 0.5 and 1 cm of shortening (Fig. 14) adjacent to the mobile wall. The dip of thefirst forward thrust steepens slightly upwards, with dips varying be-tween 22 and 25 at the bottom, between 27 and 31 at the middle, and between 26 and 32at the top (Fig. 15a). The back thrust of thefirst pop-up structure generally dips steeper than the forward thrust, in particular near the base of the model. The vari-ation in dip of thefirst-formed back thrust is large, with dip angles between 26and 46at the bottom, and between 27and 45at the middle and at the top (Fig. 15b). The width of the pop-up at the surface varies because of the considerable variation in dip of the back thrust. Models with a steep back thrust (Bern 2B and IFP 2A) have a narrower pop-up width than models with a shallow-dipping back thrust (Fig. 13; 1 cm of shortening).
After 2 cm of shortening a second back thrust has formed in all models, except in model Bern 2A. Thefirst-formed forward thrust takes up most of the initial shortening and thefirst-formed back thrust is displaced along it (Fig. 13; 2 cm of shortening). A second in-sequence forward thrust forms between 3 and 5.5 cm of Table 2
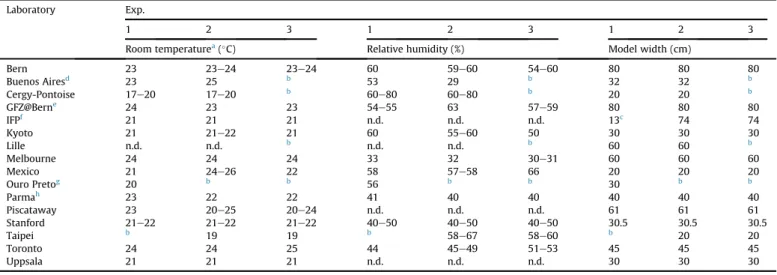
Overview of laboratory climatic conditions and model widths. Most laboratories performed experiments 2 and 3 twice, and range of values for room temperature and relative humidity are indicated. Exceptions to the prescribed modeling procedure are also given.
Laboratory Exp.
1 2 3 1 2 3 1 2 3
Room temperaturea(
C) Relative humidity (%) Model width (cm)
Bern 23 23e24 23e24 60 59e60 54e60 80 80 80
Buenos Airesd 23 25 b 53 29 b 32 32 b
Cergy-Pontoise 17e20 17e20 b 60e80 60e80 b 20 20 b
GFZ@Berne 24 23 23 54
e55 63 57e59 80 80 80
IFPf 21 21 21 n.d. n.d. n.d. 13c 74 74
Kyoto 21 21e22 21 60 55e60 50 30 30 30
Lille n.d. n.d. b n.d. n.d. b 60 60 b
Melbourne 24 24 24 33 32 30e31 60 60 60
Mexico 21 24e26 22 58 57e58 66 20 20 20
Ouro Pretog 20 b b 56 b b 30 b b
Parmah 23 22 22 41 40 40 40 40 40
Piscataway 23 20e25 20e24 n.d. n.d. n.d. 61 61 61
Stanford 21e22 21e22 21e22 40e50 40e50 40e50 30.5 30.5 30.5
Taipei b 19 19 b 58
e67 58e60 b 20 20
Toronto 24 24 25 44 45e49 51e53 45 45 45
Uppsala 21 21 21 n.d. n.d. n.d. 30 30 30
n.d.¼not determined. aRounded to nearest degree. bExperiment not done.
c Width less than prescribed minimum width of 20 cm. d Velocity of mobile wall was 4 cm/h.
eResearcher (MR) of Helmholtz Centre Potsdam (GFZ German Research Centre for Geosciences) performed experiments 1, 2 and 3 using experimental apparatus from Bern. f Transverse walls in experiment 3 consisted of rubber sheets.
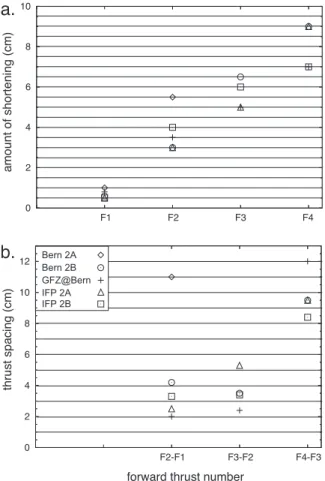
shortening and further in-sequence forward thrusts develop with progressive shortening. The spacing to the previously formed for-ward thrust at the moment of initiation of a new forfor-ward thrust tends to increase for subsequent thrusts (Fig. 14b). In general the dip of newly formed in-sequence thrusts near the base of the model becomes shallower with progressive deformation.
A second pop-up structure forms in all XRCT models, albeit at different stages: at 5.5 cm of shortening for Bern 2A, at 6.5 cm for GFZ@Bern, and at 9 cm for Bern 2B, IFP 2A and IFP 2B. Back thrusts associated with this second pop-up generally cross-cut earlier-formed, now inactive forward thrusts.
The surface slope evolution of the wedge for models analysed by XRCT is shown inFig. 16Oscillations in surface slope angles reflect the formation of new thrusts. All models except Bern 2A show these
oscillations. The Bern 2A model shows instead a steady increase in surface slope.
4.2.2. Final deformation stage
Cross sections through the centre of all experiment 2 models after 10 cm of shortening show a series of forward and back thrusts directly adjacent to the mobile wall (Fig. 17). In addition, most models show a second pop-up structure that formed in front. However, the models of Kyoto, Parma, Piscataway 2A and 2B, and Stanford 2A lack this second pop-up structure and consequently have higher surface slopes.
The top views for experiment 2 after 10 cm shortening are shown inFig. 18. Approaching the sidewalls of the models, thrusts are convex to the hinterland with the thrust wedge becoming narrower and steeper. Along-strike structural changes are present in all models away from the sidewalls, with curved thrust segments and along-strike merging of thrusts. The along-strike changes are also well visible in the cross-sectional wedge geometries shown for 5 different locations inFig. 19.
The surface slope is measured in cross sections at the 25%, 50% and 75% positions and varies between 4and 24(Fig. 20). Surface slopes measured along one sidewall (0% position) are shown for comparison and are, for one particular model, generally consider-ably higher than those measured at the other three positions. Variations in surface slope along strike within one model are generally small, with most models showing along-strike differ-ences between maximum and minimum surface slope of less than 4(Fig. 20). Only the Lille 2B model and Melbourne 2A model have higher along-strike differences of 6and 11, respectively.
The number of thrusts has also been measured at the 25%, 50% and 75% positions (Fig. 21). Models have between 3 and 5 forward thrusts at the end of the experimental run (10 cm of shortening), except Mexico 2A and 2B, and Piscataway 2A, which have a higher number of thrusts (up to 9), and Bern, which has only two forward thrusts (Fig. 21a). The number of backthrusts varies between 1 and 9, and in comparison with the forward thrusts, there is an overall higher along-strike variability in the number of backthrusts within one particular model.
4.2.3. Model similarities and variability
The experiment 2 models share a number of similarities:
(1) the development of forward thrusts propagating in-sequence and the formation of back thrusts,
(2) the formation of afirst pop-up adjacent to the mobile wall forming in all models before 1 cm of shortening
(3) the fairly uniform dip of the first forward thrust, which steepens slightly upwards, resulting in a slightly listric thrust plane
(4) thefirst backthrust that forms close to the mobile backwall dips steeper than thefirst forward thrust
(5) in top views thrust wedges are curved with a convex to the hinterland shape. Sidewall friction results in a narrower and steeper wedge immediately along the sidewall when compared to sections through the center of the model
However, our quantification of experiment 2 model results shows that there are also important variations, notably:
(1) The number of forward thrusts and backthrusts that formed after a certain amount of shortening is variable when comparing all models (Fig. 14a). For example, the number of forward thrusts through the centre of the model after 10 cm shortening varies between 2 and 9, whereas the number of back thrusts varies between 1 and 9 (Fig. 21). Variability in
Slope angle
Spacing
top
middle
basal dip
new thrust
Surface slope
Thrust spacing
Thrust dip angle
a)
b)
c)
Fig. 6.Schematic illustration of measurements of a) surface slope, b) forward thrust spacing, and c) thrust dip angles. Surface slope is measured as the bestfitting line through the valleys (Stockmal et al., 2007) and can only be determined once at least 2 thrusts have formed. Thrust spacing is measured horizontally from a newly initiated in-sequence forward thrust to the previously formed forward thrust.
the number of thrusts within one particular model is less with a difference in number of thrusts along strike varying from 0 to 3 (Fig. 21).
(2) The surface slope of the thrust wedge is highly variable. Whereas four out of thefive models analysed by XRCT show an oscillating behaviour in surface slope, reflecting new thrust formation, Bern 2A model shows a steady increase in surface slope. After 10 cm of shortening the surface slope through the centre (50% position) of all models varies be-tween 4and 24.
(3) Not all models develop a second pop-up structure. In case a second pop-up forms, the associated back-thrusts cut in most cases previously formed forward thrusts in the hinterland.
The variations in overall wedge geometry result from local scale variations in thrust dips. Notably, the variability in dip of newly formed back thrusts is large, with dip angles ranging from 26to 50, and also the width of the initial pop-up structure through the centre of the models (Fig. 13) varies considerably due to varying dip angles of forward and in particular back thrusts.
4.3. Experiment 2 model and the critical taper theory
The internal peak friction angles of the quartz and corundum sand used in experiment 2 are nearly identical (Table 1) and a value of
f
p¼36is considered a good approximation for the entire sand wedge. If we take into account the uncertainty in the basal friction angle (f
b) of the quartz sand layer, ranging between 15and 21,the analytical solutions derived from the critical taper theory indicate that the critical taper angle, which equals the surface slope for experiment 2 with a horizontal base, would be between c. 4 and 6 (taking only the lowest of the two permissible critical taper angles) for a sand wedge with depth-dependent cohesion of 20 Pa cm 1.
The initial horizontally layered models of experiment 2 start out as a sub-critical wedge and deform by in-sequence thrusting. After 10 cm of shortening sections through the centre of the models show a wide spread in surface slope, ranging between 4and 24. Only the surface slopes of models GFZ@Bern, Taipei 2A, Uppsala 2B, with slopes of 5, 6, and 4, respectively, are within the predicted range of values for a cohesionless wedge. The fact that a few models do reach a critical taper could suggest that at 10 cm shortening the wedges are at the verge of transition from an immature, subcritical wedge to a critical one.
The discrepancy between most model surface slopes and analytical predictions of the critical taper theory are possibly related to a combination of factors described below:
(1) After 10 cm shortening, the surface slope in the deforming thrust wedge might not have yet stabilised and more shortening might be needed in order for the sand wedge to achieve steady state and reach its critical taper. It has also to be kept in mind that the critical taper theory assumes a perfect, infinite length wedge, with a sharp tip. Here, the wedge tip is replaced by a flat layer of thickness (3 cm), which is as much as half the maximum wedge height (about 6 cm) at the end of experiments. Departures from the as-sumptions of the theory are therefore substantial.
(2) Compaction and dilation of sand during localization of deformation along faults, which is not considered in the critical taper theory, also affects the frictional strength of the wedge. Lohrmann et al. (2003) show that the frictional strength of the wedge changes as faults form in the wedge, and that the behaviour of the wedge is controlled by the frictional strength of these faults, which have angles of stable sliding. Hence, in our case it would be more appropriate to take the internal angle of friction at stable sliding strength (
f
s) which is 31, instead of the internal angle of friction at peak strength (f
p), which is c. 36, and also the boundary friction angle at stable sliding strength of quartz sand (f
bs), which is between 9 and 14instead of the boundary friction angle at peak strength (f
b), which is between 15 and 21 (Table 1). Using stable sliding internal friction values (neglecting cohesion), the critical surface slopes range be-tween 3and 5.2, i.e. essentially the same as using the peak values (3e6), because the loss of strength in the bulk ma-terial and at the base partly counteract each other.
(3) Ring-shear tests show that our analog model materials have a basal cohesion that is not taken into account in the critical taper theory. With uniform basal and peak cohesion, a crit-ical taper would assume a concave surface shape. Estimates using the limit analysis method (Mary et al., 2013b) yield surface slopes around 5
e6 for
f
p ¼ 36,f
b ¼ 15, Cp¼20 Pa and Cb¼15 Pa; and in a higher range of 11
e13 for
f
p¼36,f
b¼21, Cp¼70 Pa and Cb¼140 Pa. Therefore, cohesion of the materials could in part explain the discrep-ancy with the critical taper theory.5. Experiment 3
5.1. Experiment 3: model set-up
In the set-up of experiment 3 a thin rigid sheet, 1 mm thick, and β = 0
3 cm
quartz sand
5 cm
v = 2.5 cm/h
no exit slot
8.24 cm α = 20°
Mobile vertical wall
Fig. 8.Model set-up for experiment 1.
Quartz sand
Mobile wall
Fixed wall
Template Quartz sand 3 cm(a)
(b)
Fig. 10.Evolution of experiment 1 model run at Bern after 0, 2 and 4 cm of shortening (a) XRCT sections through centre of model, (b) top view photographs of model.
12 cm in length is attached to the mobile wall and underlies part of the model. The tip of the rigid sheet has a perpendicular cut. Displacement of the mobile wall creates a moving basal velocity discontinuity where deformation localizes away from the mobile wall during shortening of the model (Fig. 22). The thin sheet is covered by Alkor foil, as are the base and the four vertical walls of the experimental apparatus. The model consists of three 1-cm-thick layers of quartz and corundum sand. Minimum prescribed model length parallel to the movement direction is 35 cm.
Experiment 3 was done by 14 laboratories, and a total of 22 models were run, of whichfive were analysed by XRCT.
5.2. Experiment 3: results
5.2.1. Evolution of models analysed by XRCT
The cross-sectional evolution through the centre of experiment 3 models reveals that in allfive models analysed by XRCT a pop-up structure has formed at the tip of the moving basal sheet after 1 cm of shortening (Fig. 23). At this stage the overall dip of the backthrust is somewhat steeper than the forward thrust (Fig. 24). Both forward thrust and backthrust have a slightly listric shape with dips be-tween 26and 32at the top, and between 17and 23near the base (Fig. 25).
With continuing shortening thefirst-formed forward thrust is advected upward along the backthrust, and new in-sequence for-ward thrusts initiate at the base, propagate upfor-ward and either merge with the pre-existing forward thrust at depth or reach all the way to the surface. This process is repeated during continuing shortening: previously formed forward thrusts are displaced along the backthrust and new in-sequence forward thrusts form in the footwall. The dip of new in-sequence forward thrusts is in general shallower than thefirst-formed forward thrust and their dip near the surface varies between 22and 27.
After 3.5 cm of shortening, the surface slope of thefive XRCT
models, measured in sections through the centre of the model, varies between 5and 16(Fig. 25). During initial shortening the surface slope in each model increases, and then shows an oscil-lating behaviour which tends to become less important with increasing shortening. Comparing the XRCT models indicates that the spread in surface slope values tends to diminish with increasing Mobile
vertical wall
1.0 cm quartz sand 1.0 cm corundum sand 1.0 cm quartz sand
min. 35 cm
no exit slot v = 2.5 cm/h
Fig. 12.Model set-up for experiment 2.
Fig. 13.Cross-sectional evolution through centre of experiment 2 models after 1, 2, 6 and 10 cm of shortening as observed in XRCT images.
Fig. 15.Dip angles of successive in-sequence forward (a) and back thrusts (b) in centre of experiment 2 XRCT models, measured at top, middle and bottom.
shortening. At 10 cm of shortening surface slopes range between 16and 22(Fig. 25).
5.2.2. Final deformation stage
A comparison of all cross sections at the 50% position after 10 cm shortening (Fig. 26) shows very similar geometries: a series of forward thrusts with relatively small, individual offsets, and one backthrust with a large offset, except for the Lille and Melbourne 3A models which show an additional backthrust.
Top views of all models indicate slight lateral variations in the strike of forward thrusts and lateral merging of forward thrusts (Fig. 27). In top views, both forward thrusts and backthrusts have a convex to the hinterland shape as a result of friction along the sidewalls.
Cross sections atfive different positions after 10 cm of short-ening (Fig. 28) show minor lateral variations, which mainly relate to surface slope and number of forward thrusts.
The surface slope for all models at the 25%, 50% and 75% posi-tions is quite uniform, with values between 16and 24(Fig. 29). The Uppsala 2B model is the only exception. It has a shallower surface slope ranging between 12and 14at all three positions. Lateral differences in surface slope within one model are minor, mostly only between 1 and 3. Only the Bern 3B and Lille models show larger along-strike variations with differences in values of surface slope up to 5.
The number of forward thrusts was determined in cross sections at the 25%, 50% and 75% positions and only thrusts that produced a noticeable offset at the surface were considered (Fig. 30). The number of forward thrusts varied between 4 and 9 among all models. Within one particular model the difference in thrust number along strike is small, between 1 and 2 for most models, with only the Bern 3B, GFZ@Bern and Piscataway 3A models showing a difference in thrust number of 3.
5.2.3. Model similarities and differences
Visual comparison of all experiment 3 models shows that the evolution of structures both in cross section and top view is very
similar. A pop-up structure forms initially above the moving basal velocity discontinuity, with subsequent in-sequence forward thrusts being advected along the backthrust and becoming suc-cessively inactive when a new forward thrusts forms at the tip of the moving basal sheet. The backthrust, however, remains active throughout the shortening and accommodates much more fault displacement than individual forward thrusts. Nearly all models have only one backthrust and between 4 and 9 forward thrusts.
The surface slope of the models at 10 cm shortening varies be-tween 12 and 24. These values are well above the predicted critical taper angles (c. 4e6) for sand with
f
p¼36,f
bbetween 15and 21 and C¼0. However, the particular set-up of experiment 3 probably does not warrant a direct comparison with the critical taper theory. The critical taper theory accounts for a situation in which the velocity discontinuity (between mobile wall and mate-rial) is adjacent to the wedge, whereas in experiment 3 the velocity discontinuity is below the sand wedge. The pop-up that forms at the tip of the rigid basal sheet results in a wedge of material in the footwall of the backthrust that remains undeformed and is passively displaced along with the basal sheet. As a result the backthrust remains active throughout the experiment, advecting material and forward thrusts upward, but at the same time pre-venting propagation of forward thrusts away from the velocity discontinuity towards the foreland.
6. Discussion of model results
6.1. The effect of sidewall friction
wedge in top view. This is largely consistent with the analysis of
Souloumiac et al. (2012), who measured the effect of sidewall friction in experiments in which a sand wedge undergoes plane-strain shortening. They varied the surface SLof sand in contact with the sidewalls, and the surface SBin contact with the base plate of the sandbox. For initial ratios SL/SB between 0.1 and 0.35, Souloumiac et al. (2012)found that sidewall friction during short-ening of the sand wedge causes thrust curvature near the side walls, whereas for SL/SBratios<0.1 sidewall friction has negligible effects. At SL/SBratios>0.35, thrusting occurs at different locations throughout the box, revealing a major experimental bias (Souloumiac et al., 2012). For the experiment 2 and 3 models pre-sented here, SL/SBvaries between 0.075 and 0.3, and all models show thrust curvature near the sidewalls (Figs. 18 and 29). The fact that the Bern and IFP models, with SL/SBratios<0.1 still show thrust curvature near the sidewalls might be related to the difference in the nature of the walls, i.e. foil-covered walls in the experiments presented here and glass walls in the experiments ofSouloumiac et al. (2012). From an inspection of top views, we estimate that sidewall friction only plays a role on thrust wedge curvature until c. 5 cm away from the sidewalls. All our quantified parameters are measured in sections that are at least 5 cm away from the sidewalls (except IFP exp 1), and hence our results are not expected to be affected by the effects of sidewall friction.
Friction on the moving back wall also has an effect. In the
previous analogue model comparison (Schreurs et al., 2006,
Fig. 2b), six models developed a pop-up against the back wall, and two models developed a single forward thrust rooted at the back wall-base plate corner. Souloumiac et al. (2010,Figs. 11 and 14) showed that this difference is due to the friction on the back wall: at high friction, a pop-up develops in order to reduce sliding on the back wall, whereas at low friction we observe a single forward thrust and vertical slip on the back wall. Here, sands and sidewall materials are identical in all models, and all models develop the same initial structure: a pop-up. This is a substantial improvement compared to the previous comparison (Schreurs et al., 2006), and a confirmation that the pop-up/forward thrust discrepancy is due to differences in friction of sand against the back wall material, pro-vided other parameters like basal friction arefixed.
6.2. Influence of experimental set-up on model reproducibility
The results of our three different thrust experiments demon-strate that the set-up itself has an influence on model reproduc-ibility with experiment 1 showing the highest degree of similarity, followed by experiment 3 and then by experiment 2.
All experiment 1 models show exactly the same evolution, i.e. stable sliding of a triangular sand wedge without significant in-ternal deformation and a surface slope that remains nearly constant throughout the experiment. Experiments 2 and 3 consist of
Fig. 19.Cross sections after 10 cm shortening for experiment 2 models at positions 25%, 50%-2 cm, 50%, 50%þ2 cm and 75% (seeFig. 6) showing along-strike structural variability.
horizontally layered models that are shortened by inward move-ment of a mobile wall. The undeformed models in both experi-ments represent subcritical wedges. The only difference between the two experimental setups is the presence of a thin, rigid basal sheet attached to the mobile wall in experiment 3. Hence, in experiment 3 a singularity is stationary with respect to the moving sheet tip and displacement of the mobile wall forces deformation to remain localized at the singularity resulting in a good similarity among all models with only minor variations in quantitative pa-rameters such as surface slope, and thrust dip. In contrast, in experiment 2, the singularity is located at the active forward thrust, which is less constrained in space, and consequently models show a larger variability, in particular with regard to the number of for-ward thrusts, which in experiment 2 varies from 2 to 9 for forfor-ward thrusts and from 1 to 9 for backthrusts.
6.3. Variations within and between models
Both experiments 2 and 3 models show similar cross-sectional evolutions demonstrating reproducibility of first-order experi-mental results. However, for both experiments we do observe variations of structures both in map view and in cross sections. Thrusts merge along strike and show slight variations in their surface strike. Quantification of parameters in cross-sections also documents variations among models and lateral variations within one model, in particular for experiment 2. Possible explanations for these variations are discussed below:
(1) Even though the prescribed model construction techniques were stringent concerning sieve mesh size, sifting height, and sifting rate, it is unlikely in practice that the initial un-deformed model is perfectly homogeneous and has constant values of internal friction, basal friction, internal cohesion and basal cohesion throughout. Slight variations in these values might be caused by small changes in sifting height or sifting rate during model construction or might have occurred during off-scraping of excess material. An inspec-tion of the first-formed pop-up structure in the centre of XRCT experiment 2 models shows that those of Bern 2B and IFP 2A are quite asymmetric, with a steep backthrust dipping at c. 45and a relatively shallow forward thrust. The other three models (Bern 2A, GFZ@Bern, and IFP 2B) have a more symmetric pop-up structure. Analogue models testing the influence of basal friction on the thrust wedge shape (e.g.
Colletta et al., 1991; Huiqi et al., 1992) reveal that initially horizontally layered models with a low basal friction have a more symmetric style of thrusting than models with a high basal friction, which have a more asymmetric thrust style. This would suggest a variability in initial basal friction be-tween the models, at least near the moving wall with models Bern 2B and IFP 2A having higher values of basal friction. This variability, as well as the variability of the measured friction of sand on Alkor foil in ring-shear tests (boundary friction,
Fig. 20.Surface slope after 10 cm of shortening at 25%, 50% and 75% positions for experiment 2 models. The surface slope could not be reliably measured on all cross-sectional images. Surface slopes for Lille 2A and Lille 2B models were measured at 50% 2 cm position. Numbers above symbols indicate difference between maximum and minimum slope angle within one particular model and are only given for those models in which the surface slope could be determined at all three positions. Surface slope values along one sidewall (0% position) are given for comparison and are generally higher.
properties during repeated tests, as sand grains scratch its surface. In our experiments electrostatic forces will occur at the interface Alkor foil/sand, but their magnitudes are diffi -cult to determine and their effect on the structures remains unknown. Variability in model results might also be caused by the presence of tiny air pockets trapped below the Alkor foil during adhesion to the base of the sandbox resulting in a slightly uneven surface and varying basal friction conditions. (2) During the initial stages of the experiment, shortening of the model will result in compaction of the sand grains close to the mobile wall, and hence compaction gradients will form.
Adam et al. (2013)could visualize this diffuse, non-localised deformation in analogue models using digital image corre-lation techniques applied on XRCT images. The lateral vari-ations in compaction might enhance or reduce the initial variations in mechanical properties introduced during model construction. The spatial and temporal evolution of the compaction gradients will depend on the experimental set-up. For experiments 1 and 2, initial compaction occurs adjacent to the mobile wall, whereas in experiment 3, it starts near the tip of the basal sheet.
(3) Laboratory climatic conditions varied and in particular the relative humidity might have an influence on the cohesion of the sands, and thus on model results.Forsyth et al. (2002)
investigated the influence of atmospheric humidity on glass spheres with different sizes. For the range of grain size used in our experiments (c. 80e200
m
m), Forsyth et al. (2002) could show that glass spheres only start to show cohesive or stick-slip behaviour at relative humidities>65%. As most laboratories reported humidities below 65%, hu-midity is probably not a major factor influencing model re-sults. However, it has to be kept in mind thatForsyth et al. (2002) only investigated the influence of humidity on perfectly spherical grains with identical grain size. Ourquartz and corundum sands have an angular grain shape and a heterogeneous grain size distribution, and an uncertainty remains with regard to the role of humidity on the cohesion of our material.
(4) One of the striking results of the present comparison is the large variability in surface slopes, thrust dips, and particu-larly numbers of thrusts. Large variations occur even be-tween repetition of experiments in the same laboratory. They also do occur along strike of single models. Details of each thrust is little reproducible after substantial shortening, despite our present efforts to remove experimental imper-fections. This variability is a feature of the localisation pro-cess in frictional materials that cannot be completely removed by an improvement of experimental protocols. The exact location and dip of a thrust depend on minute changes in the distribution of sand grains that promote or delay the onset of dilatation, which has a long term effect upon further shortening. This can also be understood theoretically by recalling the central argument of the critical taper theory: that the wedge will deform to maintain the stress field everywhere on the verge of Coulomb failure. Any model imperfection ruins this simplicity and triggers the next fail-ure, resulting in a system that is highly sensitive to initial conditions and to external perturbations (Mary et al., 2013a).
6.4. Recommendations and potential improvements
We recommend that a minimum standard be adhered for experimental descriptions. Often analogue model materials are inadequately characterized and model building and experimental procedures are incomplete. Experimental descriptions should include the physical characteristics (e.g. grain size, grain size dis-tribution, grain shape) of the analogue materials, the mechanical properties (e.g. cohesion and angles of internal friction at peak and stable strength, basal friction) and how measured, model con-struction technique (e.g., physical handling technique, size of sieve mesh, sifting rate, scraping details) and laboratory climatic condi-tions (temperature, humidity).
In order to reduce the influence of the human factor and mini-mize initial heterogeneities in material properties introduced during model construction, one could consider using a special sedimentation device for sifting sands. Maillot (2013) built a Mobile
vertical wall min. 35 cm
12 cm moving velocity discontinuity
no exit slot 1.0 cm quartz sand
1.0 cm corundum sand 1.0 cm quartz sand
min. 23 cm rigid sheet (1 mm thick) v = 2.5 cm/h
Fig. 22.Model setup for experiment 3.
sedimentation device in an attempt to produce uniform sand packs. For Fontainebleau sand with a 250
m
m median grain size,Maillot (2013) could show that the density of the resulting sandpack is close to its maximum value, reproducible and uniform. Although the sedimentation device surely presents an advantage in terms ofmodel homogeneity, it requires extensive testing to produce rela-tively level sand packs. Spatial variations in the thickness of the sand layers cannot be avoided due to downward air currents during infill resulting in a central depression and excess thickness near the four walls. Whereas thickness variations in the centre of the
15 20 25 30 35
1 2 3 4 5 6 7 8 1
forward thrust number forward thrust number forward thrust number
)° ( pi d p ot )° ( pi d el d di m )° ( pi d m ott o b )° ( pi d p ot )° ( pi d el d di m )° ( pi d m ott o b 15 20 25 30 35 15 20 25 30 35 15 20 25 30 35 15 20 25 30 35 15 20 25 30 35
1 2 3 4 5 6 7 8 1
1 2 3 4 5 6 7 8 1
backthrust backthrust backthrust Bern 3A Bern 3B GFZ@Bern IFP 3A IFP 3B
Fig. 24.Dip of successive forward thrusts at time of initiation through centre of model, measured at bottom, middle and top in experiment 3 XRCT models.
sandbox are mostly below 4% for a model thickness of c. 3e4 cm, variations near the lateral walls are more important (Maillot, 2013). Although a best value ofþ6% is reached, the excess thickness near the walls can be larger than 100% depending on the type of sand, the sedimentationflux and the number of sieves used (Maillot, 2013). In any case, the sieving process is a central ingredient in model construction. Other devices could be developed for special setups or for producing layered models consisting of different granular materials.
Cubas et al. (2010) performed analogue model experiments using such a sedimentation device to quantify the intrinsic vari-ability of model results. The experiments consisted of shortening an initially subcritical sand wedge resting on a flat sand layer by translating the wall on the wedge side over a distance of 30 mm. By repeating experiments and applying statistical methods to ob-servables measured infinal-state cross sections through the central part of the box (where side-wall effects did not play a role), they could for example show that the error bar for fault dips are c. 3.3 for thefirst pop-up that forms, with forward thrusts dipping at 38 ± 3.2 and backthrusts at 41± 3.3. These values are of course dependent on the granular material used, the experimental pro-tocol and the set-up. Although our experiments 2 and 3 consisted of a different set-up (our models are initially horizontal), used different granular materials and did not involve the sedimentation device ofMaillot (2013), a comparison of the error bars for fault dips of forward and backthrusts measured at the top in XRCT sec-tions through the centre of the model shows largely comparable error bars, with forward thrusts dipping at 29±3in both exper-iments 2 and 3. Backthrusts in experiment 2 have a larger error bar with faults dipping at 36±9, whereas backthrusts in experiment 3 show a smaller error bar with faults dipping at 30±2.
Compaction of the granular model material prior to deformation might also reduce variability in model results. Compaction, how-ever, would need to be done in a systematic and reproducible way, e.g. by shaking or tapping. In addition, one would need to
determine the mechanical properties of compacted granular ma-terial using an apparatus in which compaction is achieved in an identical way as for the analogue model.
In our model comparison we choose to use quartz and corundum sand used at the laboratory in Bern. These sands have their own specific physical characteristics and mechanical proper-ties. It can not be excluded that the use of another type of sand, with different grain shape, grain size, and grain size distribution, might improve experimental reproducibility. This would require further testing.
Finally, repeating experiments should be performed in order to ensure that intrinsic variability (in identical setups) is properly defined and smaller than the expected effects related to (extrinsic)
“controlling”factors.
7. Concluding remarks
We have made a quantitative comparison of brittle thrust ex-periments to evaluate the variability among analogue models and to appraise reproducibility and limits of model interpretation. The reasons for variability in analogue model experiments boils down to the system-wide effectiveness of small disturbances. Bearing this in mind the philosophy behind our benchmark was to minimize this by choosing the most simple and most insensitive setups, boundary conditions and materials keeping them as homogeneous as possible in the different laboratories. For three different thrust wedge experiments, we quantified parameters such as fault dip, fault spacing, thrust number, thrust formation and surface slope. In contrast to the model comparison ofSchreurs et al. (2006)we made quantitative comparisons of model results in sections at least 5 cm away from the sidewalls, to avoid non-representative results due to complex interactions between sidewall friction and basal friction.
occurred to flatten the surface. Small changes in sifting height, sifting rate, and scraping will result in slightly heterogeneous ma-terial densities, which will affect the mechanical properties of the granular material, and result in lateral and vertical differences in peak and basal friction angles, as well as cohesion values once the model is constructed. Initial variations in basal friction are most likely responsible for most of the variability in model results. Part of the variability might also be explained by our choice not to compact models prior to deformation. In our benchmark, shortening causes compaction of the granular materials leading to compaction gra-dients that are superposed on previous heterogeneities introduced during model construction. Differences in relative humidity be-tween participating laboratories might also have an effect on granular material cohesion and hence on model variability. The influence of humidity on the cohesion of the sands used in our model comparison remains poorly known. Taking into account the experimental studies ofForsyth et al. (2002), however, we consider that its influence on model variability is most likely minimal.
Our observations highlight the limits of up-scaling quantitative analogue model results to nature or for making comparisons with numerical models (Buiter et al., 2016). It will remain difficult to scale quantitative results such as number of thrusts, spacing
between forward thrusts, or width of pop-up structures from model to nature. The way forward is perhaps to build statistical descriptions of the measured parameters rather than using single values. These would in turn provide more reliable data for a com-parison to numerical simulations.
Our model comparison shows that even for simple plane-strain experiments with prescribed stringent model construction tech-niques, the human factor plays a decisive role, and even when one modeler repeats the experiment, the quantitative model results show considerable variability. Although this might atfirst seem a discouraging conclusion, the failure of the models to achieve per-fect replicability despite our precautions can be considered a suc-cess in documenting the importance of initial model heterogeneity. As is the case for natural thrust wedges, the initial undeformed sand model is not perfectly homogeneous throughout, but already has slight variations in mechanical properties such as internal friction, basal friction, internal cohesion and basal cohesion. Small differences in these parameters will affect how, where and when thefirst thrusts form and will affect the details of the timing and location of subsequent thrusts.
The variability reported in our benchmark is considerable and should serve the analogue modeling community as a constraint on
10 15 25
20 30
10 15 25
20 30
surface slope (°)
Bern 3A Bern 3B
Buenos Aires GFZ@Bern
IFP
3A
IFP
3B
Kyoto Lille
Melbourne 3A Melbourne 3B
Mexico
Parma 3B
Parma 3A
Piscataway 3A Piscataway 3B
Stanford 3A Stanford 3B
T
aipei 3A Taipei 3B
T
oronto 3A Toronto 3B
Uppsala 3A Upssala 3B 50% position
25% position
75% position
Fig. 29.Surface slope after 10 cm of shortening at 25%, 50% and 75% position for experiment 3 models.