REGULAR ARTICLE
DETERMINATION OF LEPTIN EXPRESSION IN BEEF CATTLE BLOOD SAMPLES USED BY RTQ PCR
Simona Kunová*, Lukáš Hleba, Peter Haščík, Juraj Čuboň, Miroslava Kačániová
Address*: Ing. Simona Kunová, PhD., Slovak University of Agriculture in Nitra, Faculty Biotechnology anf Food Science, Department of Food Hygiene and Safety, Tr. A. Hlinku 2,
949 76 Nitra, email: [email protected], phone number: +421376415807
ABSTRACT
The aim of our study was to detect the presence and concentration of leptin in different breeds of cattle by PCR and Real time PCR method. Blood of different breeds of bulls was used as biological material in our experiments: Slovak pied cattle (10 samples), Blondaquitane × Pinzgau breed (10 samples) and Holstein breed (10 samples). The presence of leptin was detected in all samples based on the results of molecular-genetic detection of leptin gene. The average concentration of leptinin 30 samples of beef cattle was 22.1477
μg.μl-1. Differences in leptin concentrations were statistically significant between Holstein
breed and Slovak pied cattle and between Slovak pied cattle and Blondaquitane × Pinzgau breed.
Keywords: Leptin concentration, beef cattle, leptin gene, polymerase chain reaction
INTRODUCTION
Expression of the ob gene and circulating leptin concentrations are highly correlated
with percentage of body fat in rodents (Soukas et al., 2000) and the degree of obesity in
humans (Auwerx and Staels, 1998). Leptin is also involved in reproductive function. Indeed,
ovarian steroid genesis (Swain et al., 2004). Moreover, leptin modulates maternal nutrient partitioning in order to optimize the provision of nutrient for fetal growth and development (Holness et al., 1999).
The glucocorticoids, growth hormone, insulin, triiodothyronin (T3) and thyroxin (T4)
are all factors that regulate leptin expression or its plasma level to some extent (Chilliard et
al., 2001). In cattle, plasma leptin levels are closely correlated with adipose tissue cellularity,
body condition score and nutritional status (Chilliard et al., 2001; Delavaud et al., 2002).
Moreover, circulating leptin levels in beef cattle increase during fattening (Kawakita et al.,
2001). Ob mRNA levels are proportional to adipocyte size and increase with increasing body
fat (Houseknecht and Portocarrero, 1998).
The mechanisms leading to differences in carcass characteristics, particularly fat
accumulation, between cattle breeds are not well understood (Higashiyama et al., 2003).
Circulating leptin and adipose tissue leptin mRNA levels are correlated with body weight,
food intake, nutritional status, and adipose tissue mass in humans and animals (Larsson et al.,
1998; Delavaud et al., 2002). The leptin factor has gained much attention recently as a key regulator of biological processes that are related to very important productive traits in beef
cattle, such as feed intake, fat content and meat quality (Geary et al., 2003). In turn,
polymorphisms in the corresponding gene have been proposed as predictors of relative
differences among individuals for those traits (Schenkel et al., 2005).
Although white adipose tissue (AT) and adipocyte-containing tissues are the main sites of production, leptin gene is also expressed, at much lower levels, in placental and fetal tissues, mammary gland, stomach, muscles, brown AT, etc. in rodent and human species (Margetic et al., 2002). In ruminants, leptin gene was shown to be expressed in AT, fetal
tissues, mammary gland (Leury et al., 2003), rumen, abomasum and/or duodenum and
pituitary gland (Yonekuraet al., 2003). Leptin could act not only as an endocrine signal in
the brain and/or the very large number of peripheral tissues in which leptin receptors are expressed, but also as an autocrine/paracrine signal within tissues where it is produced, in
rodents, humans and ruminants (Huan et al., 2003).
Studies on leptin gene expression in ruminant adipose tissue began in 1997. The first
data were obtained with total RNA Northern blot analysis (Kumar et al., 1998), ribonuclease
protection assay (Dyer et al., 1997) or semi quantitative RT-PCR (Bocquier et al., 1998) in
sheep, and with Northern blot on Poly-A+ mRNA or ribonuclease protection assay (Ji et al.,
1998) in cattle, due to the relatively low level of AT leptin mRNA. Real-time quantitative
2002) RT-PCR methodologies were then developed either to quantify more precisely leptin mRNA in ruminant AT or adipocyte-rich tissues (such as the non-lactating mammary gland), or to look at its putative expression in other tissues.
The effects of leptin could be modulated by the partition of circulating leptin between the free (active but rapidly disappearing) and soluble receptor-bound form (less active but
more stable), as was shown in humans (Sinha et al., 1996) and rodents (Hill et al., 1998).
Results from two independent research groups suggested that there was no leptin binding
protein in cattle plasma (Leury et al., 2003; Garcia et al., 2002). However, a recent meeting
abstract suggested that the soluble form of leptin receptor was present in cattle plasma and changed according to either weaning or pregnancy–lactation cycle. Further studies are needed to clarify these contradictory findings, and to develop new tools to refine studies on in vivo
leptin effects (Crouch et al., 2004).
In cattle, plasmaleptin levels are closely linked to adipose tissue cellularity, body
condition score, and nutritional state (Chilliard et al., 1998; Delavaud et al., 2002).
Moreover, circulating leptin levels in beefcattle increased during fattening (Kawakita et al.,
2001; Tokuda et al., 2001). The beef marbling standard (BMS) score was positively
correlated with leptin levels (Minton et al., 1998), or not (Kawakita et al., 2001; Tokuda et
al., 2001).
The objective of our study was to detect the presence and concentration of leptin in different breeds of cattle by PCR and Real time PCR method.
MATERIAL AND METHODS
Determination of the leptin concentrationin the standards of individual animals was performed using a spectrophotometer (DNA reader) UV 11 01 Biotech.
Biological material of cattle
Blood samples were collected immediately after slaughter of animals. Heparin was added to samples. Blood samples were stored at temperature – 18 °C.
Blood samples were collected from the following breeds:
- 10 samples from Slovak pied cattle, average age of bulls was 20 months, - 10 samples from Holstein cattle, average age of bulls was 7 months,
Isolation of DNA from 500 ml blood
Defrosted blood samples in a water bath at temperature 37 °C were used to isolate DNA.
Lysis of cells:
Defrosted blood was mixed. 500 µl of blood and 150 µl of 10 % solution Triton X-100
were pipetted into 1.5 ml eppendorfs. The samples were vortexed durin 3 minutes.
Samples were centrifuged at 13 000 rpm 1 minute. Supernatant was removed, 10-20 µl
of solution over the pellet of white blood cells remained.
Samples were vortexed again during 10-20 seconds. Pellet of white blood cells was not
seen after vortexing.
600 µl lysis solution was added, cells were lysed by pipetting up and down 3-5 times.
Precipitation of proteins
Samples were cooled to room temperature.
200 μl of solution to precipitation of proteins was added to the lysed samples. The
samples were vortexed at the highest speed during 20 seconds. Solution to precipitate the proteins was mixed with cell lysate.
The samples were centrifuged 20 minutes. The precipitated proteins created a solid
dark brown pellet on the bottom of eppendorf.
Precipitation of DNA
Supernatant containing DNA was added to1.5 ml eppendorf, which contained 600 μl
100 % isopropanol (2 – propanol).
Samples were mixed. DNA was visible as a small white pellet.
Supernatant was carefully removed by pipetting, 600 μl 70 % ethanol was added,
DNA pellet was washed by shaking of closed eppendorf.
The samples were centrifuged at 13 000 rpm for 5 minutes, ethanol was removed by
pipetting
The samples were dried at laboratory temperature for 10 – 15 minutes.
Dissolving DNA
DNA was dissolving by the samples incubation at temperature 65 °C for 1 hour.
DNA was stored at temperature 4 °C, for longer storage is necessary to store DNA at
-20°C or -80 °C.
UV-spectrophotometric quantification of DNA
Absorbance was measured at a wave-length of 260 nm. DNA concentration was calculated based on the finding that a solution of 2-stranded DNA with a concentration 5 µg.ml has a absorbance about 0.1 A. Additional measurement of absorbance at a wave-length of 280 nm was used to detect possible contamination of sample by proteins. The sample is uncontaminated by proteins, if A260/A280 is between 1.8 and 2.0.
PCR method Primers used:
Forvard (FOR) 5 'ATGCGCTGTGGACCCCTGTAT C 3',
Revers (REV) 5' TGGTGTCATCCTGGACCTTCC 3'.
Electrophoresis in agarose gel
Identification and analysis of isolated DNA was made by electrophoresis in agarose
gel. Agarose and 1 x TBE solution (89 mmol.l-1 Tris-HCl, 89 mmol.l-1 boric acid, 2 mmol.l-1
EDTA) were used for preparation of agarose gels. The final gel concentration was 3.5 (Sambrock et al., 1989). The gel also contained an interaction reagent ethidiumbromide (5
μl.ml-1). Electrophoresis was performed in 1 x TBE solution at a maximum voltage of 5 Vat 1
cm and electrode distance (80-120V) for 30-90 minutes. Samples were applied together with 6 x coloring solution (0.25 % bromphenol blue, 40 % saccharose, 0.1-0.2 M solution EDTA) in a ratio 5:1 (PCR product : coloring solution). The separated mixture was applied at electrophoretic identification of separated fragments together with coloring solution. Separated fragments were detected by UV transilluminator after electrophoresis. DNA weight markers (DNA Ladder 100-1000 bp, Promega) were used to determine of the exact size of the fragments. The resulting PCR product has a size of 94 bp.
RTQ PCR method (real-time quantitative PCR)
Isolation of the samples was the same as for classical PCR Primers used:
Revers (REV) 5' TGGTGTCATCCTGGACCTTCC 3'.
Polymerase chain reaction was performed in a thermocycler MJ Mini Opticon Real time PCR System (Biotech).
Characteristics of the RTQ PCR kit
DyNAmoTM HS SYBR® Green qPCR kitis used for quantitative analysis of DNA
samples from different sources in real time. Quantitative qPCR method is suitable for the detection of gene expression, detection of pathogens, viruses and many other applications.
Work of DyNAmoTMHS SYBR® Green qPCR kit is based on a hot start modified
Thermusbrockianus DNA polymerase and SYBR Green I fluorescence coloring.
Non-specific DNA-binding of domains is stopped by Tba DNA polymerase. Tba DNA
polymerase is activated by an initial denaturation of the PCR protocol. SYBR Green I is specific for double-stranded DNA and it fluoresces at the amplification of DNA.
Statistics
Mathematical and statistical analyses of variability are processes in the tables. Mathematical and statistical analysis was performed on using a software system Statgraphic. T test and f-test were used to mathematical and statistical evaluation of experiments with cattle.
RESULTS AND DISCUSSION
In rodents and in man, plasma concentrations of leptin are positively correlated with
adiposity (Pelleymounter et al., 1998). Plasma concentration of leptin is also affected by
acute changes in nutrient supply. In humans, plasmaleptin concentration drops by 70% after
a 24 hour fast (Boden et al., 1996; Kolaczynski et al., 1996a). Under these conditions, leptin
concentrations were positively correlated with the concentrations of glucose and insulin, but not with the concentration of β-hydroxybutyrate. The reduction in plasmaleptin could be prevented during fasting (72 hr) by maintaining euglycemia, suggesting that insulin and
glucose are important regulators of leptin production (Kolaczynski et al., 1996b). In general,
similar relationships have been observed between adiposity and leptin in growing and
lactating ruminants (Blache et al., 2000). Holstein bull calves were fed to grow at daily rates
demonstrated in well-fed late lactating dairy cows between plasmaleptin and body condition
score, an indirect appraisal of body fatness (Ehrhardt et al., 2000).
Despite the lack of significance for certain variables, the results obtained for plasma leptin concentration, leptin gene expression and leptin-receptor gene expression suggest that a
difference between breeds might exist (Ren et al., 2002).
Effectively, leptin is synthesised by adipose tissue and its synthesis is proportional to
abundance of adipose tissue (Chilliard et al., 1999; Chilliard et al., 2005). A high leptin
concentration is associated with fatness in pigs, in growing cattle and other mammals (Ehrhardt et al., 2000).
Chilliard et al., (2005) compared the leptinemia found in some bovine breeds differing in their body fatness. They observed that the lean breeds showed lowest values for leptin. However, when leptin values were corrected for individual differences in subcutaneous (SC) adipocyte size, there was no longer any difference in leptinemia, suggesting that plasma leptin primarily reflects differences in body fatness.
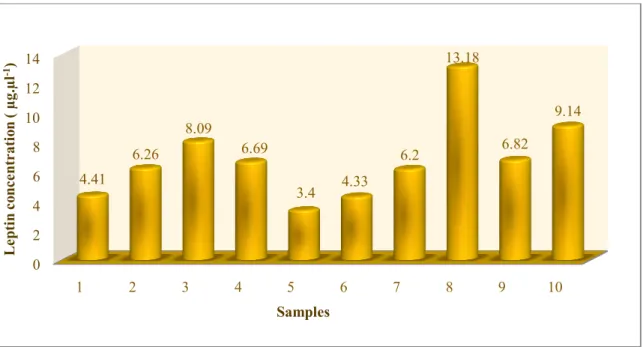
The minimum concentration of leptin was 3.4 μg.μl-1 at Slovak pied cattle, in the
sample no. 5. The maximum leptin concentration was 13.18 μg.μl-1 in the sample no. 8. Leptin
concentration in individual samples are shown in the figure 1. Average concentration of leptin
gene was 6.852 μg.μl-1 at Slovak pied cattle (Tab 1).
Fig 1 Leptin concentration at Slovak pied cattle 0 2 4 6 8 10 12 14
1 2 3 4 5 6 7 8 9 10
The minimum leptin concentration was 16.54 μg.μl-1 at Blondaquitan × Pinzgau cattle,
in the sample no. 5. The maximum leptin concentration was 38.33 μg.μl-1 in the sample no. 3.
Leptin concentration at Blondaquitan × Pinzgau cattle are shown in figure 2. Average
concentration of leptin gene was 33.47 μg.μl-1 at Blondaquitan × Pinzgau cattle (Tab 1).
Fig 2 Leptin concentration at Blondaquitan × Pinzgau cattle
The minimum leptin concentration was 3.47 μg.μl-1 at Holstein cattle in the sample no.
3. The maximum leptin concentration was 38.62 μg.μl-1 in the sample 10. Leptin
concentration at Holstein cattle are shown in figure 3. Average concentration of leptin gene
was 26.12 μg.μl-1 at Holstein cattle (Tab 1). Average concentration of leptin was 22.15 μg.μl-1
in all 30 samples of beef cattle (Tab 1).
Fig 3 Leptin concentration at Holstein cattle 0 5 10 15 20 25 30 35 40
1 2 3 4 5 6 7 8 9 10
32.81 36.4 38.33 36.12
16.54
37.73 36.89 36.72
30.96 32.2 Le pti n co nc en tr ati on ( µg. µ l -1) Samples 0 5 10 15 20 25 30 35
1 2 3 4 5 6 7 8 9 10
29.97 30.64
3.47 28.98
8.25 28
31.98 33.01 32.03 34.88
In ruminants, leptin is synthesised in subcutaneous white adipose tissue as well as in
visceral adipose tissue and brown adipose tissue (Auwerx and Staels, 1998; Chilliard et al.,
2005). In other species, leptin synthesis by the placenta, the skeletal muscle, the gastric and
the mammary epithelium and the brain has also been reported (Ahima and Flier, 2000). It
would therefore be interesting to determine whether leptin gene expression and leptin-receptor gene expression differ between adipose tissues of the body and whether breed-related differences exist.
Kadokawa et al (2003) have shown that dexamethasone and insulin increase leptin gene expression in vitro but that an in vivo injection of dexamethasone did not affect plasma leptin concentration in Holstein multiparous non-lactating cows. In obese humans, leptin
concentrations may be increased by simultaneous high cortisol and insulin levels (Robaczyk
et al., 2002). Accordingly, the exact relation between leptin, cortisol and insulin remains unclear and species-related differences might exist.
It is known that the somatotropic axis, insulin, and leptin play important roles in
regulating the utilization and partition of nutrients (Breier, 1999).
Differences in leptin concentrations were statistically significant at the significance level of P≤ 0.001between Holstein cattle and Slovak pied cattle and at the significance level of P≤0.05 between Slovak pied cattle and Blondaquitan × Pinzgau cattle. Differences in leptin concentrations were not statistically significant between Blondaquitan × Pinzgau cattle and Holstein cattle (P≥0.05).
Tab 1 Summary statistic
Beef cattle N
x
S.D. CV% Minimumμg.μl-1
Maximum
μg.μl-1
HC 10 26.121 10.9179 41.80 3.47 34.88
BPC 10 33.47 6.45159 19.28 16.54 38.33
SPC 10 6.852 2.82556 41.24 3.4 13.18
Total 30 22.1477 13.5171 61.03 3.4 38.33
It has been reported that leptin secretion is highly correlated with body fat mass in
mice (Brockmann et al., 2000), in humans (Ahima and Flier, 2000), and ruminants (Daix et
al., 2008). Investigations in beef cattle support the concept that there is a positive relationship between circulating leptin and intramuscular fat content in cattle. Therefore, a numerically greater plasmaleptin level in German Holstein, in the present study, is consistent with the
higher fat deposition in this cattle breed (Tokuda et al., 1999).
Comparison of fat-related gene expression between the two different cattle breeds will be useful in understanding adipogenic mechanisms. It is not yet clear which genetic alterations in German Holstein and Charolais contribute to the differences in body fatness. It was of considerable interest to determine whether the expression of Ob, LPL, or Ob-Rb genes
varied between dairy and beef cattle (Brockmann et al., 2000).
Plasmaleptin concentrations are positively correlated to fatness or body condition
score in ruminants (Delavaud et al., 2000; Blache et al., 2000; Ehrhardt et al., 2000).
Ren et al. (2002) reported that greater plasma and mRNA leptin levels together with the higher body fat content in German Holstein are observed compared with Charolais cattle.
Chilliard et al. (1998) and Delavaud et al. (2002) have reported that circulating leptin levels are positively correlated with subcutaneous adipose tissue cellularity in cattle.At similar age and live weight, there are differences in adipocyte cellularity among some breeds
in cattle (Hood and Allen, 1973). Therefore, the difference of leptin levels between the
Japanese Black and the Holstein steers observed in this study might be caused partly by the difference of adipocyte cellularity between these breeds.
Carcass tissue production abilities differ between Japanese Blacksteers and
Holsteinsteers (Matsuzaki et al., 1997). Japanese Blacksteers have a higher muscle:bone
ratio than that in Holsteinsteers, and they also have a unique fat deposition pattern
characterized by a large amount of marbling (Zembayashi, 1994). However, the mechanisms
involved in the differences of carcass characteristics, particularly fat accumulation, between these breeds have not been well understood.
There are large differences in fattening or growth potentials among breeds of cattle. Japanese Black cattle are characterized by a unique ability to deposit a greater proportion of
intramuscular lipid than most breeds (Zembayashi, 1994). On the other hand, there were no
Detection of leptin gene by PCR method and Real time PCR method
Detection of leptin gene was used a classic PCR method and realtime PCR method. The amplified PCR products were visualized in 2.8 % gel. The size of PCR product was 94bp. Sequences of primers used for RTQ PCR were the same as for classical PCR. Positive and negative controls were used to correct the reaction.
The resulting DNA concentration was determined by UV-spectrophotometric quantification of DNA.
Picture 1 Analysis of leptin gene in cattle on 2.8 % agarose gel
Size of PCR product 94 bp, 1-3 - Slovak pied cattle, 4-6 – Holstein cattle, 7-8 – Blondaquitan × Pinzgau cattle, L - ladder
CONCLUSION
Classical PCR and RTQ PCR were applied for identification and determination of the leptin gene concentration in cattle. Blood from three breeds of cattle were used as the biological material (10 samples of Slovak pied cattle, 10 samples of Blondaquitan × Pinzgau
cattle and 10 samples of Holstein cattle). The leptin concentration was from 3.4 μg.μl-1 at
Slovak pied cattleto 38.33 μg.μl-1 at Blondaquitan × Pinzgau cattle. Average leptin
concentrations were statistically significant between Holstein cattle and Slovak pied cattle and between Slovak pied cattle and Blondaquitan × Pinzgau cattle.
We recommend detecting leptin also in other breeds of cattle and also in relation to fat and other slaughter indicators.
REFERENCES
AHIMA, R. S. - FLIER, J. S. 2000. Adipose tissue as an endocrine organ. In Trends
Endocrinol. Metab., vol.11, 2000, p. 327–332.
AUWERX, J. - STAELS, B. 1998. Leptin. In Lancet, vol. 351, 1998, p. 737–742.
BLACHE, D. - TELLAM, R. L. - CHAGAS, L. M. - BLACKBERRY, M. A. – VERCOE, P. E. - MARTIN, G. B. 2000. Level of nutrition affects leptin concentrations in plasma, and
cerebrospinal fluid in sheep. In J. Endocrinol., vol. 165, 2000, p. 625–637.
BOCQUIER, F. - BONNET, M. - FAULCONNIER, Y. - GUERRE-MILLO, M. – MARTIN, P. - CHILLIARD, Y. 1998. Effects of photoperiod and feeding level on perirenal adipose
tissue metabolic activity and leptin synthesis in the ovariectomized ewe. In Reprod. Nutr.
Dev., vol. 38, 1998, p. 489–498.
BODEN, G. - CHEN, G. – MOZZOLI, M. - RAYAN, I. 1996. Effect of fasting on
serumleptin in normal human subjects. In J. Clin. Endocrinol. Metab., vol. 81, 1996, p. 3419–
3423.
BONNET, M. - GOURDOU, I. - LEROUX, C. – CHILLIARD, Y. - DJIANE, J. 2002. Leptin expression in the ovine mammary gland: putative sequential involvement of adipose,
epithelial, and myoepithelial cells during pregnancy and lactation. In J. Anim. Sci., vol. 80,
2002, p. 723–728.
BROCKMANN, G. A. - KRATZSCH, J. - HALEY, C. S. - RENNE, U. – SCHWERIN, M. - KARLE, S. 2000. Single QTL effects, epistasis, and pleiotropy account for two-thirds of the
phenotypic F(2) variance of growth and obesity in DU6i × DBA/2 mice. In Genome. Res.,
vol. 10, 2000, p. 1941–1957.
CHELIKANI, P. K. – GLIMM, D. R. – KENNELLY, J. J. 2003. Short communication:
tissue distribution of leptin and leptin receptor mRNA in the bovine. In J. Dairy Sci., vol. 86,
2003, p. 2369–2372.
CHILLIARD, Y. - FERLAY, A. - DELAVAUD, C. - BOCQUIER, F. 1998. Plasmaleptin in underfed or overfed adult Holstein and Charolais cows, and its relationship with adipose
tissue cellularity. In Int. J. Obesity, vol. 22, 1998, p. 171.
CHILLIARD,Y. - BOCQUIER,F. - DELAVAUD,C. - FAULCONNIER,Y. - BONNET, M. - GUERRE-MILO,M. – MARTIN, P. - FERLAY, A. 1999. La leptine chez le ruminant,
facteurs de variation physiologiques et nutritionnels. In INRA Productions Animales, vol.12,
1999, p. 225–237.
CHILLIARD, Y. - BONNET, M. - DELAVAUD, C. - FAULCONNIER, Y. - LEROUX, C. – DJIANE, J. - BOCQUIER, F. 2001. Leptin in ruminant. Gene expression in adipose tissue
and mammary gland, and regulation of plasma concentration. In Domestic Animal
Endocrinology, vol. 21, 2001, p. 271–295.
CHILLIARD, Y. – DELAVAUD, C. - BONNET, M. 2005. Leptin expression in ruminants:
nutritional and physiological regulations in relation with energy metabolism. In Domestic
Animal Endocrinology, vol. 29, 2005, p. 3–22.
CROUCH, J. S. - SMITH, T. R. 2004. Detection and identification of the leptin binding
protein in dairy cattle. In Faseb. J., vol. 18, 2004, p. 1228.
DAIX, M. - PIROTTE, C. - BISTER, J. L. - WERGIFOSSE, F. et al. 2008.Relationship between leptin content, metabolic hormones and fat deposition in three beef cattle breeds. In
DELAVAUD, C. - BOCQUIER, F. - CHILLIARD, Y. - KEISLER, D. H. – GERTLER, A. - KANN, G. 2000. Plasmaleptin determination in ruminants: effect of nutritional status, and
body fatness on plasmaleptin concentration assessed by a specific RIA in sheep. In J.
Endocrinol., vol. 165, 2000, p. 519–526.
DELAVAUD, C. - FERLAY, A. - FAULCONNIER, Y. - BOCQUIER, F. - KANN, G. – CHILLIARD, Y. 2002. Plasma leptin concentration in adult cattle: Effects of breed, adiposity,
feeding level, and meal intake. In J. Anim. Sci., vol. 80, 2002. p. 1317–1328.
DYER, C. J. - SIMMONS, J. M. – MATTERI, R. L. - KEISLER, D. H. 1997.cDNA cloning and tissue-specific gene expression of ovine leptin, NPY-Y1 receptor, and NPY-Y2 receptor. In Domest. Anim. Endocrinol., vol. 14, 1997, p. 295–303.
EHRHARDT, R. A. - SLEPETIS, R. M. - SIEGAL-WILLOTT, J. - VAN AMBURGH, M. E. – BELL, A. W. - BOISCLAIR, Y. R. 2000. Development of a specific radioimmunoassay to
measure physiological changes of circulating leptin in cattle, and sheep. In J. Endocrinol., vol.
166, 2000, p. 519–528.
GARCIA, M. R. - AMSTALDEN, M. - WILLIAMS, S. W. - STANKO, R. L. – MORRISON, C. D. – KEISLER, D. H. et al. 2002.Serum leptin and its adipose gene expression during pubertal development, the estrous cycle, and different seasons in cattle. In
J. Anim. Sci., vol. 80, 2002, p. 2158–2167.
GEARY, T. W. – McFADIN, E. L. – MACNEIL, M. D. – GRINGS, E. E. et al. 2003.Leptin
as a predictor of carcass composition in beef cattle. In J. Anim. Sci., vol. 81, 2003, p. 1-8.
HIGASHIYAMA, Y. - ABE, H. – HAYASHI, M. - HODATE, K. 2003. The comparison of plasma level and mRNA expression of leptin from Japanese Black steers and Holstein steers. In Livestock Production Science, vol. 81, 2003, p. 247–255.
HILL, R. A. - MARGETIC, S. – PEGG, G. G. - GAZZOLA, C. 1998. Leptin: its
pharmacokinetics and tissue distribution. In J. Obes. Relat. Metab. Disord., vol. 22, 1998, p.
HOLNESS, M. J. – MUNNS, M. J. - SUGDEN, M. C. 1999. Current concepts concerning
the role of leptin in reproductive function. In Molecular and Cellular Endocrinology, vol.
157, 1999, p. 11–20.
HOOD, R. L. - ALLEN, C. E. 1973. Cellularity of bovineadipose tissue. In J. Lipid Res., vol.
14, 1973, p. 605–610.
HOUSEKNECHT, K. L. - PORTOCARRERO, C. P. 1998. Leptin and its receptors:
regulators of whole-body energy homeostasis. In Domestic Animal Endocrinology, vol. 15
1998, p. 457–475.
HUAN,J.N. - LI,J. - HAN,Y. - CHEN,K. – WU, N. - ZHAO,A.Z. 2003.Adipocyte-selective reduction of the leptin receptors induced by antisense RNA leads to increased adiposity,
dyslipidemia, and insulin resistance. In J Biol. Chem., vol., 278, 2003, p. 45638–45650.
JI, S. - WILLIS, G. M. - SCOTT, R. R. – SPURLOCK, M. E. 1998. Partial cloning and
expression of the bovine leptin gene. In Anim. Biotechnol., vol. 9, 1998, p. 1–4.
KADOKAWA,H. - BRIEGEL,J.R. - BLACKBERRY,M.A. - BLACHE,D. –MARTIN, G.B. - ADAMS,N.R. 2003. Relationships between plasma concentrations of leptin and other
metabolic hormones in GH-transgenic sheep infused with glucose. In Domestic Animal
Endocrinology, vol.24, 2003, p. 219–229.
KAWAKITA, Y. - ABE, H. - HODATE, K. - IGUCHI, A. - KOBAYASHI, M. - MORI, T. - KASAI, K. - TANAI, Y. – KANBE, Y. - MASHIYAMA, H. 2001. The relation between
plasma leptin concentrations and carcass lipid contents in Japanese Black steers. In Livestock
Production Science, vol. 73, 2001, p. 25–34.
KOLACZYNSKI, J. W. - NYCE, M. R. - CONSIDINE, R. V. - BODEN, G. - NOLAN, J. J. - HENRY, R. - MUDALIAR, S. R. – OLEFSKY, J. - CARO, J. F. 1996a. Acute, and chronic
KOLACZYNSKI, J. W. - CONSIDINE, R. V. - OHANNESIAN, J. - MARCO, C. - OPENTANOVA, I. - NYCE, M. R. – MYINT, M. - CARO, J. F. 1996b. Responses of leptin to short-term fasting, and refeeding in humans.A link with ketogenesis but not ketones
themselves. In Diabetes, vol. 45, 1996, p. 1511–1515.
KUMAR, B. - FRANCIS, S. M. - SUTTIE, J. M. - THOMPSON, M. P. 1998. Expression of
obese mRNA in genetically lean and fat selection lines of sheep. In Biochem. Mol. Biol., vol.
120, 1998, p. 543–548.
LARSSON, H. - ELMSTAHL, S. - BERGLUND, G. - AHREN, B. 1998. Evidence for leptin
regulation of food intake in humans. In J. Clin. Endocrinol. Metab., vol. 83, 1998, p. 4382–
4385.
LEURY, B. J. - BAUMGARD, L. H. - BLOCK, S. S. - SEGOALE, N. – EHRHARDT, R. A. – RHOADS, R. P. et al. 2003. Effect of insulin and growth hormone on plasma leptin in
periparturient dairy cows. In Am. J. Physiol. Regul. Integr. Comp. Physiol., vol. 285, 2003, p.
1107–1115.
MARGETIC,S. - GAZZOLA,C. – PEGG, G.G. - HILL,R.A. 2002. Leptin: a review of its
peripheral actions and interactions. In Int. J. Obes. Relat. Metab. Disord, vol.26, 2002, p.
1407–1433.
MATSUZAKI,M. – TAKIZAWA, S. - OGAWA,M. 1997. Plasma insulin, metabolite concentrations, and carcass characteristics of Japanese Black, Japanese Brown, and Holstein
steers. In J. Anim. Sci., vol.75, 1997, p. 3287–3293.
MINTON,J.E. - BINDEL,D.J. - DROUILLARD,J.S. - TITGEMEYER,E.C. – GRIEGER, D.M. - HILL,C.M. 1998. Serum leptin is associated with carcass traits in finishing cattle. In
J. Anim. Sci., vol.76, 1998, p. 231.
PELLEYMOUNTER, M. A. - CULLEN, M. J. - HEALY, D. - HECHT, R. – WINTERS, D. - MCCALEB, M. 1998. Efficacy of exogenous recombinant murineleptin in lean, and obese
REN, M. Q. - WEGNER, J. - BELLMANN, O. - BROCKMANN, G. A. - SCHNEIDER, F. - TEUSCHER, F. - ENDER, K. 2002. Comparing mRNA levels of genes encoding leptin,
leptin receptor, and lipoprotein lipase between dairy and beef cattle. In Domest. Anim.
Endocrinol., vol. 23, 2002, p. 371–381.
ROBACZYK,M.G. 2002. Evaluation of leptin levels in plasma and their reliance on other hormonal factors affecting tissue fat levels in people with various levels of endogenous
cortisol. In Annales Academiae Medical Stetinensis, vol.48, 2002, p. 283–300.
SAMBROOK, J. - FRITSCH, E.F. - MANIATIS, T. 1989.Molecular Cloning: A Laboratory
Manual, vol. I. 2nd edition. Cold Spring Harbor Laboratory Press, 1989. ISBN 0-87969-309-6.
SCHENKEL, F. S. – MILLER, S. P. – YE, X. – MOORE, S. S. et al. 2005. Association of single nucleotide polymorphisms in the leptin gene with carcass and meat quality traits of
beef cattle. In J. Anim. Sci., vol. 83, 2005, p. 2009-2020.
SINHA, M. K. - OPENTANOVA, I. - OHANNESIAN, J. P. - KOLACZYNSKI, J. W. – HEIMAN, M. L. – HALE, J. et al. 1996. Evidence of free and bound leptin in human
circulation. Studies in lean and obese subjects and during short-term fasting. In J. Clin.Invest.,
vol. 98, 1996, p. 1277–1282.
SOUKAS, A. - COHEN, P. – SOCCI, N. D. - FRIEDMAN, J. M. 2000. Leptin-specific
patterns of gene expression in white adipose tissue. In Genes and Development, vol. 14,2000,
p. 963–980.
SWAIN, J. - DUNN, R. L. - MCCONNELL, D. - GONZALES-MARTINEZ, J. - SMITH, G. D. 2004. Direct effects of leptin on mouse reproductive function: regulation of follicular,
oocyte and embryo development. In Biology of Reproduction, vol. 5, 2004, p. 1446–1452.
TOKUDA, T. – MATSUI, T. - YANO, H. 1999. Leptin concentrations in the blood of
TOKUDA,T. – KONO, S. - FUJIWARA,T. 2001. The relationships between leptin and
vitamin A levels in plasma of fattening cattle supplemented with vitamin A. In Anim. Sci.,
vol.73, 2001, p. 433–441.
YONEKURA, S. - KITADE, K. - FURUKAWA, G. - TAKAHASHI, K. – KATSUMATA, N. – KATOH, K. et al. 2002. Effects of aging and weaning on mRNA expression of leptin
and CCK receptors in the calf rumen and abomasum. In Domest. Anim. Endocrinol., vol. 22,
2002, p. 25–35.
YONEKURA,S. - SENOO,T. - KOBAYASHI,Y. - YONEZAWA,T. – KATOH, K. - OBARA,Y. 2003. Effects of acetate and butyrate on the expression of leptin and short-form
leptin receptor in bovine and rat anterior pituitary cells. In Gen. Comp. Endocrinol., vol.133,
2003, p. 165–172.
ZEMBAYASHI,M. 1994. Effects of nutritional planes and breeds on intramuscular-lipid