GENETIC DIVERSITY AMONG Calotropis procera (Aiton) WT Aiton GENOTYPES
ACCORDING TO SEED PHYSIOLOGICAL QUALITY
1ISAIAS VITORINO BATISTA DE ALMEIDA2*, JEAN PIERRE CORDEIRO RAMOS2, WELLISON FILGUEIRAS DUTRA2, RISELANE DE LUCENA ALCÂNTARA BRUNO3, EDNA URSULINO ALVES3
ABSTRACT- Characterizing genetic diversity based on evaluations involving germination and seed vigor, is a
fundamental stage in starting the development of a cultivation system for Calotropis procera. Thus, this study
aimed to estimate genetic diversity among 35 C. procera genotypes based on germination and vigor of seeds
stored for 1 year. The genotypes, which originated from areas in Paraíba (Brazil), where they occur naturally, were collected and stored in March 2014. In order to evaluate the physiological potential of the seeds, two experiments were conducted between March and April 2015. The first involved a propagation test conducted in a germination chamber, while the second involved an emergence test in washed sand, performed in polyethylene trays in a screened environment under uncontrolled conditions. In both experiments, an entirely randomized design was used, with four repetitions of 25 seeds per genotype. The characteristics evaluated were germination, average daily germination, daily germination speed, the speed of germination index, the plantlet vigor index, emergence, the speed of emergence index, total length, and total dry mass. The results showed that
genetic variability exists among the C. procera genotypes for variables involving germination and vigor of
seeds stored for 1 year. Also, emergence, total dry plantlet mass, and germination characteristics contribute
most to the genetic divergence among C. procera genotypes.
Keywords: Silk flowers. Germination. Seed vigor. Genetic variability. Multivariate analysis.
DIVERSIDADE GENÉTICA ENTRE GENÓTIPOS DE Calotropis procera (Aiton) WT Aiton EM
FUNÇÃO DA QUALIDADE FISIOLÓGICA DAS SEMENTES
RESUMO - A caracterização da diversidade genética, com base na avaliação da germinação e do vigor de
sementes, é uma etapa fundamental para dar inicio ao desenvolvimento do sistema de cultivo de C. procera.
Dessa maneira, objetivou-se estimar a divergência genética em genótipos de C. procera baseada na germinação
e no vigor de sementes armazenadas por doze meses. Foram utilizados 35 genótipos, oriundos de áreas de ocorrência natural na Paraíba, coletados e armazenados em março de 2014. Para a avaliação do potencial fisiológico das sementes, foram realizados dois experimentos entre março e abril de 2015. O primeiro constou de um ensaio de germinação conduzido em câmara de germinação, enquanto o segundo, de um ensaio de emergência em areia lavada, realizado em bandejas de polietileno no interior de ambiente de telado em condições não controladas. Em ambos os experimentos foi utilizado o delineamento inteiramente casualizado com quatro repetições de 25 sementes por genótipo. As características avaliadas foram germinação, a germinação média diária, a velocidade diária de germinação, o índice de velocidade de germinação, o tempo médio de germinação, o índice de vigor de plântulas, a emergência, o índice de velocidade de emergência, o
comprimento total e a fitomassa seca total. Entre os genótipos de C. procera existe variabilidade genética para
variáveis de germinação e vigor de sementes armazenadas por um ano. As características de emergência, fitomassa seca total de plântula e germinação são as que mais contribuem para a divergência genética em
genótipos de C. procera.
Palavras-chave: Flor-de-seda. Germinação. Vigor de sementes. Variabilidade genética. Análise multivariada.
____________________ *Corresponding author
1Received for publication in 08/11/2016; accepted in 12/15/2016. Paper extracted from the doctoral thesis of the first author.
INTRODUCTION
The main challenges for agricultural development in semiarid regions include the production and availability of fodder during the dry season. These are directly associated with partial or total losses of herds in the Northeast and can often be attributed to a lack of knowledge or even disuse of vegetal species with high productive potential that could be used in the dry season (ANDRADE et al., 2010).
Conversely, xerophytic plant cultivation arises as an alternative for guaranteeing the production of fodder in years with low precipitation and providing food during the dry period, whether in
the form of hay, silage, or in natura. Among those
plants with the potential to be cultivated in
xerophytic farming, silk flower (Calotropis procera
(Aiton) WT Aiton) has stood out, mainly because it adapts to a wide range of arid and semiarid regions throughout the world, representing an alternative for minimizing the scarcity of animal feed during critical dry periods (MELO et al., 2001; COSTA et al.,
2009). The C. procera species features rigorous
regrowth after cutting, foliar resistance, tolerance to saline soils, is satisfactorily accepted by animals, and is an excellent source of protein for herds (SILVA et al., 2009; ARRUDA et al., 2011). Another attractive characteristic is its ability to provide phytomass throughout the year.
Although numerous studies have determined
the fodder potential of C. procera (LIMA et al.,
2004; ANDRADE et al., 2005; ANDRADE et al., 2008; OLIVEIRA; SOUTO, 2009), Costa et al. (2009) highlighted the need for more studies regarding the way it is produced. In the vegetal
species domestication process, information
concerning seed physiological potential, particularly germination and plantlet growth evaluations, constitutes an initial stage in developing a cultivation system.
Consequently, C. procera seed germination
has been well studied, particularly regarding various
temperatures (SILVA et al., 2009;
OLIVEIRA-BENTO et al., 2013) and substrates
(SILVA et al., 2009; OLIVEIRA-BENTO et al.,
2013), as well as wastewater use (CARVALHO JÚNIOR et al., 2010), and seed storage conditions
(OLIVEIRA-BENTO et al., 2015). However, there is
a lack of published information concerning the physiological potential of its seeds after long storage periods, in particular, characterizing germination variability in the species’ genotypes. Thus, this study
aimed to estimate genetic divergence among C.
procera genotypes, based on germination and the vigor of seeds stored for 1 year.
MATERIAL AND METHODS
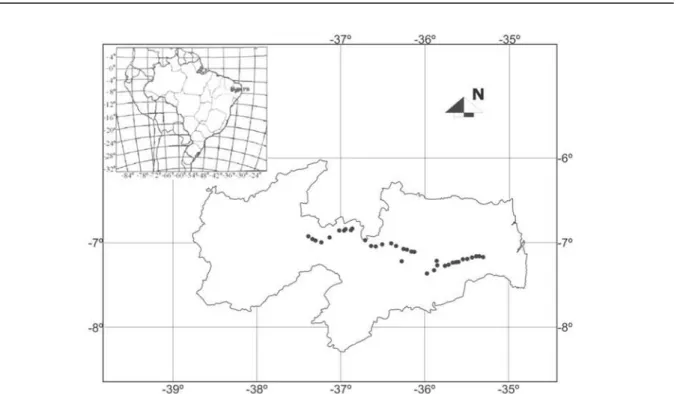
The fruits from a total of 35 C. procera
genotypes were gathered in March 2014 in areas of the State of Paraíba, Brazil, in which the species occurs naturally (Figure 1). The fruits were collected from plants located a minimum distance of 1000 m from each other, and choosing fruits with complete physiological maturity (i.e. open pods and brown seeds). The seeds were extracted manually, exposed to the sun for 8 hours and then stored in paper bags at ambient temperature for 1 year.
Two experiments were conducted between March and April 2015 to evaluate the seeds’ physiological potential. The first was a propagation test conducted in a BOD (biochemical oxygen demand) germination chamber at the Cultivated Plant Ecophysiology Laboratory located at the Três Marias Integrated Research Complex, of Paraíba State University, Campus I, Campina Grande – PB (Brazil). For this, four subsamples of 25 seeds per genotype were spread over two sheets of paper towel
(Germitest®) and covered by another, all previously
wet with distilled water (2.5 g g-1 of paper) and then
rolled up, before they were conditioned in plastic bags and randomly allocated in the interior of a germination chamber for 10 days.
The germination counts were performed
between the 6th and 10th days after sowing, using the
normal plantlet concept described in Rules for Seed
Analysis (BRASIL, 2009). On the 10th day before
ending the experiment, five normal plantlets per repetition were collected at random, which were used to quantify the length (PL1), and, after oven drying at 65 °C for 48 hours, the dry mass (DP1) was quantified.
After gathering the germination, growth, and dry mass data, the germination percentage (GP) (BRASIL, 2009), average daily germination (ADG) (SCOTT; JONES; WILLAMS, 1984), daily speed of
germination (DSG) (HUNTR; GLASBEY;
NAYLOV, 1984), speed of germination index (SGI) (MAGUIRE, 1962), average germination time (AGT) (CARVALHO; CARVALHO, 2009), and
plantlet vigor index (PVI) (MAROUFI;
The emergence counts were conducted
between the 6th and 21st days after sowing. At the end
of the experiment, five plantlets per repetition were evaluated for total length (TL2) and total dry mass (TP2). Once this data was gathered, the final
emergence percentage (EP) on the 21st day after
sowing (BRASIL, 2009), the speed of emergence index (SEI) (MAGUIRE, 1962), and the plantlet vigor index (PVI2) (MAROUFI; FARAHANI; MOAVENI, 2011) were calculated.
The data for the variables were initially analyzed by variance analysis using the F test, followed by a genetic diversity study using Tocher’s optimization method and cluster analysis using the unweighted pair group method with arithmetic mean (UPGMA) hierarchical method, based on the
dissimilarity matrix from Mahalanobis (D2).
Moreover, multivariate and canonical variable analysis was carried out using the GENES software (CRUZ, 2006).
RESULTS AND DISCUSSION
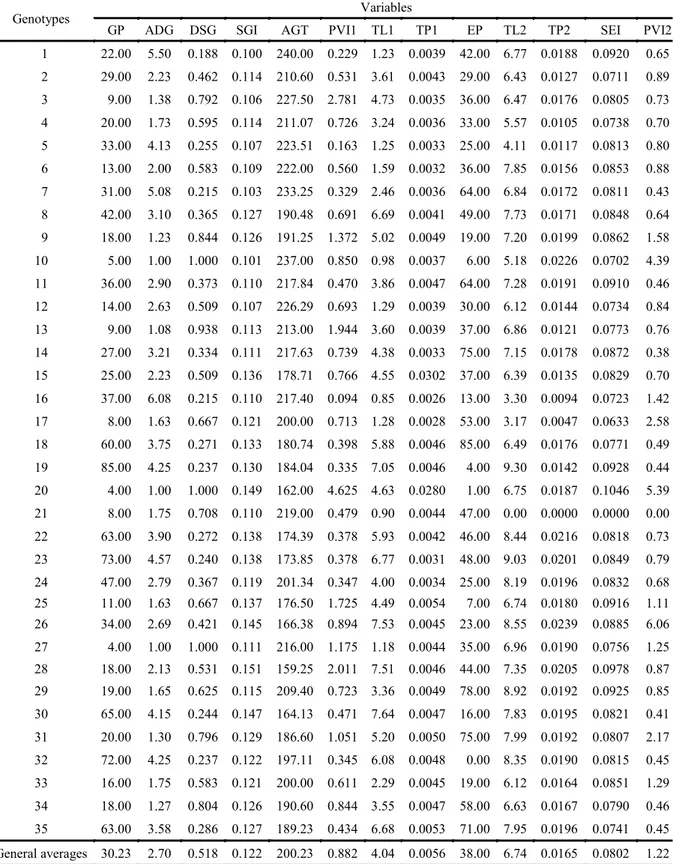
Table 1 shows the average genotypes values and the general averages for the variables related to the two experiments, which were verified as 4.04 cm
(PL1), 0.0056 g (TP1), 30.23% (GP), 2.70 (ADG), 0.51 (DSG), 0.12 (SGI), 200.23 hours (AGT), 0.88 (PVI1), 6.74 cm (PL2), 0.016 g (TP2), 38% (EP), 0.08 (SEI), and 1.22 (PVI2). These values are considered normal, although low, considering the
studies involved C. procera.
In comparison, Silva et al. (2009) and Carvalho Júnior et al. (2010) obtained maximum GPs
of 75 and 90%, respectively, while
Oliveira-Bento et al. (2013) reported 94% GP and an
AGT of 5.60 days. Thus, a reduction in seed physiological potential was observed in this study, which may be related to the storage time. By
evaluating the storage period for C. procera seeds,
Oliveira-Bentoet al. (2015) also verified reductions
in GP, EP, and in the SEI after 180 days storage, which decreased from 95, 42, and 4.12% to a corresponding 80, 38, and 3.94%, respectively.
This information is important as it concerns a species with cultivation potential that is also in the initial phase of domestication. Loss of plantlet vigor is associated with storage time. Furthermore, it is not
recommended that C. procera is stored at ambient
temperature, as the species’ seeds are small, easily permeable, and do not remain dormant, which favors a loss in viability.
Table 1. Average values of the variables including germination (GP) (%), average daily germination (ADG) (% day-1), daily
speed of germination (DSG), speed of germination index (SGI), average germination time (AGT), plantlet vigor index (PVI1), total length (TL1) (cm), total dry mass (TP1) (g), plantlet emergence (EP) (%), total length (TL2) (%), total dry mass (TP2) (g), speed of emergence index (SEI), and plantlet vigor index (PVI2), related to the two experiments with 35 silk flower (Calotropis procera (Aiton) WT Aiton) genotypes.
Genotypes Variables
GP ADG DSG SGI AGT PVI1 TL1 TP1 EP TL2 TP2 SEI PVI2
1 22.00 5.50 0.188 0.100 240.00 0.229 1.23 0.0039 42.00 6.77 0.0188 0.0920 0.65
2 29.00 2.23 0.462 0.114 210.60 0.531 3.61 0.0043 29.00 6.43 0.0127 0.0711 0.89
3 9.00 1.38 0.792 0.106 227.50 2.781 4.73 0.0035 36.00 6.47 0.0176 0.0805 0.73
4 20.00 1.73 0.595 0.114 211.07 0.726 3.24 0.0036 33.00 5.57 0.0105 0.0738 0.70
5 33.00 4.13 0.255 0.107 223.51 0.163 1.25 0.0033 25.00 4.11 0.0117 0.0813 0.80
6 13.00 2.00 0.583 0.109 222.00 0.560 1.59 0.0032 36.00 7.85 0.0156 0.0853 0.88
7 31.00 5.08 0.215 0.103 233.25 0.329 2.46 0.0036 64.00 6.84 0.0172 0.0811 0.43
8 42.00 3.10 0.365 0.127 190.48 0.691 6.69 0.0041 49.00 7.73 0.0171 0.0848 0.64
9 18.00 1.23 0.844 0.126 191.25 1.372 5.02 0.0049 19.00 7.20 0.0199 0.0862 1.58
10 5.00 1.00 1.000 0.101 237.00 0.850 0.98 0.0037 6.00 5.18 0.0226 0.0702 4.39
11 36.00 2.90 0.373 0.110 217.84 0.470 3.86 0.0047 64.00 7.28 0.0191 0.0910 0.46
12 14.00 2.63 0.509 0.107 226.29 0.693 1.29 0.0039 30.00 6.12 0.0144 0.0734 0.84
13 9.00 1.08 0.938 0.113 213.00 1.944 3.60 0.0039 37.00 6.86 0.0121 0.0773 0.76
14 27.00 3.21 0.334 0.111 217.63 0.739 4.38 0.0033 75.00 7.15 0.0178 0.0872 0.38
15 25.00 2.23 0.509 0.136 178.71 0.766 4.55 0.0302 37.00 6.39 0.0135 0.0829 0.70
16 37.00 6.08 0.215 0.110 217.40 0.094 0.85 0.0026 13.00 3.30 0.0094 0.0723 1.42
17 8.00 1.63 0.667 0.121 200.00 0.713 1.28 0.0028 53.00 3.17 0.0047 0.0633 2.58
18 60.00 3.75 0.271 0.133 180.74 0.398 5.88 0.0046 85.00 6.49 0.0176 0.0771 0.49
19 85.00 4.25 0.237 0.130 184.04 0.335 7.05 0.0046 4.00 9.30 0.0142 0.0928 0.44
20 4.00 1.00 1.000 0.149 162.00 4.625 4.63 0.0280 1.00 6.75 0.0187 0.1046 5.39
21 8.00 1.75 0.708 0.110 219.00 0.479 0.90 0.0044 47.00 0.00 0.0000 0.0000 0.00
22 63.00 3.90 0.272 0.138 174.39 0.378 5.93 0.0042 46.00 8.44 0.0216 0.0818 0.73
23 73.00 4.57 0.240 0.138 173.85 0.378 6.77 0.0031 48.00 9.03 0.0201 0.0849 0.79
24 47.00 2.79 0.367 0.119 201.34 0.347 4.00 0.0034 25.00 8.19 0.0196 0.0832 0.68
25 11.00 1.63 0.667 0.137 176.50 1.725 4.49 0.0054 7.00 6.74 0.0180 0.0916 1.11
26 34.00 2.69 0.421 0.145 166.38 0.894 7.53 0.0045 23.00 8.55 0.0239 0.0885 6.06
27 4.00 1.00 1.000 0.111 216.00 1.175 1.18 0.0044 35.00 6.96 0.0190 0.0756 1.25
28 18.00 2.13 0.531 0.151 159.25 2.011 7.51 0.0046 44.00 7.35 0.0205 0.0978 0.87
29 19.00 1.65 0.625 0.115 209.40 0.723 3.36 0.0049 78.00 8.92 0.0192 0.0925 0.85
30 65.00 4.15 0.244 0.147 164.13 0.471 7.64 0.0047 16.00 7.83 0.0195 0.0821 0.41
31 20.00 1.30 0.796 0.129 186.60 1.051 5.20 0.0050 75.00 7.99 0.0192 0.0807 2.17
32 72.00 4.25 0.237 0.122 197.11 0.345 6.08 0.0048 0.00 8.35 0.0190 0.0815 0.45
33 16.00 1.75 0.583 0.121 200.00 0.611 2.29 0.0045 19.00 6.12 0.0164 0.0851 1.29
34 18.00 1.27 0.804 0.126 190.60 0.844 3.55 0.0047 58.00 6.63 0.0167 0.0790 0.46
35 63.00 3.58 0.286 0.127 189.23 0.434 6.68 0.0053 71.00 7.95 0.0196 0.0741 0.45
The cluster analysis for the 35 genotypes using Tocher’s method resulted in the formation of four distinct groups (Table 2). The first group included 68.57% of the genotypes (24), with the average values for GP, PL1, PL2, TP1 and TP2, which are considered important characteristics for crop improvement, lower than the general values. The second group consisted of eight genotypes, which unlike group 1, had higher average values for GP, PL1, PL2, TP1, TP2, and AGT than the general averages, indicating that they are genotypes with the
potential for improving C. procera. The third group
had only two genotypes (15 and 20), which had lower AGT and consequently, higher PVI1 and PVI2,
particularly genotype 20, which qualifies them as individuals with potential for interbreeding. However, new evaluations should be conducted under field conditions to verify their respective productive potentials.
The fourth group comprised only genotype 21, which due to its value as a genetic resource, should be the target of more research to prove whether or not it can be used in improvement programs. Selecting genotypes with cultivation potential aims to obtain plants with improved characteristics, namely greater germinative potential and seed vigor.
Table 2. Clustering of 35 silk flower (Calotropis procera (Aiton) WT Aiton) genotypes using the Tocher method.
With the aim of observing the dissimilarity
between the “inter- and intragroup” individuals in
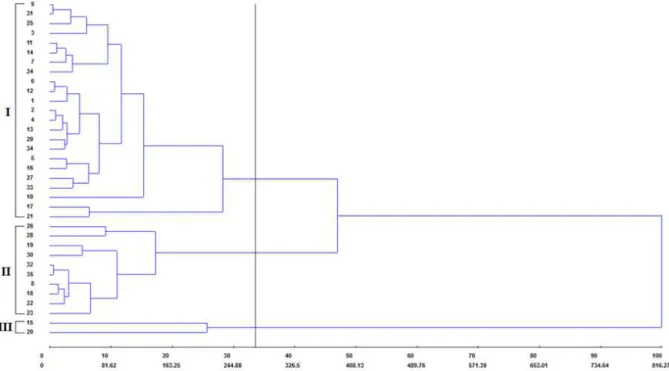
more detail, clustering was done using the UPGMA method. Accordingly, a tree diagram (dendrogram) could be visualized, along with its respective connection points, allowing to holistically estimate the genetic diversity among the genotypes (Figure 2).
The UPGMA method was able to significantly represent the genetic diversity existing among the genotypes, with a satisfactory cophenetic
correlation coefficient (CCC) (0.7648). This index indicates the degree of distortion, with regards to the representation of similarity between individuals in a dendrogram, in which values close to the unit represent little distortion. According to Rohlf (1970), a CCC less than 0.7 indicates that mismatching has occurred in the genotype cluster, namely, real genetic diversity is not reliably represented in the
two-dimensional array.
Figure 2. Dendrogram obtained using the UPGMA hierarchical clustering method, based on the dissimilarity matrix (D²) for 35 silk flower (Calotropis procera (Aiton) WT Aiton) genotypes. The cophenetic correlation coefficient was 0.7648. Selection criterion based on a dissimilarity index of 274.05.
Groups Genotypes
1 9 31 25 2 4 13 29 34 6 33 12 5 1 7 11 24 3 14 10 16 27 17 8 18 2 32 35 22 23 19 30 28 26
3 15 20
The level of dissimilarity cut-off point of 274.05 using the Mojena criterion (MOJENA, 1977) corresponded to approximately 33% of total dissimilarity, which enabled three groups to be formed. Unlike the results observed using the Tocher clustering method, genotype 21 remained in group 1, while genotypes 8 and 18 were included in group 2. However, group 3 was similar in both cluster methods and contained genotypes 15 and 20, for which the greatest divergence was found in relation to the others, given the high genetic distance observed (Figure 2). Genotype 20 was responsible for high PVI1, PVI2, and low AGT, which shows considerable potential for possible interbreeding, as a way of improving the seed vigor of new generations.
The selection of genotypes with seeds showing improved germinative potential and plantlet
growth, particularly after 1-year storage, is indicated
for future genetic improvement programs focusing on agricultural use. This conclusion is based on the success of the next steps in the evaluation of species growth, such as the morphophysiological or even molecular descriptors, which mainly depend on initial plant development. These variables are also important in identifying promising genotypes,
particularly non-domesticated species, such as silk
flower, given that this is an important stage in their domestication. However, despite the importance of
germination and emergence variables, in future studies, the same materials need to be evaluated, considering the whole phenological cycle of genotypes.
When genetic diversity is studied using the canonical variables method, the main aim is to
identify similar genotypes in two- or
three-dimensional scatter plots, which makes it easier
to simplify the interpretation of the results (NEGREIROS et al., 2008). In this paper, the analysis using the canonical variables method significantly represented all of the genetic diversity
existing between the genotypes in a two-dimensional
chart. Thus, the existence of genetic variability between the genotypes evaluated was verified. The first two canonical variables represented 83.04% of the total variation, with 70.36 and 12.67% in the first and second canonical variable, respectively. These values are within the estimate proposed by Cruz and Regazzi (1997), in which the minimum variation estimate contained in the first two canonical variables was 80%.
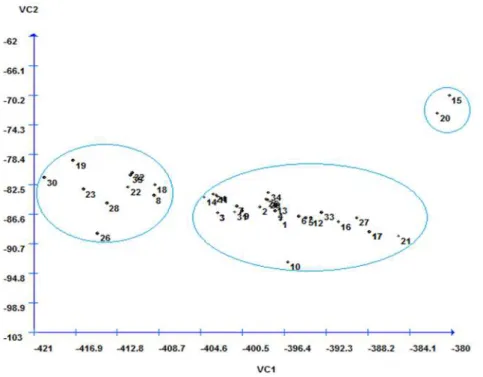
Figure 3 shows the spread of the 35 genotypes, based on the first two canonical variables. In agreement with the UPGMA method, the same three groups were formed, indicating the high potential for these characteristics to represent the genetic diversity among the genotypes studied.
Figure 3. Scatter plot of the 35 silk flower (Calotropis procera (Aiton) WT Aiton) genotypes relative to the first and second canonical variables, established by linearly combining the 13 variables.
Identification of the characteristics that least influenced the differentiation of the genotypes evaluated by the canonical variables was based on isolating the variables that presented the greatest weight in the last eigenvectors. The results allow for
that least influenced the genotype differentiation were AGT > SGI > DSI > PVI2. Therefore, it is proposed that AGT is ignored in future studies.
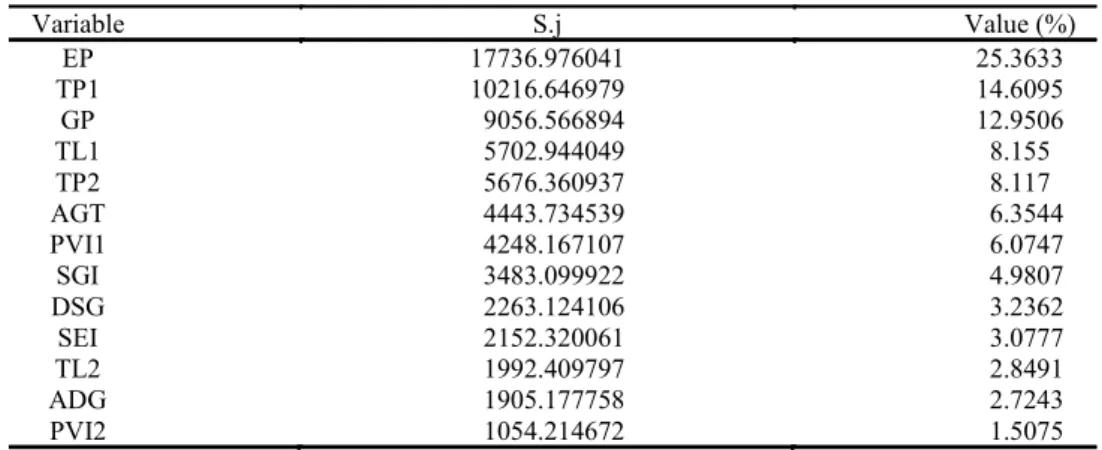
the Mahalanobis (D²) method, it was possible to obtain the Sj values (in which S is the measure of
importance relative to the j variable) for the 13 variables (Table 3). It was observed that the EP,
TP1, and GP variables contributed most to the differentiation of the 35 genotypes, accounting for 52.92% of the total distribution. Hence, EP, TP1, and GP can be considered useful variables in future
studies to evaluate C. procera seed germination,
even after 1-year storage. Furthermore, genotypes
that produced seeds expressing improved EP, TP1,
and GP should be included in future C. procera
improvement programs, as these are essential characteristics for success in cultivation.
Conversely, the PVI2, ADG, and PL2 variables had the lowest Sj estimates and, thus, unimportant in evaluating the general divergence between the silk flower genotypes evaluated. Hence, PVI2, ADG, and PL2 should not be used in future studies.
Table 3. Contribution from the 13 variables that differentiated the 35 silk flower (Calotropis procera (Aiton) WT Aiton) genotypes.
Variable S.j Value (%)
EP 17736.976041 25.3633
TP1 10216.646979 14.6095
GP 9056.566894 12.9506
TL1 5702.944049 8.155
TP2 5676.360937 8.117
AGT 4443.734539 6.3544
PVI1 4248.167107 6.0747
SGI 3483.099922 4.9807
DSG 2263.124106 3.2362
SEI 2152.320061 3.0777
TL2 1992.409797 2.8491
ADG 1905.177758 2.7243
PVI2 1054.214672 1.5075
EP – plantlet emergence; TP1 – total dry mass (experiment 1); GP – germination; TL1 – total length; TP2 – total dry mass (experiment 2); AGT – average germination time; PVI1 – plantlet vigor index; SGI – speed of germination index; DSG – daily speed of germination; SEI – speed of
emergence index; TL2 – total length (experiment 2); ADG – average daily germination; PVI2 – plantlet vigor index (experiment 2).
CONCLUSIONS
Genetic variability exists among the C.
procera genotypes regarding germination and seed vigor variables for seeds stored for 1 year. EP, TP, and GP are the characteristics that contribute most to
genetic divergence among C. procera genotypes.
ACKNOWLEDGMENTS
The authors gratefully acknowledge the Federal University of Parnaíba (UFPB) for funding the study, the Coordination for the Improvement of Higher Education Personnel (CAPES) for conceding the grants, and the Cultivated Plant Ecophysiology Laboratory (ECOLAB) and Embrapa Algodão for providing the physical structure for carrying out the study.
REFERENCES
ANDRADE, A. P. et al. Produção animal no semiárido: o desafio de disponibilizar forragem, em
v. 4, n. 4, p. 1-14, 2010.
ANDRADE, M. V. M. et al. Fenologia da Calotropis
procera Ait. R. Br., em função do sistema e da
densidade de plantio. Archivos de Zootecnia,
Córdoba, v. 54, n. 208, p. 631-634, 2005.
ANDRADE, M. V. M. et al. Produtividade e
qualidade da flor-de-seda em diferentes densidades e
sistemas de plantio. Revista Brasileira de
Zootecnia, Piracicaba, v. 37, n. 1, p. 1-8, 2008.
ARRUDA, A. M. V. et al. Avaliação nutricional do
feno de flor-de-seda com aves caipiras. Acta
Veterinaria Brasilica, Mossoró, v. 5, n. 3, p. 311-316, 2011.
BRASIL. Ministério da Agricultura, Pecuária e
Abastecimento. Regras para análise de sementes.
Ministério da Agricultura, Pecuária e Abastecimento. Secretaria de Defesa Agropecuária, Brasília: MAPA/ ACS, 2009. 395 p.
CARVALHO, R. I. N.; CARVALHO, D. B. Germinação de sementes de um ecótipo de paspalum
CARVALHO JÚNIOR, S. B. et al. Produção e avaliação bromatológica de espécies forrageiras
irrigadas com água salina. Revista Brasileira de
Engenharia Agrícola e Ambiental, Campina
Grande, v. 14, n. 10, p. 1045-1051, 2010.
COSTA, R. G. et al. Perspectivas de utilização da
flor-de-seda (Calotropis procera) na produção
animal. Revista Caatinga, Mossoró, v. 22, n. 1, p.
1-9, 2009.
CRUZ, C. D. Programa GENES: análise
multivariada e simulação. Viçosa, MG: UFV, 2006. 175 p.
CRUZ, C. D.; REGAZZI, A. J. Modelos
biométricos aplicados ao melhoramento genético. Viçosa, MG: UFV, 1997. 390 p.
HUNTR, E. A.; GLASBEY, C. A.; NAYLOV, R. E. L. The analysis of data from germination tests. Journal of Agricultural Science, Cambridge, v.
102, n. 1, p. 207-213, 1984.
LIMA, G. F. C. et al. Flor de seda: fonte de feno de
qualidade para os sertões. In:______.
Armazenamento de Forragens para Agricultura Familiar. Natal, RN: EMPARN, 2004. 40 p.
MAGUIRE, J. D. Seed of germination aid in selection and evaluation for seedling emergence and
vigor. Crop Science, Madison, v. 2, n. 2, p. 176-177,
1962.
MAROUFI, K.; FARAHANI, H.A.; MOAVENI, P. Effects of hydropriming on seedling vigour in
spinach (Spinacia oleracea L.). Advances in
Environmental Biology, New Delhiv, v. 5, n. 8, p.
2224-2227, 2011.
MELO, M. M. et al. Estudo fitoquímico da Calotropis procera Ait. sua utilização na alimentação de caprinos: efeitos clínicos e
bioquímicos séricos. Revista Brasileira de Saúde e
Produção Animal, Salvador, v. 2, n. 1, p. 15-20, 2001.
MOJENA R. Hierarchical grouping methods and
stopping rules: an evaluation. The Computer
Journal, Oxford, v. 20, n. 4, p. 359-363, 1977.
NEGREIROS, J. R. S. et al. Divergência genética
entre progênies de maracujazeiro-amarelo com base
em características das plântulas. Revista Brasileira
de Fruticultura, Jaboticabal, v. 30, n. 1, p. 197-201, 2008.
OLIVEIRA-BENTO, S. R. S. et al. Biometria de
Uberlândia, v. 29, n. 5, p. 1194-1205, 2013.
OLIVEIRA-BENTO, S. R. S. et al. Armazenamento
de sementes de flor-de-seda [Calotropis procera
(Aiton) W.T. Aiton]. Revista Caatinga, Mossoró, v.
28, n. 1, p. 39-47, 2015.
OLIVEIRA, V. M.; SOUTO, J. S. Estimativa da
produção de biomassa de Calotropis procera (Ait)
R. BR. e avaliação de sua composição química no
estado da Paraíba. Revista Verde de Agroecologia e
Desenvolvimento Sustentável, Pombal, v. 4, n. 1, p. 141-161, 2009.
ROHLF, F. J. Adaptative hierarchical clustering
schemes. Systematic Zoology, Oxford, v. 19, n. 1, p.
58-82, 1970.
SILVA, J. R. et al. Temperatura e substrato na
germinação de sementes de flor-de-seda. Revista
Caatinga, Mossoró, v. 22, n. 1, p. 175-179, 2009.
SINGH, D. The relative importance of characters
affecting genetic divergence. The Indian Journal of
Genetics e Plant Breeding, New Delhi, v. 41, n. 2,
p. 237-245, 1981.
SCOTT, S. J.; JONES, R. A.; WILLAMS, W. A. Review of data analysis methods for seed
germination. Crop Science, Madison,v. 24, n. 6, p.