SELECTED BY MIXED MODELS
Diversidade genética em genótipos de Cedro Australiano selecionados via modelos mistos
Rulfe Tavares1, Alexandre Pio Viana2, Deborah Guerra Barroso1, Antonio Teixeira do Amaral Júnior1
ABSTRACT
The increasing demand for raw material for multiple uses of forest products and by-products has attracted the interest for fast growing species, such as the Australian Cedar (Toona ciliata), which presents high productive and economic potential. The present
work aimed at estimating genetic diversity by DNA markers and morphological traits supported for the mixed models. The following traits were measured and genotypes were sampled randomly in different areas: diameter at breast height, height, cylindrical volume, diameter, distance between nodes and crown diameter. Twelve RAPD primers were used and generated a total of 91 marks, 82 of which were polymorphic. The high percentage of polymorphic markers, 90.10%, demonstrated that discrimination in this species is efficient, but it yet little studied, for this case we can find the extent of the genetic basis for the application of technical improvement. The assessment of genetic diversity by the UPGMA method using the binary and morphological data provided the expression of genetic dissimilarities among the accessions evaluated, optimizing the perception of this divergence. The use of mixed models was efficient to assess combined genetic diversity to optimize the selection of genotypes with divergent genetic values for diameter at breast height.
Index terms: Molecular markers, genetic values, woody plant.
RESUMO
A crescente demanda por matéria-prima para múltiplos usos dos produtos florestais e subprodutos tem despertado o interesse para espécies de crescimento rápido, como o cedro australiano (Toona ciliata), que apresenta potencial produtivo e econômico. Neste trabalho, objetivou-se estimar a diversidade genética por marcadores de DNA e caracteres morfológicos com o uso dos modelos mistos. Os seguintes caracteres foram medidos e os genótipos foram amostrados aleatoriamente em diferentes áreas de plantio: diâmetro à altura do peito, altura, volume cilíndrico, distância entre nós e diâmetro de copa. Doze primers RAPD foram utilizados e geraram um total de 91 marcas, dos quais 82 foram polimórficas. A alta porcentagem de marcadores polimórficos, 90,10%, demonstrou que a discriminação nessa espécie é eficiente, mas ainda pouco estudada, para esse caso, podemos encontrar alta diversidade genética para aplicação em programas de melhoramento. A avaliação da diversidade genética pelo método UPGMA, utilizando os dados binários e morfológicas, foi eficiente em discriminar a diversidade presente entre os genótipos avaliados, otimizando a percepção dessa divergência. O uso de modelos mistos foi eficiente para avaliar a diversidade genética combinada para otimizar a seleção de genótipos com diferentes valores genéticos para o diâmetro à altura do peito.
Termos para indexação: Marcadores moleculares, valores genéticos, planta lenhosa.
(Received in november 16, 2011 and approved in april 19, 2012)
1Universidade Estadual do Norte Fluminense Darcy Ribeiro/UENF – Centro de Ciências e Tecnologias Agropecuárias/CCTA – Campos dos Goytacazes –
RJ – Brasil
2Universidade Estadual do Norte Fluminense Darcy Ribeiro/UENF – Centro de Ciências e Tecnologias Agropecuárias/CCTA – Avenida Alberto Lamego –
2000 – 28015-610 – Campos dos Goytacazes – RJ – Brasil – [email protected]
INTRODUCTION
There is an increasing search for new species with high economic and productive potential to meet the growing demand for forest products as a source of raw materials for industries of the sector. Noce et al. (2003) report promising prospects of this business in domestic and foreign markets, since world consumption of forest products has presented average annual growth rates of around 1.5% in recent years. Australian Cedar or Toona ciliata is an exotic species that found favorable conditions for its development in Brazil. It is a good alternative to the forestry
sector for presenting good quality wood and great acceptance around the world for noble uses, such as furniture manufacturing and finishing in civil construction (LORENZI et al., 2003, PINHEIRO et al., 2003).
Knowledge about genetic diversity in the group of par en ts is n eeded t o iden tify th e h ybr id combinations of higher heterotic effect, thus increasing the chance of emergence of superior genotypes in segregating generations. However, this approach has been little used in association with the estimation of genetic values via mixed models (REML/BLUP) for the species under study.
The degree of genetic diversity between parents, expressed by the dissimilarity measures is fundamental for the selection of the genotypes to be used as parents, since genetic divergence between parents indicates heterotic expression in progenies (FALCONER, 1987). However, there are few related studies on forest species, such as Toona ciliata (Australian cedar), whose cultivation has increased considerably in recent years. The access to improved seeds and alternatives for more productive genotypes is also scarce.
Multivariate techniques and approaches have been successfully used in other species of perennial plants in studies on genetic diversity in populations. These techniques are used to characterize the genetic structure of the individuals sampled, also being employed as a criteria and indicators for the selection of genotypes promising for use in breeding programs and in the conservation of the germplasm of these species (VIANA et al., 2006, SILVA, et al. 2009, GAGO et al. 2009).
Molecular markers reveal genotypic differences between individuals by means of techniques for the identification of genetic polymorphisms at DNA level. One of them is the PCR-RAPD technique, which does not require prior knowledge about the basis of the DNA markers available for the species under study. It is simple, fast and inexpensive. The technique uses synthetic oligonucleotides to amplify DNA polymorphic regions randomly identified, showing the genetic differences between individuals (WILLIAMS et al., 1990). This technique has been successfully employed in the study on genetic diversity by several authors, including the results of Viana et al. (2003) in yellow passion fruit; Sawazaki et al. (1998) in palm trees of the genera Euterpe, Bactris, Elaeis and Syagrus; Martinello et al. (2003), in species of okra; and Sudré et al. (2005) in pepper and paprika.
This work aimed to study genetic divergence among 90 genotypes of Toona ciliata, based on morphoagronomic data and on 31 genotypes selected through the application of mixed models, using molecular and morphoagronomic data in an attempt to select the
most productive and divergent ones to start a breeding program for the species.
MATERIAL AND METHODS Plant Material
Ninety-one genotypes collected from different growing regions in the state of Rio de Janeiro were sampled for diversity analysis. Out of these genotypes, 90 were Australian Cedar and one was Pink Cedar (Cedrela fissilis.), in an attempt to place a reference in the analyses of markers.
The introduction of genotypes was performed with seedlings produced in plantations in the districts of Triunfo-RJ, coded with the letter E (seeds from Viana-ES) and Alto-Imbé-RJ, coded with the letter Z (seeds from Viçosa -MG), in the municipality of Santa Maria Madalena-RJ and in the municipality of Trajano de Moraes-Madalena-RJ, coded with the letter P (seeds from Viçosa-MG).
Phenotypic characterization
Measurements were carried out using a stem caliper and a graduated rod in three different seasons for the phenotypic evaluation of the genotypes sampled. The following traits were assessed: a) Diameter at breast height(DBH), measured in centimeters (cm) and taken at 1.30 m from the base of the trunk. b) Height (H), measured in meters (m) from the base of the plants, c) Cylindrical Volume (CV), estimated indirectly by the equation π/4 x DAP2 x H, using the measurements of traits mentioned in the equation, which were previously obtained. d) Stem diameter (SD), in centimeters (cm), taken at the base of the plants. e) Distance between nodes (DBN) The distance between nodes, in centimeters (cm), was defined as a weighted average of the distances between the three nodes immediately over the height of 1.30 m from the base of the trunk. f) Canopy diameter (D Canopy), in centimeters (cm), taken at the height of the branches and estimated by digital images obtained from the base of plants, focusing on the canopy. The images were obtained by digital camera with resolution of 4.1 mega pixels. Each individual was photographed in two different positions, which alllowed the measurement of this trait by image analysis performed through the Imagej software system.
Molecular characterization
assessed by visual comparisons of fluorescence intensity of the bands in 0.8% agarose gel stained with ethidium bromide, with known concentrations of phage Lambda DNA (Gibco), under ultraviolet light, diluted with ultrapure water and standardized by 5 ng.μL-1.
Twelve primers belonging to the Operon Technologies series (Table 1) were used. The amplification reactions were performed with a volume of 20 μL, containing 20 ng of genomic DNA; 50 mM KCl; 10 mM Tris-HCl (pH 8.8); 0.1% Triton-X; 1.5 mM MgCl2; 100 μM of each dNTPs, 0.2 μM of each primer and 0.5 units of Taq polymerase (Invitrogen).
The amplifications were carried out in thermocycler, PTC 100 model (MJ Research). The amplification conditions were based on the TD60 program (1 cycle at 94° C for 5 min; 8 cycles of 94° C for 40 seconds, 60° C - 0.5° C per cycle for 40 seconds and 72° C for 50s; 24 cycles of 94° C for 40s, 56° C for 40 seconds, 72° C for 50s; 1 cycle of 72° C for 5 min). The amplification products were encoded in a binary matrix to estimate the genetic distances based on DNA markers.
Statistical analysis
The agronomic data were used to study genetic diversity, and to select 31 higher genotypes (for the best values for trait diameter at breast height, the most important trait for the forest species) for the study on diversity through DNA markers. For this study we not use experimental design, all the genotypes were sampled randomly in different areas. These genotypes were selected by mixed models (RESENDE et al., 2000), based on the general model y = Xm + Zg + Wi +
e, where y is the data vector; m is the vector of the effects of the combinations-local measurements (assumed to be fixed) added to the general average; g is the vector of the genotypic effects added to the vector of the permanent environmental effects (assumed to be random); i is the vector of the effects of the genotype x measurement interaction; and e is the vector of errors or waste (random). The vector m comprises all measurements at all sites and adjusts simultaneously for the effects of location, measurement and location x measurement interaction. After these estimates, the genetic values were predicted and the genotypes were selected based on the highest values for the variable DBH and from the prediction of genotype values according to the model were estimated values of the harmonic mean of the relative performance of the breeding values (MHVG) for all genotypes, second procedure described by Oliveira et al (2005). The genetic distance matrix was estimated for these 31 genotypes by the Jaccard index. The Unweighted Pair Group Method with Arithmetic Mean (UPGMA) clustering method was applied to form the dendrogram of their dispersion.
For the study on genetic diversity among the 90 genotypes sampled from different regions, based on agronomic variables, the genetic distances between genotypes were estimated through the standardized average Euclidean distance using all the traits, using the UPGMA method to form the divergent groups, with the cutoff calculation as mean distance + KSD (SD= standard deviation of the distances with K=1.25). The contribution of all the traits for genetic diversity was estimated by the Principal Components technique, Table 1 – Ratio between the number of products amplified by primers and their respective percentage of polymorphism.
Primers Number of amplified products Number of polymorphic fragments Percentage of polymorphism
A1 6 6 100
A3 10 10 100
A10 12 12 100
AC7 8 6 75
AC20 7 5 71
AF16 5 4 80
AW15 9 7 78
B17 9 9 100
C11 3 3 100
C13 5 5 100
V6 6 6 100
these values. One genotype of Cedrela fissilis was added to the genotypes of Australian cedar with the purpose of correctly allocating them in the diagrams formed (Figure 1).
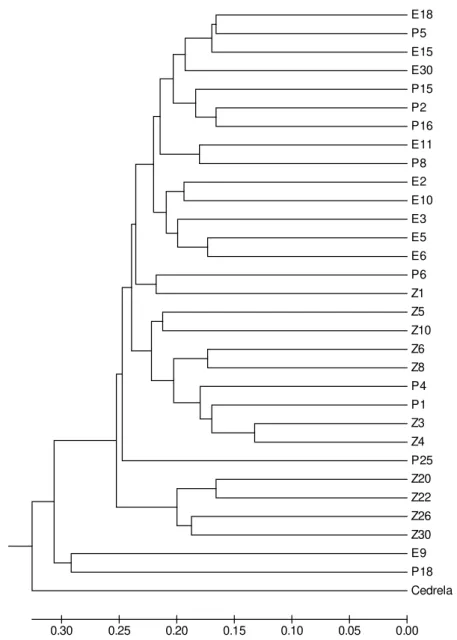
The dendrograms were obtained from amplification products by RAPD, via arithmetic complement of the Jaccard index, using the UPGMA method. Eight groups were formed, as shown in figure 1. The first group was formed by the genotypes E18, P5, E15, E30, P15, P2, P16, E11, P8, E2, E10, E3, E5 and E6, which are from two different places. The individuals P2, P5, P8, P15 and P16, ie, 35% of the genotypes of this group, come from Trajano de Moraes and the remaining 75%, from Triunfo. In this, individuals that stood out for higher average values for the variable DAP were grouped; the second group contained individuals P6 and Z1 from the same origin; the third grouping is formed by individuals Z5, Z10, Z6, Z8, P4, P1, Z3 and Z4, which account for 25.8% of all genotypes studied, all originating from Viçosa-MG; the fourth group was formed by the individual P25, which is closer to group five, despite having the same origin as the subjects in group three; the fifth group is composed of individuals Z20, Z22, Z26 and Z30, all of which from Alto Imbé; the sixth group was formed by genotype E9; and the group seven, by genotype P18, thus closing the groups, respectively.
It is noteworthy that more than 45.16% of the genotypes were grouped in the first group. Groups 2, 3 and 4 present only individuals of the same origin (Viçosa), which allows to infer that, although divergent, there is some kinship among individuals. The results obtained demonstrate that it is possible to carry out crosses between the genotypes from the group formed by the most divergent genotypes, which have the highest genetic values for the most important variable for forest species breeding.
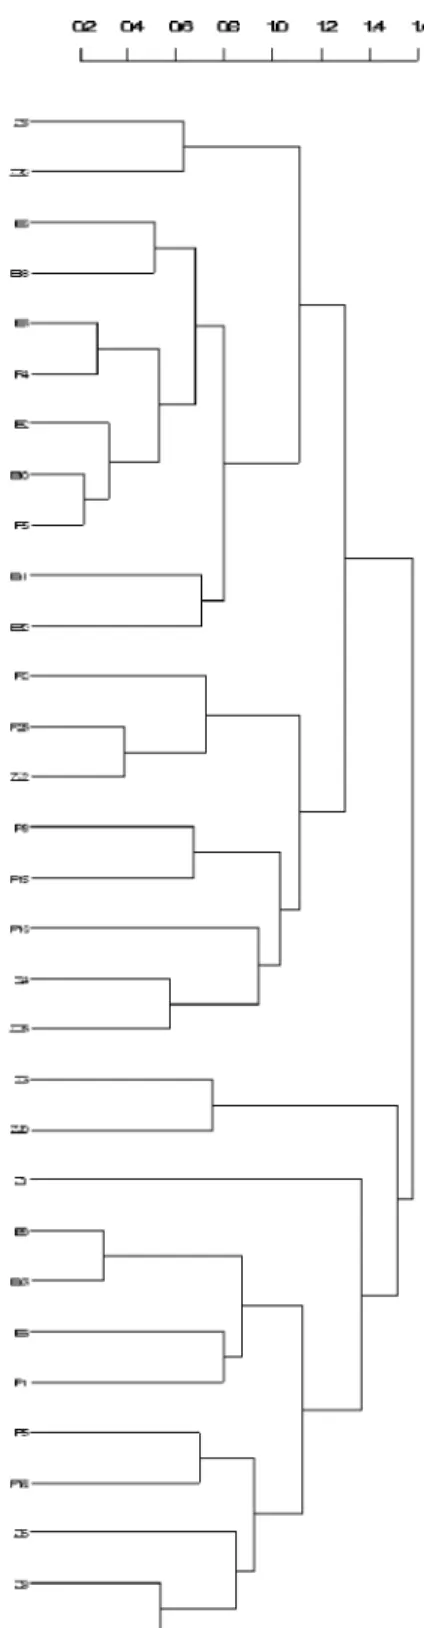
In the second dendrogram (Figure 2), the analysis of agronomic data, using the UPGMA hierarchical method, based on the mean Euclidean distance, clustered the accessions into six different groups, in opposition to what was observed in the molecular analysis.
However, considering the cutoff estimated, the groups formed were consistent, compared to the groups of figure 1. For this case 80% of the members in the first group are from Triunfo, while groups 2 and 3 have only genotypes from Viçosa. These two groups concentrated 72% of the materials of Viçosa and 47% of all the genotypes studied. Group 5 is formed by two individuals from Triunfo and one from Trajano and it remained isolated in the dendrogram of molecular data, but closer to the group formed by genotypes from Triunfo.
using the correlation genetic matrix and all the genotypes. The Pearson Correlation Coefficient between the estimated genetic distance by DNA markers and agronomic data was estimated and tested by T test. The following software’s were used for data analysis: SELEGEM, for the REML/BLUP estimates (RESENDE, 2007); Genes (CRUZ, 2006), developed by the Universidade Federal de Viçosa for the Principal Compon ents an alysis and Pearson Correlation estimates, and to obtain the matrices of distances and grouping analysis; R program - “Project for Statistical Computing”; Mega 4, was used.
RESULTS AND DISCUSSION
The study on genetic diversity was carried out with the use of molecular markers by the RAPD technique, using 12 primers, which generated at least one polymorphic band between the individuals analyzed. The DNA obtained by the extraction process was in good quality, since there was almost no drag in the quantification gels, which indicated low degradation level. Altogether, 91 amplification products were generated (Table 1), with an average of 7.58 bands per ‘primer’, with values ranging from 3 to 12. Out of this total, 82 were polymorphic, i.e., 90.10%. A10 was the primer that presen ted the h igh est n umber of polymorphic bands, namely, twelve bands. On the other hand, C11 allowed the disclosure of only three polymorphic bands.
In order to assess the degree of genetic diversity and to identify duplicate accessions, Vieira and Nodari (2007) evaluated 20 cultivars of Allium sativum L. through RAPD markers. Fifty-seven bands were produced; 35 of which (61.42%) were polymorphic and generated good capacity to estimate the genetic diversity of the populations studied.
Barros et al (2005), in studies using Stylosanthes macrocephala, obtained estimates of the prediction of genetic variability among 87 accessions based on RAPD markers, which allowed differentiation between them, indicating high genetic variability.
Since this species is still in the early domestication process, high polymorphism was expected with a relatively small number of starters, which was confirmed. This fact was corroborated by the report of Zucchi et al (2005), who assessed a native cerrado fruit (Eugenia dysenterica) and stated that it would take 33 loci for the analysis of the population genetic structure of the species. The authors conducted preliminary tests that led to this conclusion, sampling 25 genotypes with 36 RAPD loci, using 7 primers. For the case of markers, the genetic similarity coefficients ranged from 0.41 to 0.94. The shortest
distances were achieved between the individuals Z3 and Z4 which characterized them as the most similar genotypes. However, the results obtained with respect to genetic distance did not refer to traits of economic interest, i.e., the most divergent traits may not be the most productive. However, the selection of genotypes for starting a breeding program must consider not only the divergence of the parents based on molecular markers, but also the deviation from the forest traits of interest, seeking divergent and productive individuals.
E18 P5 E15 E30 P15 P2 P16 E11 P8 E2 E10 E3 E5 E6 P6 Z1 Z5 Z10 Z6 Z8 P4 P1 Z3 Z4 P25 Z20 Z22 Z26 Z30 E9 P18 Cedrela
0.00 0.05
0.10 0.15
0.20 0.25
0.30
It was estimated 0.67** for the correlation between both analysis distances, DNA markers and agronomic data. This demonstrates good potential for used DNA markers with agronomic data association for perennial crops divergence studies.
Based on the similarity dendrogram obtained from morphoagronomic data of the 90 genotypes, by the UPGMA method, it was observed that 15 groups were formed, with a concentration of 63.33% of the genotypes from Triunfo (En) in the first group (Figure 3). Group 9 concentrated 50% of the genotypes from Viçosa and introduced in Alto Imbé. Five groups were formed by a single genotype (Z7; E30; P27; P25; E8 and Z15), while groups 5, 10, 12 and 13 were formed by two genotypes each.
The highest degree of genetic similarity was observed between genotypes E12 and E20, while the lowest genetic similarity was found between genotypes E8 and Z15.
In the dendrogram, the highest similarity was observed among the genotypes belonging to group 1, namely, E1; E2; E4; E5; E6; E7; E10; E11; E12; E13; E16; E17;E20; E21; E22; E23; E24; E25; E29; Z4; Z5 and P5.
This result might be due to the fact that genotypes with “E” code were obtained from seeds from the same location. The low degree of similarity between genotypes from the same origin can be explained by the fact that the population where the seeds were collected is formed by genotypes from different matrices, which could result in the genetic segregation promoted by cross-pollination.
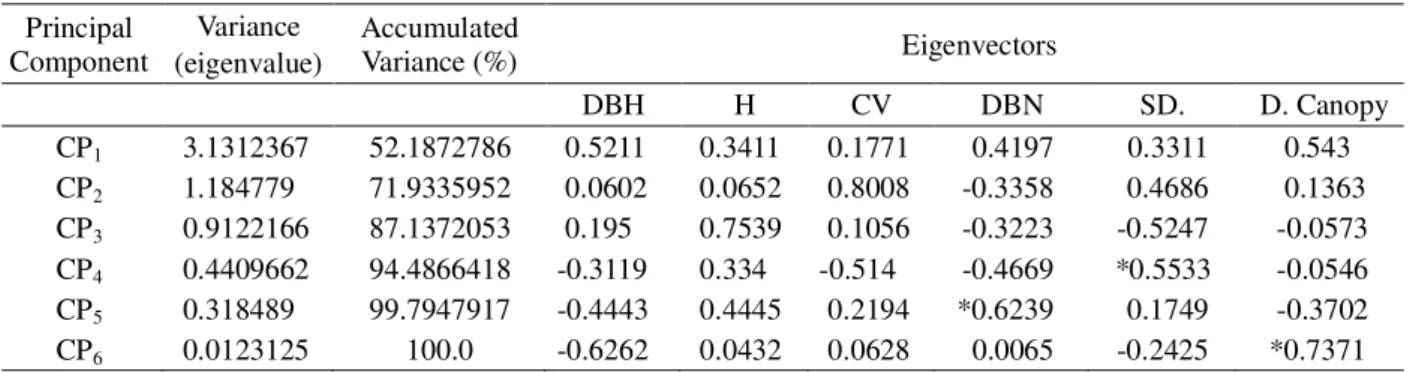
The results obtained by the Principal Components technique highlight the need for two components to explain a minimum of 70% of the variation available, as observed in table 2, and considering the components 1 (DBH, explains 52.18% of the variance) and 2 (VC explains 19.75% of the variation) and, later, the components 1 and 3 (H explains 15.20% of the variance).
Table 2 also allows the identification of the characters distance between nodes (DBN), stem diameter (SD) and canopy diameter (D.Canopy ) as the least important, i.e., they are the variables that contributed less to the differentiation of the genotypes, since they have the highest coefficients of the eigenvectors associated with eigenvalues lower than 0.7 of the correlation matrix.
The identification of genotypes with high productivity and yield stability and wide adaptability to various environments is a key objective of breeding programs for forest species. Therefore, the MHVG method is a breakthrough because it is based on an analysis of genotypic values predicted by the mixed model methodology (VERARDI et al. 2009). Besides, studies on genetic divergence can optimize the information for the composition of a group of crosses to start cross breeding programs via intercrosses of the most divergent genotypes among the highest genetic values. Figure 2 – Dendrogram of similarity distances obtained
E12 E20 E22 Z4 Z5 E4 E21 E23 P5 E1 E25 E7 E11 E13 E24 E5 Z1 E2 E10 E6 E17 E16 E29 Z7 Z2 P16 E26 E28 E27 P8 P9 P18 P24 Z20 P21 P13 Z10 Z18 P15 Z25 Z22 P7 P4 P10 E30 E14 E18 Z30 P11 P28 P22 P23 P30 Z29 P12 P3 P20 P29 P2 E19 Z3 P14 P27 Z24 Z12 Z14 Z16 Z19 P19 Z17 Z21 Z11 Z27 Z13 Z23 Z9 Z8 Z26 P17 Z28 P26 Z6 P6 P25 E3 E9 E15 P1 E8 Z15
0.0 0.2
0.4 0.6
0.8 1.0
CONCLUSIONS
A clear genetic diversity among genotypes was observed, and it can select and predict genetic progress by selection of new individuals with superior characteristics favorable for production of wood and wood products.
All the complex variables of study were important to discriminate the genetic diversity present in the population.
The DNA markers were efficient in discriminating the present diversity and demonstrated potential use associated with agronomic data.
REFERENCES
BARROS, A. M. et al. Variabilidade genética e ecológica de Stylosanthes macrocephala determinadas por RAPD e SIG.Pesquisa Agropecuária Brasileira, Brasília, v.40, n.9, p. 899-909. 2005.
CRUZ, C. D. Programa Genes, Análise multivariada e simulação. Viçosa: UFV, 2006. 175p.
DOYLE, J. J.; DOYLE, J. L. A rapid DNA isolation procedure from small quantities of fresh leaf tissue. Phytochemistry Bulletin, v. 19, p. 11-15, 1987. FALCONER, D. S. Introdução à genética quantitativa. Viçosa: UFV, 1987. p. 279.
GAGO, P. et al. Biodiversity and characterization of twenty-two Vitis vinifera L. cultivars in the northwestern Iberian Peninsula. American Journal of Enology and Viticulture. v. 60, n:3, p.293-301, Set. 2009
LORENZI, H., et al. Árvores Exóticas no Brasil: madeireiras, ornamentais e aromáticas. Nova Odessa: Instituto Plantarum, 2003. 385 p.
MARTINELLO, G.E. et al. Diversidade genética em quiabeiro baseada em marcadores RAPD. Horticultura Brasileira, Brasília, v. 21, n. 1, p. 20-25, mar. 2003. OLIVEIRA, R.A. de. et al. Genotypic evaluation and selection of sugarcane clones in three environments in the state of Paraná. Crop Breeding and Applied Biotechnology, v.5, p.426-434, 2005.
NOCE, R. et al. Desempenho do Brasil nas exportações de madeira serrada.Revista Árvore, Viçosa, v.27, n.5, p. 695-700. Set./out. 2003.
PINHEIRO, A. L.; LANI, L. L.; COUTO, L. Cultura do Cedro Australiano para Produção de Madeira Serrada. Viçosa: UFV, 2003. 42p.
RESENDE, R. M. S.; SIMÔES, R. M.; FERNANDES, J. S. C. Blup individual com medidas repetidas aplicado ao melhoramento de espécies perenes. Ciências e
Agrotecnologia, Lavras. v. 24,n n. 4, p.986-997, out./dez. 2000. RESENDE, M. D. V. Selegen-reml/blup – Sistema
Estatístico e Seleção Genética Computadorizada via Modelos Mistos. Colombo: Embrapa Florestas, 2007, 359p. SAWAZAKI, H. E. et al. Diversidade genética em palmeiras através de isoenzimas e RAPD. Revista Brasileira de Biologia, Rio de Janeiro, v. 58, n. 4, p. 681-691, Nov. 1998.
Table 2 – Estimates of eigenvalues and eigenvectors obtained by principal component analysis between the characters diameter at breast height (DBH), height (H), cylindrical volume (CV), distance between nodes (DBN), stem diameter (SD) and canopy diameter ( D.Canopy ), evaluated in genotypes of Toona ciliata (Australian cedar).
Principal
Component (eigenvalue) Variance
Accumulated
Variance (%) Eigenvectors
DBH H CV DBN SD. D. Canopy
CP1 3.1312367 52.1872786 0.5211 0.3411 0.1771 0.4197 0.3311 0.543
CP2 1.184779 71.9335952 0.0602 0.0652 0.8008 -0.3358 0.4686 0.1363
CP3 0.9122166 87.1372053 0.195 0.7539 0.1056 -0.3223 -0.5247 -0.0573
CP4 0.4409662 94.4866418 -0.3119 0.334 -0.514 -0.4669 *0.5533 -0.0546
CP5 0.318489 99.7947917 -0.4443 0.4445 0.2194 *0.6239 0.1749 -0.3702
CP6 0.0123125 100.0 -0.6262 0.0432 0.0628 0.0065 -0.2425 *0.7371
SILVA, E. F.; MARTINS, L.S.S.; V.R. OLIVEIRA. Diversity and genetic structure in cajá tree (Spondias mombin L.) populations in northern Brazil. Revista Brasileira de Fruticultura, Jaboticabal, v 31, n.1, p.171-181, mar. 2009.
SUDRÉ, C.P. et al. Divergência genética entre acessos de pimenta e pimentão utilizando técnicas multivariadas. Horticultura Brasileira, Brasília, v. 23, n. 1, p. 22-27, jan./ mar. 2005.
VIANA, A.P. et al. Genetic diversity in yellow passion fruit populations. Crop Breeding and Applied Biotechnology, Viçosa, n.6, p.87-94, 2006.
VIEIRA, R. L.; NODARI, R. O. Diversidade genética de cultivares de alho avaliada por marcadores RAPD. Ciencia Rural, Santa Maria, v.37, n.1, p. 51-57. jan./fev. 2007.
VERARDI, C.K.et al. Adaptabilidade e estabilidade de borracha e seleção em progênies de seringueira. Pesquisa Agropecuária Brasileira, Brasília, v.44, n.10, p.1277-1282, out. 2009.