Received April 8, 2009 and accepted September 18, 2009. Corresponding author: llpascoal@yahoo.com.br
www.sbz.org.br
Beef cuts yield of steer carcasses graded according to conformation and
weight
Leonir Luiz Pascoal1, José Fernando Piva Lobato2, João Restle3, Fabiano Nunes Vaz4, Ricardo Zambarda Vaz4, Luís Fernando Glasenapp de Menezes5
1UFSM.
2UFRGS. Bolsista do CNPq. 3UFG. Bolsista do CNPq.
4PROGEPEC Consultores Associados, Santa Maria - RS. 5UFTPR - Campus Dois Vizinhos - PR.
ABSTRACT - The experiment evaluated total and individual yield of commercial cuts, bones, and trimmings of carcasses from 38 Braford steers at 22 months of age finished in a feedlot. Carcasses were ranked according to three conformation classes (good minus = score 10; good = score 11; good plus = score 12), and three weight classes (heavy = 229.4 kg, intermediate = 205.0 kg, and light = 184.0 kg, ranging from 222.9 to 250.4, 201.5 to 209.0, and 170.0 to 190.3 kg, respectively). Carcass cold shrinkage was not affected by conformation, but it was significantly lower in heavy (1.83%) than in intermediate (2.53%) and in light carcasses (2.30%), which were not different among each other. Carcass flank percentage was not affected by conformation, but it was significantly higher in heavy (13.93%) and intermediate carcasses (13.87%) as compared to light carcasses (13.07%). Deboned beef cuts (78.08%) of carcasses of steers, bone (16.57%), and trimmings (5.23%) yields and losses due to deboning (0.12%) were not significantly affected by carcass weight. However, when they were evaluated according to conformation classes, those with better conformation showed higher meat cut yield (78.75 vs 77.92 and 77.29%). Conformation affects meat cut yield of carcasses of young steers while carcass weight does not show this characteristic.
Key Words: Braford, commercial cuts, deboning, edible portion, pistol, primal cuts
Rendimento de cortes cárneos de carcaças de novilhos classificadas de
acordo com a conformação e o peso de carcaça
RESUMO - Avaliaram-se os rendimentos cárneos total e individual de cortes comerciais, de osso e de retalho de carcaças de 38 novilhos Braford com 22 meses de idade terminados em confinamento. As carcaças foram classificadas de acordo com três classes de conformação (boa menos = 10 pontos; boa = 11 pontos; e boa mais = 12 pontos) e três classes de peso (pesadas = 229,40 kg; medianas = 205,04 kg; e leves = 184,00 kg com variação, 222,9 a 250,4; 201,5 a 209,0; e 170,0 a 190,3 kg, respectivamente). A quebra no resfriamento não foi influenciada pela conformação, mas foi significativamente menor nas carcaças pesadas (1,83%) em comparação às medianas (2,53%) e leves (2,30%), que não diferiram entre si. A participação relativa da ponta-de-agulha não foi afetada pela conformação, mas foi significativamente maior nas carcaças pesadas (13,93%) e medianas (13,87%) em relação às leves (13,07%). Os rendimentos à desossa de cortes cárneos (78,08%) de osso (16,57%) e retalhos (5,23%) e as perdas inerentes ao processo da desossa (0,12%) não foram influenciados significativamente pelo peso das carcaças. Entretanto, quando avaliadas por classes de conformação, as carcaças de melhor conformação tiveram maior rendimento de cortes cárneos (78,75 vs 77,92 e 77,29%). A conformação influencia o rendimento de cortes cárneos da carcaça de novilhos jovens, enquanto o peso da carcaça não afeta essa característica.
Palavras-chave: Braford, cortes comerciais, cortes primários, desossa, porção comestível, serrote
Introduction
After the 1990s, the debate on a Brazilian beef carcass ranking system further developed, and aimed at establishing a pricing system and at identifying the products to the consumers. Gradual changes in the trading systems were
made, starting with compensation per carcass weight, and payment of a premium for better carcass quality.
(2000), Vaz & Restle (2002), Restle & Vaz (2003), and Paulino et al. (2005).
Brazilian packing plants used to market their products only as whole carcasses or primary cuts. However, the need to become more professional required restructuring the beef chain, with deboning and vacuum-packing as landmarks of the new distribution chain. This brought advantages for the entire chain, such as better quality control lower processing and distribution costs, adding value to the products and increasing their shelf-life. Carcass quality and yield became important (Restle & Vaz, 2003).
To understand which biotypes and carcass standards result in higher cuts yield became the objective of researchers such as Bonilha et al. (2007) and Tarouco et al. (2007), in order to determine which of those biotypes and carcass should get premiums for productivity and quality. The classical study of Hedrick et al. (1969) contributed to the US packing industry because it generated knowledge on the effects of weight and conformation on the deboned yield of steers slaughtered in commercial packing plants in the US. Some biotypes are more interesting for packers; however, they can be more expensive to be produced due to their low biological efficiency, as demonstrated by their lower feed efficiency. According to Pötter et al. (1998), intensive production systems are economically more efficient, but there are quite few studies in Brazil on the interaction between interests of packers and farmers in carcass quality and yield.
This study aimed at evaluating individual and total cut yield in steers as a function of carcass weight classes and conformation.
Material and Methods
In this study, 38 carcasses of castrated Braford steers at 22 months of age derived from a controlled and traced commercial herd were used. All animals were born in October, 2005, and they were placed in a feedlot in May, 2007, with initial average weight of 320 kg. Steers were feed sorghum silage ad libitum and concentrate at 1.35% of their body
weight. Average daily weight gain was 1.25 kg. After 72 days in the feedlot, when steers visually reached body condition to market, steers were sold to a commercial packing plant with federal inspection, also located near the university.
Steers followed the normal processing flow up to chilling at 1oC for 48 hours. The average weight at slaughter was 404.00 kg, resulting in an average carcass yield of 51.05% and average hot carcass weight of 206.24 kg. Carcasses were weighed and subjectively evaluated by three different
individuals for conformation according to a 18-score scale, as described by Müller (1987). In this scale, score 1-3 correspond to carcasses classified as “poor”, 4-6 as “inferior”, 7-9 as “regular”, 10-12 as “good”, 13-15 as “very good”, and 16-18 as “superior”.
Carcasses were first classified and studied according to three weight classes (heavy = 229.40 kg; medium = 205.04 kg, or light = 184.00 kg,, for 13, 13, and 12 carcasses, respectively), in which fat thickness, conformation, or any other characteristic was not considered. Weight range in each class ranged from 222.9 to 250.4, from 201.5 to 209.0, and from 170.0 to 190.3 kg, for heavy, medium, and light carcasses, respectively. Carcasses were then classified and studied according to three conformation classes (good minus, good, and good plus) according to the methodology described by Müller (1987) with 13, 17, and 8 carcasses in each class, respectively. Again, weight, fat thickness, or any other characteristic was not considered
In order to obtain the yield of each full primxal cut, carcasses were divided in pistol (hindquarter special, containing round, rump, and loin) and flank and forequarter (five ribs), weighed, and then sent to a refrigerated room for deboning.
All cuts were weighed and deboned during the same shift by the same workers, aiming at maintaining the same cut and trimming standards, and this resulted in the respective boneless beef cuts (except for ribs of the primal cut, which remained in the wide pistol and was prepared bone-in), edible trimmings (edible meat + fat trimmings), discarded trimmings (excessive fat trimmings + tallow + membranes), discarded bone, and weight loss inherent of the deboning process. This weight loss is probably because of the dehydration of cuts or small amounts of tissue that are lost during handling. Typical deboning standard for the Brazilian domestic market was used, with moderate to close trimming, complying with the demands for the production of branded vacuum-packed beef.
Meat cuts and edible trimmings were weighed, and they consisted of prepared cuts, summing up the parts sold for human consumption. Discarded bones and trimmings were also weighed to calculate the participation of each fraction relative to cold carcass weight.
The same procedures were used for the forequarters, which produced all the boneless cuts and fore ribs, including the rib plate, except for short ribs and rib roast that, along with the T-bone steak, were the only meat cuts prepared and packed with bones.
class (W) and conformation class (C). Data were submitted for analysis of variance, and means were compared by the test of Tukey (SAS, 1997).
When weight, conformation, and fat thickness classes were not the studied parameters, they were used as covariates, and as they did no present any significant effect, they were removed from the model.
Weight classes were evaluated according to the following mathematical model:
Yij = m + Wi + Eij;
where Yij = dependent variables; m= mean of all observations; Wi effect of ith weight class; and Eij, random residual error.
Conformation classes were evaluated according to the following mathematical model:
Yij = m + Ci + Eij,
where Yij = dependent variables; m= mean of all observations; Ci represents the effect of ith conformation class; and Eij, random residual error.
Results and Discussion
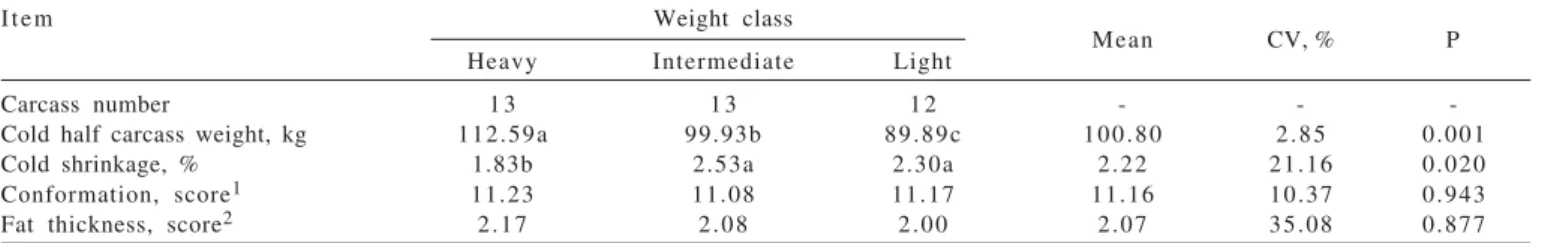
Carcass weight means (always considering half carcasses) were significantly different, which was expected because of the requirements used to build the weight classes (Table 1). The average weight of the 38 carcasses was 206.15 kg.
Conformation and fat thickness were not significantly different among carcass weight classes (Table 1), and therefore, these traits did not influence beef cut yield results from weight evaluation, indicating that any possible variation in yield was due to weight.
Cold shrinkage was lower (P<0.05) in the heavy carcasses as compared to medium and light ones, which presented similar cold shrinkage (P>0.05) (Table 1). This was probably because of the lower surface area per weight unit in the heavier carcasses. Average cold shrinkage was 2.2% (Table 1), which was considered normal as it was obtained after 48 hours of chilling. The standard in the
processing industry is 2.0% loss in 24 hours of chilling. Similar results were reported by Restle et al. (1997) and Kuss et al. (2005).
Primal cut yields were not different among carcass weight classes, except for flank, which had the lowest participation in light carcasses (Table 2). This is explained by the spine distance from the section dividing the pistol and the forequarter, which turned to be proportional for carcass weight, according to the method of Muller (1987). Berg & Butterfield (1976) mentioned that pistol muscles develop earlier in the entire carcass. This means that growth rate of pistol cuts decreases as carcass weight increases. In the studies by Berg & Butterfield (1976), forequarter percentage did change as carcass weight increased, and pistol proportion decreased due to the increase in flank proportion relative to the full carcass because abdominal muscles developed later as compared to pistol muscles.
In a study using steers in different development stages, Arboitte et al. (2004) concluded that increasing slaughter weights resulted in a reduction in the percentage of the pistol and a linear increase in the percentage of flank in the carcass. According to Vaz et al. (2002), the increase in the percentage of flank in heavier carcasses with higher fat thickness may be attributed to a higher fat deposition in this area, which proportionally increases more than the total of carcass weight, as also found by other researchers (Restle et al., 1999a; Costa et al., 2002; and Kuss et al., 2005).
Tenderloin relative yield was higher (P<0.05) in lighter carcasses as compared to the heavy ones, indicating that this cut grows earlier than the carcass as a whole (Table 3). When evaluating 98.595 carcasses of male and female zebu crossbreds, Ledic et al. (2000) found similar meat cut yields as those in the present experiment, and it was mentioned the limitations in their evaluations methods. Those authors expressed meat yield relative to hot carcasses, and obtained values of 47.89% for the pistol, 38.48% for the forequarter, 10.14% for flank, and 3.49% inherent losses from hot to cold carcass, including deboning inherent losses.
Item Weight class
Mean CV, % P
Heavy Intermediate Light
Carcass number 1 3 1 3 1 2 - -
-Cold half carcass weight, kg 112.59a 99.93b 89.89c 100.80 2.85 0.001
Cold shrinkage, % 1.83b 2.53a 2.30a 2.22 21.16 0.020
Conformation, score1 11.23 11.08 11.17 11.16 10.37 0.943
Fat thickness, score2 2.17 2.08 2.00 2.07 35.08 0.877
Table 1 - Evaluated parameters, according to carcass weight classes
CV - Coefficient of variation; P - Probability.
Means followed by different letter for the same parameter are different (P<0.05) by Tukey test. 1 Scale of scores 1 to 18, with 10 = good minus, 11 = good, and 12 = good plus.
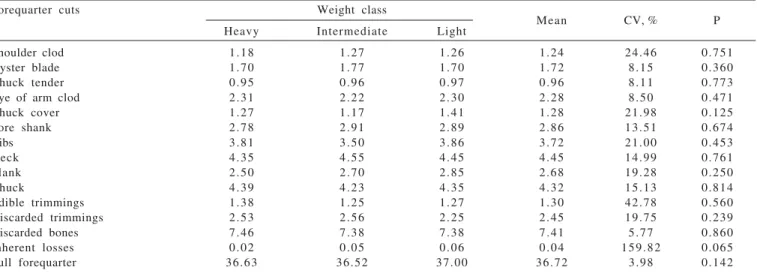
The yields of the forequarter and its cuts were not influenced (P>0.05) by carcass weight classes (Table 4).
Ledic et al. (2000) obtained 8.02% bones in the forequarter, which is very close to the value (7.41%) measured in the present experiment. However, the values of the other forequarter cuts were different, possibly due to differences in data collection, cutting, and trimming methods or perhaps due an actual difference in carcass composition.
Flank yield was higher (P<0.05) in heavy carcasses than in the light carcasses (Table 5) and consequently fore ribs, edible trimmings, and thin flank yields were higher, which was expected as flank primal cut had a higher participation in heavy carcasses (Table 2).
Total yield of meat cuts prepared for sale from the pistol and the forequarter was not affected by carcass weight
classes, although the flank of the heavy carcasses presented higher cut yield (Table 6), as previously discussed.
Total deboned yield of the prepared cuts was not influenced (P>0.10) by carcass weight differences (Table 7). The average was 78.08% of prepared cuts, including edible trimmings. Discarded bones and discarded trimmings were not different either.
In the study of Ledic et al. (2000), 72.59% edible meat, 19.64% bones, and 4.21% discarded trimmings were obtained. According to the authors, some variation in beef cuts weight and their percentages relative to carcass weight is expected when different studies are compared.
According to Osório et al. (1995), who evaluated the carcasses of Hereford steers at 30 to 36 months with weights ranging between 134.5 and 224.00 kg, no differences in pistol cuts were found probably because of the small
Pistol cuts Weight class
Mean CV, % P
Heavy Intermediate Light
Outside 4.28 4.13 4.18 4.20 7.74 0.526
Inside 6.46 6.64 6.83 6.64 6.88 0.146
Eye of round 1.87 1.82 1.87 1.85 11.93 0.817
Knuckle 4.07 4.11 4.08 4.09 6.56 0.921
Leg of shank 1.60 1.66 1.59 1.62 6.17 0.159
Shin 1.68 1.72 1.69 1.70 5.85 0.560
Rump uk trim 2.62 2.60 2.68 2.63 7.04 0.611
Rump cap 1.00 1.06 1.04 1.03 14.19 0.618
Tail of rump 0.80 0.86 0.87 0.84 10.17 0.120
Tenderloin 1.39b 1.43ab 1.54a 1.45 8.80 0.010
Striploin 3.86 3.87 3.89 3.88 8.54 0.986
Cuberoll 1.86 1.89 1.93 1.89 11.30 0.745
Ribeye cap 1.08 1.12 1.08 1.09 13.36 0.795
Ribs 2.62 2.56 2.69 2.63 12.25 0.573
Membranes 0.08 0.09 0.09 0.09 21.26 0.440
Edible trimmings 3.03 2.61 2.70 2.78 27.93 0.467
Discarded trimmings 1.89 2.16 1.98 2.01 17.24 0.133
Discarded bones 9.22 9.15 9.11 9.16 6.57 0.895
Inherent losses 0.02 0.14 0.09 0.08 98.85 0.876
Full pistol 49.43 49.62 49.93 49.66 2.91 0.456
Table 3 - Pistol cut yield as a percentage of cold carcass, according to carcass weight
CV - Coefficient of variation; P - Probability.
Means followed by different letter for the same parameter are different (P<0.05) by the Tukey test.
Cut Weight class
Mean CV, % P
Heavy Intermediate Light
Pistol 49.43 49.62 49.93 49.66 2.28 0.544
Round 27.77 27.61 27.88 27.75 4.18 0.843
Rump 6.71 6.88 6.81 6.80 5.41 0.512
Loin 14.96 15.13 15.25 15.11 3.70 0.437
Forequarter 36.63 36.52 37.00 36.72 2.80 0.496
Shoulder 15.87 15.79 15.88 15.85 4.73 0.953
Front ribs 20.76 20.73 21.12 20.87 4.91 0.587
Flank 13.93a 13.87a 13.07b 13.62 6.75 0.038
Table 2 - Primal cuts yields as cold carcass percentage, according to carcass weight classes
CV - Coefficient of variation; P - Probability.
difference among the ages of the steers. The authors stated that the results clearly showed that there is no increase in the proportion of the most valued pistol cuts in Hereford steers with body weights ranging from 302 to 470 kg; actually, total pistol percentage decreased as live weight and hot carcass weight increased. Another conclusion of this study was that there is no commercial advantage in slaughtering heavier or older Hereford steers because higher body, carcass, and pistol weights do not improve carcass quality in terms of the proportion of cuts with higher commercial value. The absolute weight of these cuts increase with slaughter weight, and this may be advantageous for packers if their processing cost is considered per slaughtered unit. Taking into account a determined cost per kg of deboned beef, animals that produce higher percentages of prime cuts would be more interesting for packers.
Bonilha et al. (2007) evaluated commercial cut yield of Nelore Seleção, Nelore Controle, and Caracu cattle, and did not find any edible portion difference among the studied genetic groups. Bone percentage was not different among
the two Nelore groups, either in terms of full carcass or quarters. They observed that cuts prepared from the pistol, such as tenderloin, rump, knuckle, inside, and eye of round of Nelore Seleção cattle presented higher values as compared to Nelore Controle when evaluated in absolute terms. Edible portion yield of the carcasses of Caracu, Seleção, and Controle was 66.8, 67.6, and 67.6%, respectively. These values are lower than those found in the present experiment, although all boneless cuts were evaluated, and edible and non-edible trimmings were presented together in the study by Bonilha et al. (2002). In addition, the authors did not find any differences in trimmings yield, and considered edible only definite cuts, concluding that the selection for weight did not change total edible carcass yield, or bone or trimmings percentages.
Total bone carcass yield was 19.13% in the study by Bonilha et al. (2007), which is higher than that obtained in the present experiment (16.57%). However, flank bones are not included in the latter figure, because this cut was bone-in prepared. Ledic et al. (2000) found 1.8% bone in Forequarter cuts Weight class
Mean CV, % P
Heavy Intermediate Light
Shoulder clod 1.18 1.27 1.26 1.24 24.46 0.751
Oyster blade 1.70 1.77 1.70 1.72 8.15 0.360
Chuck tender 0.95 0.96 0.97 0.96 8.11 0.773
Eye of arm clod 2.31 2.22 2.30 2.28 8.50 0.471
Chuck cover 1.27 1.17 1.41 1.28 21.98 0.125
Fore shank 2.78 2.91 2.89 2.86 13.51 0.674
Ribs 3.81 3.50 3.86 3.72 21.00 0.453
Neck 4.35 4.55 4.45 4.45 14.99 0.761
Flank 2.50 2.70 2.85 2.68 19.28 0.250
Chuck 4.39 4.23 4.35 4.32 15.13 0.814
Edible trimmings 1.38 1.25 1.27 1.30 42.78 0.560
Discarded trimmings 2.53 2.56 2.25 2.45 19.75 0.239
Discarded bones 7.46 7.38 7.38 7.41 5.77 0.860
Inherent losses 0.02 0.05 0.06 0.04 159.82 0.065
Full forequarter 36.63 36.52 37.00 36.72 3.98 0.142
Table 4 - Forequarter cuts yields as a percentage of cold carcass, according to carcass weight classes
CV - Coefficient of variation; P - Probability.
Means followed by different letter for the same parameter are different (P<0.05) by Tukey test.
Flank cuts Weight class
Mean CV, % P
Heavy Intermediate Light
Thin ribs 5.99 6.07 5.74 5.93 11.09 0.444
Fore ribs 3.29a 3.16ab 2.93b 3.13 11.27 0.050
Shoulder clod 1.26 1.35 1.29 1.30 10.68 0.240
Thin flank 1.78a 1.74a 1.56b 1.69 8.75 0.001
Flank steak 0.43 0.40 0.42 0.42 15.62 0.485
Edible trimmings 0.42a 0.34ab 0.33b 0.36 21.75 0.030
Discarded trimmings 0.75 0.80 0.77 0.77 16.68 0.603
Inherent losses 0.01 0.01 0.02 0.01 126.65 0.380
Full flank 13.92a 13.87ab 13.06b 13.61 6.72 0.0504
Table 5 - Flank cut yield as a percentage of cold carcass, according to carcass weight classes
CV - Coefficient of variation; P - Probability.
cold carcass flank, and if added to the 16.57% obtained here it would result in 19.37%, similar to that found by Bonilha et al. (2007). These authors also found a general mean of 11.3% trimmings, which is consistent with total trimmings yield of the present experiment.
Norman & Felício (1981), in an experiment with Charolais, Canchim, Nelore, and Guzerá breeds, observed that cattle of the two first breeds presented less fat trimmings as compared to Nelore and Guzerá animals. In addition, they presented equal or higher edible meat yield and prime cuts yield.
Cold carcass weight and fat thickness were not different (P>0.05) among the conformation classes, therefore these traits did not influence cut yield evaluated as a function of conformation, when any differences would indicate the influence of conformation per se (Table 8).
Cold shrinkage was not affected (P>0.05) by carcass conformation classes (Table 8). According to Pacheco et al. (2005), better carcass conformation may result in lower cold shrinkage, but this was not observed in the present experiment. The lower cold shrinkage in carcasses with worse conformation may be related to the lower specific weight of each carcass section, reducing the surface of the muscle exposed to evaporation per weight unit.
Working with heavier carcasses, Hedrick et al. (1969), according to the US standards, did not find any differences in primal cuts percentages between “choice” and “good” carcass conformation classes
Carcasses with the best conformation presented higher yields (P<0.05) relative to “good minus” carcasses, whereas those classified as “good” showed intermediate values (Table 9).
In an experiment very similar to the present study, Hedrick et al. (1969) investigated the effects of conformation, carcass weight, and fat thickness on deboned yield of steers slaughtered in US packing plants, and concluded that the highest prepared cut yields obtained in carcasses with the best conformation was due to their lower bone percentage.
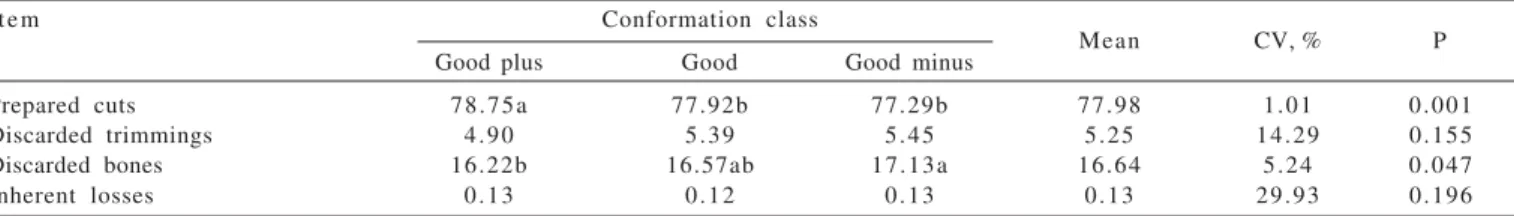
The lower participation of discarded bones and trimmings in the carcasses with the best conformation explains the higher yield of cuts prepared from these carcasses (P<0.05) as compared to the two other conformation classes (Table 10).
Average prepared cut yield, regardless to carcass conformation class, was 78.13%, taking into account that ribs were bone-in prepared. According to Bonilha et al. (2007), flank bone represents 1.95% of cold carcass weight. If this percentage is discounted from the 78.13% yield obtained in the present experiment, results in 76.18% edible meat yield.
Several studies carried out in Brazil used the HH section (rib section that estimates carcass physical composition as a whole) proposed by Hankins & Howe (1946) to predict carcass composition. Feijó et al. (2001) used Angus ×
Nelore steers with 4.4 mm average fat coverage, and estimated edible cuts yield, using the HH section, in 81.65% and bone yield in 17.1%. However, in the present experiment, rib bone was not removed, differently from the study by Feijó et al. (2001). Therefore, it is possible that the bone fractions determined in the studies using the HH section were underestimated. Further research studies should be carried out on this subject as the frame of cattle has changed in the last few decades. When the equations
Corte Weight class
Mean CV, % P
Heavy Intermediate Light
Pistol 38.33 38.20 38.74 38.42 2.90 0.456
Forequarter 26.62 26.52 27.32 26.82 3.98 0.142
Flank 13.16a 13.05ab 12.29b 12.83 6.65 0.031
Table 6 - Yields of meat cuts prepared from primal cuts as a percentage of cold carcass, according to carcass weight classes
CV - Coefficient of variation; P - Probability.
Means followed by different letter for the same parameter are different (P<0.05) by Tukey test.
Parameter Weight class
Mean CV, % P
Heavy Intermediate Light
Prepared cuts 78.11 77.78 78.35 78.08 1.21 0.325
Discarded trimmings 5.17 5.52 5.00 5.23 14.44 0.225
Discarded bones 16.69 16.53 16.49 16.57 5.61 0.850
Inherent losses 0.03 0.07 0.06 0.05 156.23 0.263
Table 7 - Total yield of products derived from deboning as a percentage of cold carcass, according to carcass weight classes
CV - Coefficient of variation; P - Probability.
of Hankins & Howe were published, in 1946, carcass fat content was much higher as compared to the current carcasses, particularly in synthetic breeds derived from European × Zebu crosses.
In the studies by Osório et al. (1995), Junqueira et al. (1998), Ledic et al. (2000), Coutinho Filho et al. (2006), Bonilha et al. (2007), and Tarouco et al. (2007), the authors used the direct deboning method, and found lower edible cuts percentages and higher bone percentages than those reported in most of the articles using the HH section proposed by Hankins & Howe (1946).
Although carcass weight does influence the relative yield of prepared cuts, the packing plants, as they produce meat, benefit from heavy carcasses, since they allow higher processing yield, with consequent lower processing cost per produced unit. In addition, some markets prioritize cuts within narrow weight ranges, undervaluing those with lower weights. For the farmer, steers with higher slaughter weights mean lower biological efficiency, which may be compensated by the packing industry paying progressive premiums for weight classes.
The current levels of incentives offered to farmers, ranging between 0.5 and 2.0%, according to packing company, may not be enough to compensate the costs generated by the lower feed efficiency caused by increases in slaughter weight and time required for fat thickness. The
magnitude of these values can be demonstrated by a simulation of different herd composition scenarios, which include different slaughter weights and all animal performance and economic parameters are fixed (Pötter et al., 1998; Beretta et al. 2002). The best conformation positively influenced meat yield (Table 10), even though the conformation classes were not very different due to the pattern of the animals.
The packing companies will always be interested in obtained the best conformation in terms of muscling, as beef will increasingly be marketed as boneless meat. Animals with better conformation probably are more biologically efficient, therefore being more profitable for farmers.
Packers will continue to prioritize young animals, with carcass weight ranging from 220 to 265 kg, and from 5 to 8 mm fat thickness, along with the predictable and normal variations required by market niches. Farmers, on the other hand, will produce these carcasses if compensated by the lower biological efficiency of cattle that allow obtaining carcasses complying with the above-mentioned standards, rather than lighter carcasses with lower fat thickness. If not compensated, farmers will focus on biological efficiency and reduced slaughter weight and fat thickness, resigned that their relation with the packer will continue to be difficult and determined by a conflict of interests.
Item Conformation class
Mean CV, % P
Good plus Good Good minus
Number of animals 1 3 1 7 8 - -
-Conformation, score1 12.31a 11.00b 9.62c 10.98 4.94 0.0001
Cold half carcass weight, kg 101.98 100.36 101.19 101.18 9.91 0.908
Cold shrinkage, % 2.29 2.13 2.13 2.21 25.11 0.788
Fat thickness2 1.92 2.12 2.25 2.10 34.67 0.579
Table 8 - Conformation score, cold half carcass weight, cold shrinkage, and fat thickness according to carcass conformation classes
CV - Coefficient of variation; P - Probability.
Means followed by different letter for the same parameter are different (P<0.05) by the Tukey test. 1 Scale of scores 1 to 18, with 10 = good minus, 11 = good, and 12 = good plus.
2 Scale of scores 0 to 4, with 1 = regular (3-4 mm); 2 = good (5-6 mm), and 3 = excellent (7-8 mm).
Table 9 - Primal cut yield as a percentage of cold carcass and meat deboned of primal cuts as a percentage of cold carcass, according to carcass conformation classes
Cut Conformation class Mean CV, % P
Good plus Good Good minus
Pistol 49.87 49.58 49.46 49.64 2.29 0.684
Forequarter 36.73 36.61 36.90 36.75 5.16 0.100
Flank 13.40 13.81 13.64 13.62 4.97 0.861
Meat deboned of pistol 38.97a 38.30ab 37.76b 38.34 2.70 0.039 Meat deboned of forequarter 27.15 26 . 5 7 26.76 26.83 4.08 0.355 Meat deboned of flank 12.63 13.05 12.77 12.82 7.18 0.456
CV - Coefficient of variation; P - Probability.
Conclusions
Total relative yield of beef cuts prepared by carcass deboning is influenced by carcass conformation, but not by carcass weight. Cold shrinkage is lower in heavier carcasses, but it is not influenced by carcass conformation. The relative proportion of flank increases with carcass weight, but it is not affected by carcass conformation. There is no effect of carcass weight or conformation on pistol and forequarter primal cuts yields.
References
ARBOITTE, M.Z.; RESTLE, J.; ALVES FILHO, D.C. et al. Características da carcaça de novilhos 5/8 Nelore - 3/8 Charolês abatidos em diferentes estádios de desenvolvimento. Revista Brasileira de Zootecnia, v.33, n.4, p.969-977, 2004. BERETTA, V.; LOBATO, J.F.P.; MIELITZ NETO, C.G.A.
Produtividade e eficiência biológica de sistemas de produção de gado de corte de ciclo completo no Rio Grande do Sul. Revista Brasileira de Zootecnia, v.31, n.2, p.991-1001, 2002. (supl.). BERG, R.T.; BUTTERFIELD, R.M. New concepts of cattle
growth. Sydney: Sydney University Press, 1976. 240p. BONILHA, S.F.M.; PACKER, I.U.; FIGUEIREDO, L.A. et al. Efeitos
da seleção para peso pós-desmame sobre características de carcaça e rendimento de cortes cárneos comerciais de bovinos.
Revista Brasileira de Zootecnia, v.36, n.5, p.1275-1281, 2007.
COSTA, E.C.; RESTLE, J.; VAZ, F.N. et al. Características de carcaça de novilhos Red Angus superprecoces abatidos com diferentes pesos. Revista Brasileira de Zootecnia, v.31, n.1, p.119-128, 2002.
COUTINHO FILHO, J.L.V.; PERES, R.M.; JUSTO, C.L. Produção de carne de bovinos contemporâneos, machos e fêmeas, terminados em confinamento. Revista Brasileira de Zootecnia, v.35, n.5, p.2043-2049, 2006.
FEIJÓ, G.L.D.; EUCLIDES FILHO, K.; EUCLIDES, V.P.B. et al. Avaliação das carcaças de novilhos F1 Angus-Nelore em pastagens de Brachiaria decumbens submetidos a diferentes
regimes alimentares. Revista Brasileira de Zootecnia, v.30, n.3, p.1015-1020, 2001. (supl. 1).
HANKINS, P.; HOWE, P.E. Estimation of composition of beef carcasses and cuts. Washington, D.C.; USDA, 1946. 20p. (Tecnical Bulletin USDA, 926).
HEDRICK, H.B.; STRINGER, W.C.; KRAUSE, G.F. Retail yield comparison of average good and average choice conformation beef carcasses. Journal of Animal Science, v.28, n.1, p.187-191, 1969.
JUNQUEIRA, J.O.B.; VELLOSO, L.; FELÍCIO, P.E. Desempenho, rendimentos de carcaça e cortes de animais, machos e fêmeas, mestiços Marchigiana x Nelore, terminados em confinamento.
Revista Brasileira de Zootecnia, v.27, n.6, p.1199-1205, 1998.
KUSS, F.; RESTLE, J.; BRONDANI, I.L. et al. Características da carcaça de vacas de descarte de diferentes grupos genéticos terminadas em confinamento com distintos pesos. Revista Brasileira de Zootecnia, v.34, n.3, p.915-925, 2005. LEDIC, I.L.; TONHATI, H.; FERNANDES, L.O. Rendimento
integral de bovinos após abate. Ciência Agrotécnica, v.24, n.1, p.272-277, 2000.
MÜLLER, L. Normas para avaliação de carcaças e concurso de carcaça de novilhos. 2.ed. Santa Maria: Universidade Federal de Santa Maria, 1987. 31p.
MÜLLER, L.; PRIMO, A.T. Influência do regime alimentar no crescimento e terminação de bovinos e na qualidade da carcaça.
R e v i s t a B r a s i l e i r a d e Z o o t e c n i a, v.21, n.4, p.445-453, 1 9 8 6 .
NORMAN, G.A.; FELÍCIO, P.E. Effects of breed and nutrition on the productive traits of zebu, Charolais and crossbreed beef cattle in south-east Brazil. 1. Body and gross carcass composition. Meat Science, v.5, n.4, p.425-438, 1981. OSÓRIO, J.C.S.; JARDIM, P.O.; GUERREIRO, J.L.V. et al.
Desenvolvimento dos cortes da carcaça em bovinos Hereford.
Revista Brasileira de Agrociência, v.1, p.43-47, 1995. PACHECO, P.S.; SILVA, J.H.S.; RESTLE, J. et al. Características
quantitativas da carcaça de novilhos jovens e superjovens de diferentes grupos genéticos. Revista Brasileira de Zootecnia, v.34, n.5, p.1666-1677, 2005.
PAULINO, P.V.R.; COSTA, M.A.L.; VALADARES FILHO, S.C. et al. Validação das equações desenvolvidas por Hankins e Howe para predição da composição da carcaça de zebuínos e desenvolvimento de equações para estimativa da composição c o r p o r a l . R e v i s t a B r a s i l e i r a d e Z o o t e c n i a, v. 3 4 , n . 1 , p.327-339, 2005.
PEROTTO, D.; MOLETTA, J.L.; CUBAS, A.C. Características quantitativas da carcaça de bovinos Charolês, Caracu e cruzamentos recíprocos terminados em confinamento. Revista Brasileira de Zootecnia, v.29, n.1, p.117-124, 2000. PÖTTER, L.; LOBATO, J.F.P.; MIELITZ NETO, C.G.A.
Produtividade de um modelo de produção para novilhas de corte primíparas aos dois, três e quatro anos de idade. Revista Brasileira de Zootecnia, v.27, n.3, p.613-619, 1998.
RESTLE, J.; KEPLIN, L.A.S.; VAZ, F.N. Características quantitativas da carcaça de novilhos Charolês, abatidos com diferentes pesos. Pesquisa Agropecuária Brasileira, v.32, n.8, p.851-856, 1997.
RESTLE, J.; VAZ, F.N.; BRONDANI, I.L. et al. Estudo da carcaça de machos Braford desmamados aos 72 ou 210 dias, abatidos aos catorze meses. Pesquisa Agropecuária Brasileira, v.34,
n.11, p.2137-2144, 1999a.
RESTLE, J.; VAZ, F.N.; PASCOAL, L.L. et al. Efeito do desmame precoce na carcaça de novilhos terminados em pastagem e abatidos aos 24 meses. Pesquisa Agropecuária Brasileira, v.34, n.11, p.2129-2136, 1999b.
RESTLE, J.; VAZ, F.N. Eficiência e qualidade na produção de carne bovina. In: REUNIÃO ANUAL DA SOCIEDADE BRASILEIRA DE ZOOTECNIA, 40., 2003, Santa Maria. Palestras... Santa Maria: Sociedade Brasileira de Zootecnia, 2003.
STATISTICAL ANALYSIS SYSTEMS - SAS. User’s guide. Version 6, Cary: 1997. v.2, 1052p.
Item Conformation class
Mean CV, % P
Good plus Good Good minus
Prepared cuts 78.75a 77.92b 77.29b 77.98 1.01 0.001
Discarded trimmings 4.90 5.39 5.45 5.25 14.29 0.155
Discarded bones 16.22b 16.57ab 17.13a 16.64 5.24 0.047
Inherent losses 0.13 0.12 0.13 0.13 29.93 0.196
Table 10 - Yields of meat cuts prepared from primal cuts as a percentage of cold carcass, according to carcass conformation classes
CV - Coefficient of variation; P - Probability.
TAROUCO, J.U.; LOBATO, J.F.P.; TAROUCO, A.K. et al. Comparação entre medidas ultra-sônicas e da carcaça na predição da composição corporal em bovinos. Estimativas do peso e da porcentagem dos cortes comerciais do traseiro. Revista Brasileira de Zootecnia, v.36, n.6, p.2092-2101, 2007. VAZ, F.N.; RESTLE, J.; VAZ, R.Z. et al. Efeitos de raça e heterose
na composição física da carcaça e na qualidade da carne de
novilhos da primeira geração de cruzamento entre Charolês e N e l o r e . R e v i s t a B r a s i l e i r a d e Z o o t e c n i a, v. 3 1 , n . 1 , p.376-386, 2002 (supl.).