Received May 6, 2010 and accepted April 13, 2011. Corresponding author: pacheco.dz.ufsm@hotmail.com
Carcass physical composition and meat quality of Charolais cattle of
different categories
Paulo Santana Pacheco1, João Restle2, Dari Celestino Alves Filho1, Ivan Luiz Brondani1,
Leonir Luiz Pascoal1, Fernando Kuss3, Luís Fernando Glasenapp de Menezes3, José Neuman
Miranda Neiva4
1Departmento de Zootecnia – UFSM. 2Departmento de Produção Animal – UFG. 3UTFPR.
4UFT.
ABSTRACT - The objective of the experiment was to study the carcass physical composition and meat qualitative characteristics of different categories of Charolais cattle, feedlot finished. Nine steers (ST), ten heifers (HE), with average age of 20 months, and ten cull cows (CO) with average age of 87 months, taken from the same herd, were used. Diet contained 13% of crude protein for ST and HE and 10% for CO, with roughage:concentrate relation of 50:50, on a dry matter basis. The animals of the three categories were slaughtered with similar degree of finishing, with average subcutaneous fat thickness of 3.8 mm. HE showed carcasses with greater pistolcut percentage (52.8%) than ST (51.0%) and CO (51.4%). The carcass physical composition was similar among the categories evaluated, with 66.5; 67.0 and 67.3% of muscle, 19.1; 18.5 and 18.7% of fat, and 14.9; 15.0; and 14.6% of bone, respectively, for ST, HE and CO. The marbling score was lower for HE (4.6 points) than ST (7.1 points) and CO (6.5 points). However, when this characteristic was adjusted for 100 kg of cold carcass, the means were similar among the categories. CO showed higher cooking losses (27.8%) than ST (21.4%) and HE (23.5%). Meat color, texture, tenderness, shear force, palatability and juiciness were similar among the categories. Charolais cows have the potential for the production of carcass and meat with quality similar to steers and heifers.
Key Words: compensatory growth, feedlot, intramuscular fat, primary cuts, sexual condition
www.sbz.org.br
Introduction
In recent years, improved techniques for beef production have considerably increased the production of calves, offering not only a higher number of males for slaughter, but also increasing the number of replacement heifers, giving the producer the option to be more rigid for selection pressure on the cow herd, and to the packing plants, a greater offer of cull females (Vaz et al., 2002).
Thus, the qualitative monitoring of carcass and meat of different categories becomes important not only for the producer, but mainly for industry, because it generates information, useful for re-evaluation of production costs, the formation of the price paid to producer and/or retail sale. Evaluating the percentages of the commercial cuts of the carcass, Restle et al. (2000) and Restle et al. (2001) reported superiority of younger females for the percentage of saw cut in relation to the more mature ones, while Ferreira et al. (2009) observed advantage of steers in relation to cull cows. Vaz et al. (2002) and Cattelam et al. (2009) observed greater percentage of fat and lower percentage of muscle in cull cows than in steers carcasses, while Vaz et al. (2010a)
reported similarity in muscle: bone and muscle+fat:bone relation by comparing young steers with heifers.
Evaluating meat characteristics, Vaz et al. (2002) and Vaz et al. (2010a) reported higher marbling score for females compared with males, while similarity for sensorial characteristics have been verified between categories, both finished on cultivated pasture or feedlot (Cattelam et al., 2009; Vaz et al., 2010b) representing a favorable result, particularly for cull females.
The objective of this study was to evaluate carcass and meat characteristics of Charolais steers, heifers and cull cows finished in feedlot and slaughtered at a similar degree of fatness.
Material and Methods
and ten cull cows with average age of 87 months, randomly taken from the same experimental herd of the Departamento de Zootecnia.
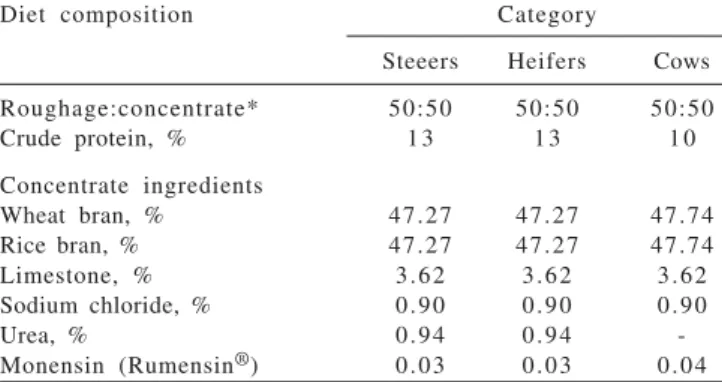
The feedlot period lasted 71 days, corresponding to seven days for adaptation and three periods of 21, 20 and 23 days for evaluation (Table 1).Diet contained 13% of crude protein for steers (ST) and heifers (HE) and 10% for cows (CO), with roughage:concentrate relation of 50:50, on a dry matter basis (Table 1).
Animals were weighed after solid fasting of 14 hours, prior to shipment to the packing plant. At slaughter, carcasses were identified, weighed and chilled between 0 and 2 °C for 24 hours in a cold chamber. Afterwards, carcasses were evaluated subjectively for physiological maturity, which represents the degree of ossification of the spinal processes of the thoracic vertebrae and fusion of sacral vertebrae, where, within a scale from 1 to 15 points, the lowest values correspond to a carcass with more advanced physiological maturity, according to methodology proposed by Müller (1987).
Primary cuts forequarter, pistolcut and sidecut were separated from the left half carcass and individually weighed, and their percentage was determined in relation to cold carcass weight. Carcass physical composition, bone, muscle and fat percentages were measuredin the left half-carcass according to the methodology proposed by Hankins and Howe (1946) and adapted by Muller et al. (1973). The measurement of subcutaneous fat thickness was obtained by the arithmetic mean of three measurements over the 12th rib on the Longissimus dorsi muscle. At the same site on the
exposed Longissimus dorsi sectioned at the 12th rib the
contour of this muscle was traced on paper for subsequent determination of the area, using the software AutoCAD®. To evaluate meat color, texture and marbling, the exposed side of the Longissimus dorsi was used, after exposure to
air for at least 30 minutes, assigning scale values as described by Müller (1987).
The sample of Longissimus dorsi muscle taken from
the sectioned part was identified, packaged and immediately frozen, with later sensory evaluation of meat performed by a panel of four trained tasters. The identification of samples during sensory evaluation did not allow reviewers to relate them to treatment. Losses during the thawing and cooking and the shear force needed to section the muscle fibers through the WB-shear device were also determined.
The experimental design was completely randomized, with different number of replicates per category, by applying the mathematical model: Yij = µ + Ci + eij, where Yij =
dependent variables, µ = overall mean of all observations;
Ci = Effect of i-th category, where 1 = steers, 2 = heifers and 3 = cull cows; eij = random residual effect associated with each observation, NID (0, σ²).
Data were subjected to analysis of variance and Pearson correlation, and Tukey’s test was applied at 5% of significance, by the statistical software SAS (1997).
Results and Discussion
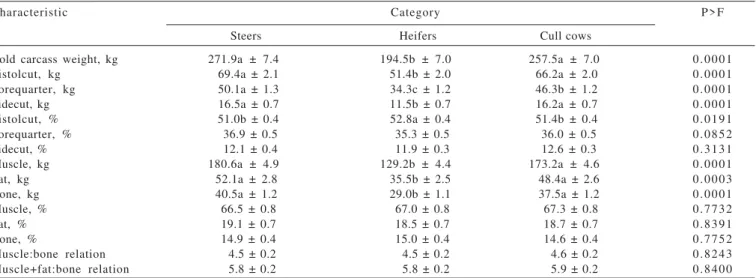
There was significant difference (P = 0.0001) in cold carcass weight (Table 2). Steers and cull cows had cold carcass weights similar to each other, but with higher values than those of heifers: 271.9, 257.5, and 194.5 kg, respectively.
For the primary cuts of the carcass, represented by the pistolcut, forequarter and sidecut (expressed in kg), heifers had the lowest values, reflecting the lower cold carcass weight. But the forequarter of the bulls was higher (50.1 kg) than for cull cows (46.3 kg), although these categories were statistically similar (P>0.05) for pistolcut and sidecut weights. Assessing crossbred Charolais × Nellore cull cows and steers, Ferreira et al. (2009) reported a higher weight of the forequarter and pistolcut for the cows, a fact related to the higher cold carcass weight (277.1 vs. 228.1 kg). Other studies show a positive relationship between the weight of commercial cuts and slaughter weight or carcass weight, both in steers (Restle et al., 1997; Costa et al. 2002; Arboitte et al., 2004) and cull cows (Kuss et al., 2005).
When these components were expressed as percentage in relation to cold carcass, there were no differences between the categories regarding the participation of forequarter and sidecut. However, heifers had higher (P = 0.0191) percentage of pistolcut (52.8%) than steers (51.0%) and cull cows (51.4%), which were similar.
As the pistolcut is the most valuable commercial primary cut of the carcass and contains the best boneless cuts such as rump cap, full rump, tail of rump and sirloin, this result is very interesting for the meatpacking industry, showing that
Diet composition Category
Steeers Heifers Cows
Roughage:concentrate* 50:50 50:50 50:50
Crude protein, % 1 3 1 3 1 0
Concentrate ingredients
Wheat bran, % 47.27 47.27 47.74 Rice bran, % 47.27 47.27 47.74
Limestone, % 3.62 3.62 3.62
Sodium chloride, % 0.90 0.90 0.90
Urea, % 0.94 0.94
-Monensin (Rumensin®) 0.03 0.03 0.04
* During the adaptation (first and second periods), roughage was represented by a mixture of corn silage AG-5011 (50%) plus sorghum silage AG-2002 (50%) and, in the last period, only corn silage.
cull females have the potential for meat production and should not be depreciated, as compared with males, traditionally more valued. Studies have shown interesting results on qualitative aspects of cull females carcasses compared with males. According to Luchiari Filho (2000), there is similarity between the yields of most valuable cuts and production of edible portions, while in a study of Coutinho Filho et al. (2006), the highest yields of more valuable cuts were observed for females compared with males of the Santa Gertrudis breed. Working with Braford steers and cull cows with the same degree of carcass fattening, Pascoal et al. (2009) observed that steers’ carcasses had lower yields of rump and loin, and lower yields of rump uk trim, striploin and rump cap. Carcasses of cows and steers were similar in the total yields of prepared meat cuts (77.8 vs. 77.6%), discarded bones (17.5 vs. 17.9%), discarded retails (4.54 vs. 4, 09%) and inherent losses (0.34 vs. 0.34%).
Other authors have clearly demonstrated the effect of maturity of animals (different ages or categories) on the percentage of primary cuts of the carcass, especially the pistolcut, which is higher in carcasses of young animals, as demonstrated by Restle et al. (2000) and Restle et al. (2001), evaluating Charolais heifers and cull cows, and Ferreira et al. (2009), in a study with crossbred Charolais × Nellore steers. In a comparison between males and females of similar age, Vaz et al. (2010b) and Santos et al. (2008) found similarities between the percentages of the forequarter and pistolcut, supporting the statements of Berg & Butterfield (1976), that differences in the development of front and rear are not evident when comparing castrated females with males of the same age.
For muscle, fat and bone components (Table 2), expressed as absolute values, there was significant difference between the categories, with lower averages for heifers. Between steers and cull cows, there was similarity of the tissues that compose the carcass, results that follow those found for cold carcass weight.
When these same tissues were expressed as percentage, similarity was observed between the means of the categories evaluated. The percentage of muscle ranged between 66.5 and 67.3% (P = 0.7732), fat from 18.5 to 19.1% (P = 0.8391) and bone from 14.6 to 15 , 0% (P = 0.7752). Townsend et al. (1990), who studied different Charolais categories, found that the percentage of muscle was similar between 2.5-year old steers and cull cows, with values of 68.3 and 64.9%, respectively.
According to Berg & Butterfield (1976) and Boogs & Merkel (1981), bone tissue has its greatest growth impulse in the early stage of development of the animal, while the adipose tissue happens in the most advanced stage of development, indicating that in the present study, heifers and steers (20 months old) reached bone development similar to that of cows (87 months). These authors report that during the growth phase of the animal, fat is the tissue with latest development, but it is deposited in all ages, since the energy consumption exceeds the required by the animal, although there are different stages of adipose tissue deposition (visceral, intermuscular, subcutaneous and intramuscular) (Di Marco, 1998). As the animals in this experiment were slaughtered under similar finishing, no difference in carcass fat content was expected. Studying Charolais steers slaughtered at different weights, Restle et al. (1997) observed that only at 495 kg did animals have
a,b,c Means followed by different letters, in the same row, differ (P<0.05) by Tukey’s test.
Characteristic Category P>F
Steers Heifers Cull cows
Cold carcass weight, kg 271.9a ± 7.4 194.5b ± 7.0 257.5a ± 7.0 0.0001
Pistolcut, kg 69.4a ± 2.1 51.4b ± 2.0 66.2a ± 2.0 0.0001
Forequarter, kg 50.1a ± 1.3 34.3c ± 1.2 46.3b ± 1.2 0.0001
Sidecut, kg 16.5a ± 0.7 11.5b ± 0.7 16.2a ± 0.7 0.0001
Pistolcut, % 51.0b ± 0.4 52.8a ± 0.4 51.4b ± 0.4 0.0191
Forequarter, % 36.9 ± 0.5 35.3 ± 0.5 36.0 ± 0.5 0.0852
Sidecut, % 12.1 ± 0.4 11.9 ± 0.3 12.6 ± 0.3 0.3131
Muscle, kg 180.6a ± 4.9 129.2b ± 4.4 173.2a ± 4.6 0.0001
Fat, kg 52.1a ± 2.8 35.5b ± 2.5 48.4a ± 2.6 0.0003
Bone, kg 40.5a ± 1.2 29.0b ± 1.1 37.5a ± 1.2 0.0001
Muscle, % 66.5 ± 0.8 67.0 ± 0.8 67.3 ± 0.8 0.7732
Fat, % 19.1 ± 0.7 18.5 ± 0.7 18.7 ± 0.7 0.8391
Bone, % 14.9 ± 0.4 15.0 ± 0.4 14.6 ± 0.4 0.7752
Muscle:bone relation 4.5 ± 0.2 4.5 ± 0.2 4.6 ± 0.2 0.8243 Muscle+fat:bone relation 5.8 ± 0.2 5.8 ± 0.2 5.9 ± 0.2 0.8400
higher fat percentage (19.4%) compared with animals slaughtered at 421 kg (15.5%) and 461 kg (16.5%). Vaz et al. (2002) reported that Hereford steers’ carcasses had higher percentage of muscle, less fat and similar bone percentage when compared with cull cows. Comparing feedlot finished Charolais × Nellore crossbred steers and cull cows, Cattelam et al. (2009) reported that cows’ carcasses showed higher participation of fat, while steers presented higher percentage of muscle.
In a comparison between males and females of the same age, Berg & Butterfield (1976) reported that heifers deposit fat with more intensity than steers. Other studies confirm earlier fat deposition in females, like those of Zinn et al. (1970), in research with Hereford heifers and steers, and Vaz et al. (2010b), comparing the carcass fat percentage of Braford heifers (23.87%) and steers (19.14%). Since the percentage of tissues that compose the carcass did not differ between the categories, the muscle:bone relation also showed similarity (P = 0.8243). Similarly, the muscle+fat:bone relation, which represents the edible portion of the carcass relative to the amount of bone, also did not differ statistically among steers, heifers and cull cows (P = 0.8400).
Evaluating the muscle:bone relation is important because it represents the quantity of the most desirable carcass tissue (muscle) compared with the non-used for human food (bone). In a study of carcasses from Braford steers and heifers slaughtered at similar age, Vaz et al. (2010a) noted no difference in the relations of muscle:bone and muscle+fat:bone relation and reported that the similarity in the ratios between the tissues of males and cull females is very important to the industry, since it neutralizes the costs of the industrial deboning yield. In their studies, Berg & Butterfield (1976) concluded that no differences are expected in muscle:bone and muscle+fat:bone relations between males and females of similar age and similar degree of finishing. However, Restle et al. (1997) observed differences for these characteristics in three-year old Charolais steers
slaughtered at different weights (421, 461 or 495 kg), mainly caused by variations in the percentage of bones. Differences between muscle:bone and muscle+fat:bone relations were verified by Vaz et al. (2002) in 2-year old steers and cull cows with average age of 8 years, as a result of variations in the percentages of muscle and fat in the carcass.
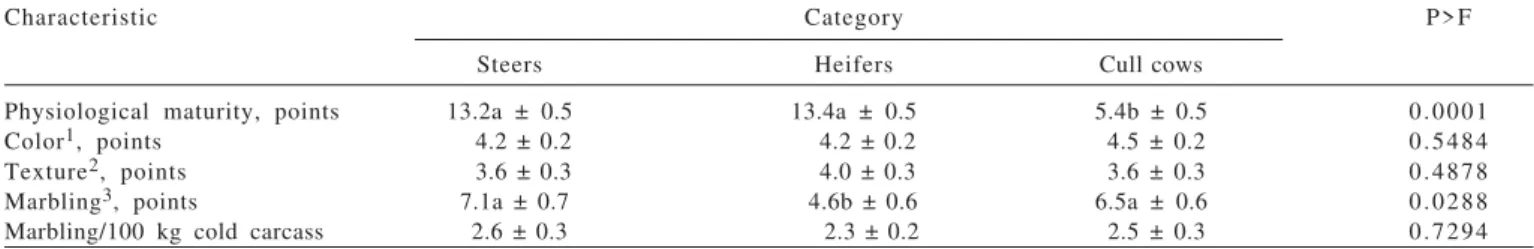
In the assessment of physiological maturity (Table 3), cull cows had more advanced maturity, confirming the wide range of age compared with steers and heifers (87 - 20 months).
The average ranking for the coloring of meat was between “red” and “bright red”, with no significant difference (P = 0.5484) between the categories assessed. According to Müller (1987), meat color is an important factor in the marketing, since the consumer rejects the meat with a darker color, although color does not affect the palatability or the organoleptic characteristics of meat. Merkel & Boggs (1981) noted that the color of the meat tends to become darker due to the increase in the amount of myoglobin with advancing age of animals, one of the disadvantages of the slaughter of adult animals. The results obtained by Restle et al. (1996) confirm this statement because, studying the characteristics related to Charolais meat of animals slaughtered at different weights, these authors found that from 421 to 461 kg live weight, the color of meat was classified as “red”, while for those slaughtered at 495 kg, fed for longer and therefore older, the meat was classified as “slightly dark red.”
The similarity in meat color of cull cows, steers and heifers in this experiment can be explained by the results of Cranwel et al. (1996), who studied the effect of re-feeding cull cows in confinement, and observed that feeding periods of 56 days with energetic diets are sufficient to promote reduction in the amount of myoglobin in the meat, resulting in lighter-colored meats. This is one of the factors reported by Hornick et al. (1998) for the variation in the color of meat. Besides the speed of weight gain, others would be animal age and high temperature of the meat during the first hours
post mortem, in addition to content of myoglobin, oxidation
Characteristic Category P>F
Steers Heifers Cull cows
Physiological maturity, points 13.2a ± 0.5 13.4a ± 0.5 5.4b ± 0.5 0.0001
Color1, points 4.2 ± 0.2 4.2 ± 0.2 4.5 ± 0.2 0.5484
Texture2, points 3.6 ± 0.3 4.0 ± 0.3 3.6 ± 0.3 0.4878
Marbling3, points 7.1a ± 0.7 4.6b ± 0.6 6.5a ± 0.6 0.0288 Marbling/100 kg cold carcass 2.6 ± 0.3 2.3 ± 0.2 2.5 ± 0.3 0.7294 1Variation 1 to 5: 1 = dark, 3 = slightly dark red and 5 = bright red (Müller, 1987).
2Variation 1 to 5: 1 = very coarse and 5 = very fine (Müller, 1987). 3Variation 1 to 18: 1-3 = traces, 4-6 = light, 7-9 = small (Müller, 1987).
a,b Means followed by different letters in the same row differ (P<0.05) by Tukey’s test.
state of the pigments (Gatellier et al., 2005), levels of glycogen pre-slaughter and marbling (Mancini & Hunt, 2005). Vestergaard et al. (2000) reported that forage-based diets may promote increased oxidative metabolism compared with the anaerobic of the muscle, and glycogen storage, resulting in meat with less glycogen, greater value of muscle pH and darker meat compared with animals fed concentrate diets. In Simmental × Charolais crossbred animals, French et al. (2001) found that the color of meat did not change regarding different proportions of roughage and concentrate in the diet. However, when analyzing factors that influence the meat color of crossbred Angus × Hereford × Brahmam steers, Bidner et al. (1981) and Bidner et al. (1986) found darker meat in animals fed roughage-based diets compared with those fed diets based on concentrate, and attributed this result to higher concentration of myoglobin in the meat. Also, Allen & Keane (1998) noted darker (lower L* value) and less red (lower value of a*) meat in Charolais × Friesian animals managed in an extensive system, compared with those managed in semi-intensive and extensive systems.
Vaz et al. (2010a) found similar meat coloration for Braford steers and heifers (4.56 vs. 4.52 points, respectively) slaughtered at the same age. Similar results are reported by Restle et al. (2001), who studied the quality characteristics of Charolais heifers and cull cows meat, and found values of 3.47 and 3.72 points, respectively. Vaz et al. (2002) also found no significant difference in meat color when comparing Hereford cull cows and steers.
In relation to meat texture, no significant difference (P = 0.4878) was observed between the different categories. Values ranged between 4.2 and 4.5 points, which allows to classify themselves as “fine” to “very fine”, representing an excellent result for the cull cow category. The results of this experiment are consistent with several studies of different breeds, ages and categories, such as Restle et al. (1996), comparing Charolais animals slaughtered at different weights,Vaz et al. (2002) working with Hereford cows and steers and Townsend et al. (1990) evaluating cull cows and 2.5 years old steers. However, Müller et al. (1984) found for Devon and Charolais steers slaughtered at 2.5 years of age finer texture compared with cull cows of the same genotype. In a study conducted by Restle et al. (2001), Charolais heifers with average age of 3 years had finer texture compared with cull cows with average age of eight years, from the same genetic group.
Significant differences (P = 0.0288) for marbling score were found among the categories. Steers and cull cows were similar to each other (7.1 and 6.5 points respectively) and had higher values than heifers (4.6 points). The correlation between the percentage of fat in the carcass and marbling
score was positive and significant (r = 0.41, P <0.05) (Table 5). Restle et al. (1996) found a correlation coefficient of 0.26 between marbling and percentage of fat in the carcass. These authors remarked that the degree of marbling in meat is more associated with carcass weight than subcutaneous fat, or percentage of fat in the carcass, which was also observed in this experiment, in which the coefficient of correlation between marbling and cold carcass weight was 0.59 (Table 5). Correcting the marbling score for 100 kg of cold carcass, the differences between the categories no longer existed, and the values ranged between 2.3 and 2.6 kg points/100 of cold carcass (Table 3). Van Koevering et al. (1995) added that the deposition of intramuscular fat increases to a certain period of the finishing, when the animal reaches its genetic potential for marbling accumulation, as a result of its genetics and size at maturity. Vaz et al. (2002) verified higher degree of marbling score (7.25 points), higher slaughter weight and higher percentage of fat in the carcass of Hereford cull cows compared with steers of the same breed (4.33 points), in agreement with results obtained by Restle et al. (2001), who observed higher degree of marbling score in Charolais cull cows than in heifers. However, in a study by Townsend et al. (1990), comparing 2.5-year old Charolais steers and cull cows, the degree of marbling score was similar in both categories, so they could be classified as “light.”
Analyzing steers and heifers, the values of marbling score obtained in this experiment differ somewhat from the results obtained by various researchers, who compared steers and heifers of the same age under the same management conditions and feeding, and observed that females had more intramuscular fat deposition compared with males (Berg & Butterfield, 1976, Falkner et al., 1989). Vaz et al. (2010a, b) reported marbling score and carcass fat percentage in females higher than in males of the same age.
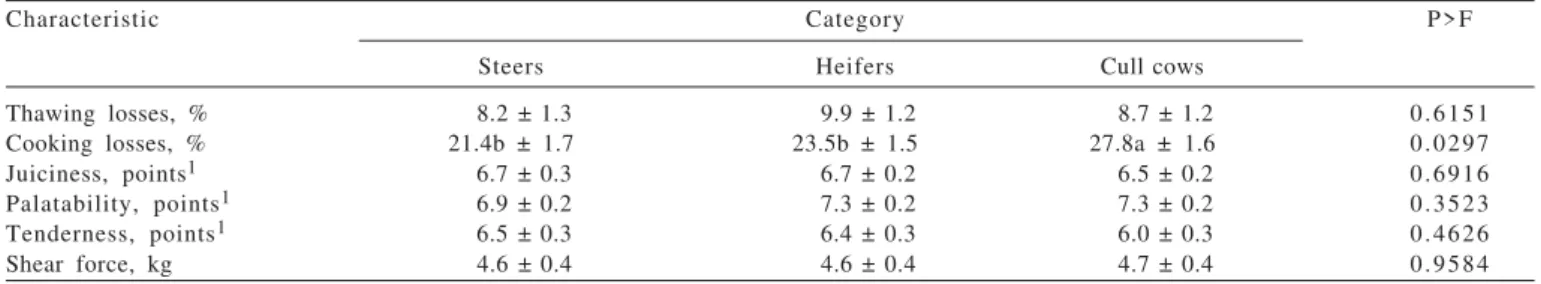
The losses during the thawing process of meat were statistically similar (P = 0.6151) between steers, heifers and cull cows, with values ranging between 8.2 and 9.9% (Table 4). During the cooking process of meat, the losses for cull cows (27.8%) were higher than for steers (21.4%) and heifers (23.5%).
concluded that, as the slaughter weight increased, the loss of thawing showed opposite behavior, so that the correlation coefficient between slaughter weight and losses at thawing was -0.54. In this study, the correlation between cold carcass weight (CCW) and losses during thawing and between CCW and cooking losses were not significant.
Despite the negative correlation of -0.53 (P<0.01) between cooking loss and juiciness of meat, no difference was detected between categories for meat juiciness, so meat juiciness was classified as “above average”, with values ranging between 6.5 and 6.7 points. Townsend et al. (1990) noticed lower cooking loss and higher juiciness for Charolais steers slaughtered at two years in comparison with those slaughtered at three years.
The subjective evaluation of meat palatability by the panel of tasters showed that there was no significant difference between steers, heifers and cull cows, indicating meat palatability classified as “above average”. Similar behavior was observed for meat tenderness, both by the panel of tasters, and the shear force of muscle fibers measured by the WB-shear device. According to the scoring, ranging between 6.0 and 6.5 points, the tenderness was classified as “slightly above average”.
For all meat sensory characteristics (tenderness, juiciness and palatability), the cull cows presented grading considered excellent for a category of high maturity. Several studies confirm that beef tenderness is inversely related to age at slaughter. Compiling several studies conducted in Brazil, Restle et al. (1999) and Restle & Vaz (2003) reported that by reducing the age of slaughter, the tenderness of meat increased. According to research carried out by Koohmaraie et al. (2002), consumers considered meat tenderness as the most important qualitative component, a fact easily confirmed in countries like the U.S., by the positive relationship between the price of a meat cut and its relative tenderness, so the consumer is willing to pay more for meat with guaranteed tenderness.
A possible explanation for the similar tenderness values between cull cows, steers and heifers in this experiment can be obtained from the results of Cranwell et al. (1996), which assessed feeding periods on meat characteristics of cull cows with more than 5 years of age, reporting that feeding for 28 and 56 days increased the palatability, tenderness and amount of connective tissue. Besides, from 28 to 56 days, there was an increase in visual estimation of color and texture of meat. These authors commented that the increase in meat tenderness can be attributed to the increase in the amount of connective tissue and the percentage of soluble collagen, in agreement with Aberle et al. (1981), who concluded that Charolais × Shorthorn and Hereford × Angus cattle fed for 70 days with high energy diets showed rapid protein synthesis, resulting in meat with high proportion of soluble collagen. These authors found that the high rate of weight gain may be more determinant of beef tenderness than the duration of the finishing diet, and this suggests that the growth rate of gain during pre-slaughter affects the stability of the connective tissue, facilitating the fragmentation of myofibrils during muscle post-mortem, which is correlated with meat tenderness. During rapid growth, protein synthesis is increased, with new collagen synthesis occurring, which may represent a higher proportion of total collagen in the muscle, resulting in collagen fibers less stable with higher solubility, contributing this way to higher meat tenderness.
In a study by Miller et al. (1987) it was observed that with the supply of energetic diets for steers and cull cows, there was an increase in the percentage of soluble collagen of meat. Boleman et al. (1996) found that cull cows, fed for 84 days showed lower amount of connective tissue than cows fed 0, 28 or 56 days, and this proves that the intensive pre-slaughter feeding causes increased levels of soluble collagen. In addition, there was an increase in juiciness and palatability of meat. In a study by Hornick et al. (1998), even in young animals of the Belgian Blue breed, there was
Characteristic Category P>F
Steers Heifers Cull cows
Thawing losses, % 8.2 ± 1.3 9.9 ± 1.2 8.7 ± 1.2 0.6151
Cooking losses, % 21.4b ± 1.7 23.5b ± 1.5 27.8a ± 1.6 0.0297
Juiciness, points1 6.7 ± 0.3 6.7 ± 0.2 6.5 ± 0.2 0.6916 Palatability, points1 6.9 ± 0.2 7.3 ± 0.2 7.3 ± 0.2 0.3523 Tenderness, points1 6.5 ± 0.3 6.4 ± 0.3 6.0 ± 0.3 0.4626
Shear force, kg 4.6 ± 0.4 4.6 ± 0.4 4.7 ± 0.4 0.9584
1 Variation 1 to 9, where: 1 = no juiciness, tasteless, extremely tough; 9 = extremely juicy, extremely flavorful, extremely soft (Müller, 1987).
a,b Means followed by different letters in the same row differ by Tukey test (P<0.05).
smaller amount of connective tissue than in animals refed after food restriction, showing high rates of weight gain, expressed by compensatory growth.
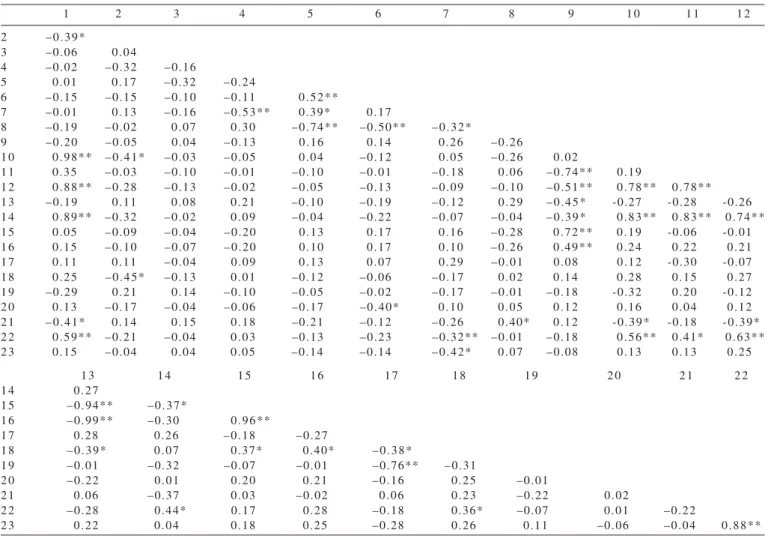
The sensory characteristics of meat were positively correlated with each other (Table 5), indicating that tender meat is also juicy and tasty, agreeing with results
of Wheeler et al. (1996), Vaz et al. (2002), Pacheco et al. (2005) and Vaz et al. (2010a). It was also observed that the evaluation of meat tenderness conducted by the panel of tasters was negatively correlated with high magnitude of tenderness measured by shearing force (-0.74), indicating reliability of the subjective evaluation of this characteristic.
1 2 3 4 5 6 7 8 9 1 0 1 1 1 2
2 –0.39*
3 –0.06 0.04
4 –0.02 –0.32 –0.16
5 0.01 0.17 –0.32 –0.24
6 –0.15 –0.15 –0.10 –0.11 0.52**
7 –0.01 0.13 –0.16 –0.53** 0.39* 0.17
8 –0.19 –0.02 0.07 0.30 –0.74** –0.50** –0.32*
9 –0.20 –0.05 0.04 –0.13 0.16 0.14 0.26 –0.26
1 0 0.98** –0.41* –0.03 –0.05 0.04 –0.12 0.05 –0.26 0.02
1 1 0.35 –0.03 –0.10 –0.01 –0.10 –0.01 –0.18 0.06 –0.74** 0.19
1 2 0.88** –0.28 –0.13 –0.02 –0.05 –0.13 –0.09 –0.10 –0.51** 0.78** 0.78** 1 3 –0.19 0.11 0.08 0.21 –0.10 –0.19 –0.12 0.29 –0.45* -0.27 -0.28 -0.26 1 4 0.89** –0.32 –0.02 0.09 –0.04 –0.22 –0.07 –0.04 –0.39* 0.83** 0.83** 0.74** 1 5 0.05 –0.09 –0.04 –0.20 0.13 0.17 0.16 –0.28 0.72** 0.19 -0.06 -0.01 1 6 0.15 –0.10 –0.07 –0.20 0.10 0.17 0.10 –0.26 0.49** 0.24 0.22 0.21 1 7 0.11 0.11 –0.04 0.09 0.13 0.07 0.29 –0.01 0.08 0.12 -0.30 -0.07 1 8 0.25 –0.45* –0.13 0.01 –0.12 –0.06 –0.17 0.02 0.14 0.28 0.15 0.27 1 9 –0.29 0.21 0.14 –0.10 –0.05 –0.02 –0.17 –0.01 –0.18 -0.32 0.20 -0.12 2 0 0.13 –0.17 –0.04 –0.06 –0.17 –0.40* 0.10 0.05 0.12 0.16 0.04 0.12 2 1 –0.41* 0.14 0.15 0.18 –0.21 –0.12 –0.26 0.40* 0.12 -0.39* -0.18 -0.39* 2 2 0.59** –0.21 –0.04 0.03 –0.13 –0.23 –0.32** –0.01 –0.18 0.56** 0.41* 0.63** 2 3 0.15 –0.04 0.04 0.05 –0.14 –0.14 –0.42* 0.07 –0.08 0.13 0.13 0.25
1 3 1 4 1 5 1 6 1 7 1 8 1 9 2 0 2 1 2 2
1 4 0.27
1 5 –0.94** –0.37*
1 6 –0.99** –0.30 0.96**
1 7 0.28 0.26 –0.18 –0.27
1 8 –0.39* 0.07 0.37* 0.40* –0.38*
1 9 –0.01 –0.32 –0.07 –0.01 –0.76** –0.31
2 0 –0.22 0.01 0.20 0.21 –0.16 0.25 –0.01
2 1 0.06 –0.37 0.03 –0.02 0.06 0.23 –0.22 0.02
2 2 –0.28 0.44* 0.17 0.28 –0.18 0.36* –0.07 0.01 –0.22
2 3 0.22 0.04 0.18 0.25 –0.28 0.26 0.11 –0.06 –0.04 0.88**
*P<0.05; **P<0.01.
1 = cold carcass weight, kg; 2 = physiological maturity, points; 3 = thawing loss, %; 4 = cooking loss, %; 5 = tenderness, points, 6 = palatability, points, 7 = juiciness, points; 8 = shear, kg; 9 = muscle, %; 10 = muscle, kg; 11 = fat, %; 12 = fat, kg; 13 = fat/100 kg cold carcass; 14 = bone, %; 15 = bone, kg = 16 muscle:bone relation, 17 = muscle+fat:bone relation; 18 = forequarter, %; 19 = sidecut, %; 20 = pistolcut, %; 21 = color, points; 22 = texture, points; 23 = marbling, points; 24 = marbling/100 kg cold carcass.
Table 5 - Correlation coefficients between carcass traits and meat of Charolais cattle
Conclusions
The percentage of pistolcut of heifers is higher than that of steers and cull cows. When Charolais cattle are slaughtered with similar degree of finishing, the percentages of muscle, fat and bone of the carcass show no difference between these categories, a fact that proves the potential of cull cows of this genetic group to produce carcass and meat with quality.
References
ABERLE, E.D.; REEVES, E.S.; JUDGE, M.D. et al. Palatability and muscle characteristics of cattle with controlled weight gain: Time on a high energy diet. Journal of Animal Science, v.52, p.757, 1981.
ARBOITTE, M.Z.; RESTLE, J.; ALVES FILHO, D.C. et al. Características da carcaça de novilhos 5/8 Nelore – 3/8 Charolês abatidos em diferentes estádios de desenvolvimento. Revista Brasileira de Zootecnia, v.33, n.4, p.969-977, 2004. BERG, R.T.; BUTTERFIELD, R.M. New concepts of cattle
BIDNER, T.D.; SCHUPP, A.R.; MOHAMAD, A.B. et al. Acceptability of beef from Angus x Hereford or Angus x Hereford x Brahman steers finished on all-forage or a high energy diet. Journal of Animal Science, v.63, p.381-387, 1986.
BIDNER, T.D.; SCHUPP, A.R.; MONTGOMERY, R.E. et al. Acceptability of beef finished on all-forage, forage-plus- grain or high energy diets. Journal of Animal Science, v.53, p.1181-1187, 1981.
BOLEMAN, S.J.; MILLER, R.K.; BUYCK, M.J. Influence of realimentation of mature cows on maturity, color, collagen solubility, and sensory characteristics. Journal of Animal Science, v.74, p.2187-2194, 1996.
BOOGS, D.L.; MERKEL, R.A. Live animal: Carcass evaluation and selection manual. Iowa: Michigan State University, 1981. 199p. CATTELAM, J.; MENEZES, L.F.G.; FERREIRA, J.J. et al. Composição física da carcaça e qualidade da carne de novilhos e vacas de descarte de diferentes grupos genéticos submetidos a diferentes frequências de alimentação. Ciência Animal Brasileira, v.10, n.3, p.764-775, 2009.
COSTA, E.C.; RESTLE, J.; VAZ, F.N. et al. Características da carcaça de novilhos Red Angus superprecoce abatidos com diferentes pesos. Revista Brasileira de Zootecnia, v.31, n.1, p.119-128, 2002.
COUTINHO FILHO, J.L.V.; PERES, R.M.; JUSTO, C.L. et al. Produção de carne de bovines contemporaneous, machos e fêmeas, terminados em confinamento. Revista Brasileira de Zootecnia, v.35, n.5, p.2043-2049, 2006.
CRANWELL, C.D.; UNRUH, J.A.; BRETHOUR, J.R. et al. Influence of steroid implants and concentrate feeding on carcass and longissimus muscle sensory and collagen characteristics o f c u l l b e e f c o w s . J o u r n a l o f A n i m a l S c i e n c e, v. 7 4 , p.1777-1783, 1996.
Di MARCO, O.N. Crecimiento de vacunos para carne. Mar Del Plata, 1996. 246p.
FALKNER, D.B.; McKEITH, F.K.; BERGER, L.L. et al. Effect of testosterone propionate on performance and carcass characteristics of heifers and cows. Journal of Animal Science, v.67, p.1907, 1989.
FERREIRA, J.J.; MENEZES, L.F.G.; RESTLE, J. et al. Características de carcaça de vacas de descarte e novilhos mestiços Charolês × Nelore em confinamento sob diferentes frequências de alimentação. Revista Brasileira de Zootecnia, v.38, n.10, p.1974-1982, 2009.
FRENCH, P.; RIORDAN, E.G.O.; MONAHAN, F.J. et al. The eating quality of meat from steers fed grass and/or concentrates. Meat Science, v.57, n.4, p.379-386, 2001.
GATELLIER, P.; MERCIER, Y.; JUIN, H. et al. Effect of finishing mode (pasture- or mixed-diet) on lipid composition, colour stability and lipid oxidation in meat from Charolais cattle. Meat Science, v.69, p.175-186, 2005.
HANKINS, O.G.; HOWE, P.E. Estimation of the composition of beef carcass and cuts. Whashington: United State Departament of Agriculture, 1946. (Technical Bulletin, 926). 19p.
HORNICK, J.L.; VAN EANAEME, C.; CLINQUART, A. et al. Different periods of feed restriction before compensatory growth in Belgian Blue bulls: I. Animal performance, nitrogen balance, meat characteristics, and fat composition. Journal of Animal Science, v.76, n.1, p.249-259, 1998.
KEANE, M.G.; ALLEN, P. Effects of production system intensity on performance, carcass composition and meat quality of beef cattle. Livestock Production Cattle, v.56, p.203-214, 1998. KOOHMARAIE, M.; WHEELER, T.L.; SHACKELFORD, S.D. Beef tenderness: regulation and prediction. Meat Animal Research Center, USDA-ARS, Clay Center, 2002. 11p.
KUSS, F.; RESTLE, J.; BRONDANI, I.L. et al. Características da carcaça de vacas de descarte de diferentes grupos genéticos terminadas em confinamento com distintos pesos. Revista Brasileira de Zootecnia, v.34, n.3, p.915-925, 2005. LUCHIARI FILHO, A. Pecuária da carne bovina. São Paulo: A.
Luchiari Filho, 2000. 134p.
MANCINI, R.A.; HUNT, M.C. Current research in meat color. Meat Science, v.71, p.100-121, 2005.
MILLER, M.F.; CROSS, H.R.; CROUSE, J.D. et al. Effect of feed energy intake on collagen characteristics and muscle quality of mature cows. Meat Science, v.21, p.287, 1987.
MÜLLER, L. Normas para avaliação de carcaças e concurso de carcaças de novilhos. 2.ed. Santa Maria: UFSM, Imprensa Universitária, 1987. 31p.
MÜLLER, L.; GRASSI, C.; RESTLE, J. Comparision between carcass quality from steers and cows. In: INTERNATIONAL CONGRESS OF MEAT SCIENCE AND THECNOLOGY, 30., 1984, Bristol, Inglaterra. Proceedings... [S.l.: s.n.], 1984. MÜLLER, L.; MAXON, W.E.; PALMER, A.Z. et al. Evaluación de técnicas para determinar la composición de la canal In: ALPA, 1973, Guadalajara-México. Anais... Guadalajara: (s.n.), 1973. MÜLLER, L.; ROBAINA, G.P. Qualidade da carne de novilhos de raças britânicas de idade cronológica diferentes. In: REUNIÃO ANUAL DA SOCIEDADE BRASILEIRA DE ZOOTECNIA, 18., 1981, Goiânia. Anais... Goiânia: SBZ, 1981. p.391. PACHECO, P.S.; RESTLE, J.; SILVA, J.H.S. et al. Composição
física da carcaça e qualidade da carne de novilhos jovens e superjovens de diferentes grupos genéticos. Revista Brasileira de Zootecnia, v.34, n.5, p.1691-1703, 2005.
PASCOAL, L.L.; LOBATO, F.P.; RESTLE, J. et al. Meat yield of culled cow and steer carcasses. Revista Brasileira de Zootecnia, v.38, n.11, p.2230-2237, 2009.
RESTLE, J.; BRONDANI, I.L.; BERNARDES, R.A.C. O novilho superprecoce. In: RESTLE, J. (Ed.) Confinamento, pastagens e suplementação para produção de bovinos de corte. Santa Maria: Imprensa Universitária, 1999. p.191-214.
RESTLE, J.; CERDÓTES, L.; VAZ, F.N. et al. Características da carcaça e da carne de novilhas e vacas de descarte Charolês, terminadas em confinamento. Revista Brasileira de Zootecnia, v.30, n.3, p.1065-1073, 2001.
RESTLE, J.; KEPLIN, L.A.S.; VAZ, F.N. Características quantitativas da carcaça de novilhos Charolês, abatidos com diferentes pesos. Pesquisa Agropecuária Brasileira, v.32, n.8, p.851-856, 1997.
RESTLE, J.; KEPLIN, L.A.S.; VAZ, F.N. et al. Qualidade da c a r n e d e n o v i l h o s C h a r o l ê s c o n f i n a d o s e a b a t i d o s c o m diferentes pesos. Ciência Rural, v.32, n.8, p.463-466, 1996. RESTLE, J.; PASCOAL, L.L.; FATURI, C. Efeito do grupo genético e da heterose nas características quantitativas da carcaça de vacas de descarte terminadas em confinamento. R e v i s t a Brasileira de Zootecnia, v.31, n.1, p.350-362, 2002 (supl.). RESTLE, J.; ROSO, C.; OLIVEIRA, A.N. et al. Suplementação energética para vacas de descarte de diferentes idades em terminação em pastagem cultivada de estação fria sob pastejo h o r á r i o . R e v i s t a B r a s i l e i r a d e Z o o t e c n i a, v. 2 9 , n . 4 , p.1216-1222, 2000.
RESTLE, J.; VAZ, F.N. Eficiência e qualidade na produção de carne bovina. In: REUNIÃO ANUAL DA SOCIEDADE BRASILEIRA DE ZOOTECNIA, 40., 2003, Santa Maria. Anais... Santa Maria: Sociedade Brasileira de Zootecnia [2003], 34p. (CD-ROM). SANTOS, A.P.; BRONDANI, I.L.; RESTLE, J. et al. Características
quantitativas da carcaça de novilhos jovens e superjovens com peso de abate similares. Ciência Animal Brasileira, v.9, n.2, p.300-308, 2008.
STATISTICAL ANALYSIS SYSTEM - SAS. User´s guide. Version 6.2. Cary, NC: SAS Institute Incorporation, 1997. 1042p. TOWSEND, M.R.; RESTLE, J.; PASCOAL, L.L. et al. Avaliação
quantitativa das carcaças de novilhos vacas terminadas em c onf i na m e n t o. I n : R E UN I Ã O AN U A L D A S O CI E D A D E BRASILEIRA DE ZOOTECNIA, 27., 1990, Campinas. Anais... Campinas: ESALQ, 1990. p.362.
L o n g i s s i m u s muscles. J o u r n a l o f A n i m a l S c i e n c e, v.73, p.21-28, 1995.
VAZ, F.N.; ARBOITTE, M.Z.; PASCOAL, L.L. et al. Características de carcaça e da carne de novilhos e novilhas Braford superjovens, terminados com suplementação em pastagem cultivada. Ciência Animal Brasileira, v.11, n.1, p.46-56, 2010a.
VAZ, F.N.; RESTLE, J.; ARBOITTE, M.Z. et al. Fatores relacionados ao rendimento de carcaça de novilhos ou novilhas superjovens, terminados em pastagem cultivada. Ciência Animal Brasileira, v.11, n.1, p.57-65, 2010b.
VAZ, F.N.; RESTLE, J.; QUADROS, A.R.B. et al. Características da carcaça e da carne de novilhos e de vacas de descarte Hereford,
terminados em confinamento. Revista Brasileira de Zootecnia, v.31, n.3, p.1501-1510, 2002.
VESTERGAARD, M.; OKSBERG, N.; HENCKEL, P. Influence of feeding intensity, grazing and finishing feeding on muscle fibre characteristics and meat colour of semitendinosus, longissimus dorsi and supraspinatus muscles of young bulls. Meat Science, v.54, n.2, p.177-185, 2000.