Received October 1, 2007 and accepeted July 4, 2008. Corresponding author: [email protected]
* Current address: Universidade Federal de Roraima, Boa Vista, RR. ISSN 1806-9290 (on-line)
www.sbz.org.br
Bio-economicity of the finishing phase on feedlot of crossbred young bulls
slaughtered at different body weights
Renius Mello1*, Flávio Dutra de Resende2, Augusto César de Queiroz3, Marcelo Henrique de
Faria2, André Soares de Oliveira1, Gustavo Rezende Siqueira2
1Programa de Pós-Gradução em Zootecnia/Departamento de Zootecnia/UFV.
2APTA - Pólo Regional do Desenvolvimento Tecnológico dos Agronegócios da Alta Mogiana, Colina, SP. 3Departamento de Zootecnia/UFV.
ABSTRACT - T h e objective in this work was to evaluate the economicity of the finishing phase on feedlot of F1 Red Angus × Nellore (½ RA ½ N) and Blond D’Aquitaine × Nellore (½ BA ½ N) crossbred young bulls slaughtered at 480, 520 and 560 kg of body weight. Thirty-six F1 crossbred young bull with 20 months of initial average age: 18 ½RA½ N and 18 ½N½ BA were allotted to a completely randomized design in a 2 ×3 factorial arrangement (genetic group × slaughter weight), with six replicates. The ½ BA ½ N young bulls slaughtered at 480 kg had the highest carcass gain (kg/day), feed efficiency, gross income (R$/day), gross profit of feed (R$/day), break-even cost of the diet (@/t DM) and cost:benefit ratio. The ½ BA ½ N young bulls also had higher dressing percentage than ½ RA ½ N young bulls. As the slaughter weight rised the dressing percentage, feed:gain ratio, feed cost (R$/@ and R$/day) and break-even point (kg/day) increased; while the gross feed profit (R$/@) decreased. The bioeconomic multivariate nutritional index had better association with the profitability of the finishing phase of beef cattle on feedlot. Sensitivity analysis did not influence the results obtained. The benefit was lower than the feed cost from exchange relation of four (4) @/t DM of the diet. F1 Blond D’Aquitaine × Nellore crossbred young bulls slaughtered at 480 kg of body weight showed the best bioeconomic efficiency.
Key Words: beef cattle, bioeconomic analysis, economic feasibility, profitability, sensitivity analysis
Bioeconomicidade da fase de terminação em confinamento de bovinos
mestiços abatidos com diferentes pesos
RESUMO - Objetivou-se verificar a economicidade da fase de terminação em confinamento de tourinhos mestiços F1 Red Angus × Nelore (½ RA ½ N) e F1 Blonde D’Aquitaine ×Nelore (½ BA ½ N) abatidos com 480, 520 e 560 kg de peso corporal. Trinta e seis bovinos mestiços F1, tourinhos, com 20 meses de idade média inicial: 18 ½ RA ½ N e 18 ½ BA ½ N foram distribuídos a um delineamento experimental inteiramente casualizado em arranjo fatorial 2 × 3 (grupos genético × peso de abate), com seis repetições. Os tourinhos ½ BA ½ N abatidos com 480 kg apresentaram maior ganho de carcaça (kg/dia), eficiência alimentar, valor de produção (R$/dia), saldo de alimentação (R$/dia), custo de nivelamento da dieta (@/t MS) e relação benefício:custo. O rendimento de carcaça dos tourinhos ½ BA ½ N foi maior que o dos tourinhos ½ RA ½ N. À medida que se elevou o peso de abate, o rendimento de carcaça, a conversão alimentar, o custo de alimentação (R$/@ e R$/dia) e o ponto de nivelamento da dieta (kg/dia) aumentaram; ao passo que o saldo de alimentação (R$/@) diminuiu. O índice nutricional multivariado bioeconômico indicou melhor associação com a rentabilidade da fase de terminação de bovinos em confinamento. A análise de sensibilidade não influenciou os resultados obtidos. O benefício foi menor que o custo de alimentação se considerada a relação de troca a partir de 4 @/t MS da dieta. Tourinhos mestiços F1 Blonde D’Aquitaine × Nelore abatidos com 480 kg de peso corporal apresentam melhor eficiência bioeconômica.
Palavras-chave: análise bioeconômica, análise de sensibilidade, bovinos de corte, rentabilidade, viabilidade econômica
Introduction
Feedlot is used worldwide to produce meat in a d v e r s e c o n d i t i o n s a n d i n c r e a s e p r o d u c t i v i t y . However, the performance and nutritional efficiency of feedlot cattle are influenced, among other factors,
Researchers report that Zebu breeds generally have lower growth rate and produce lighter and lower-quality carcasses (Cruz et al., 2004), beyond have greater variability than European breeds (Menezes et al., 2005b). In this context, the crossing between zebu and taurine breeds have confirmed advantages of crossbred animals on purebreed in some characteristics of economic importance, which demonstrates the benefits of heterosis, complementariness and rapid incorporation of desirable genetic material (Menezes et al., 2005a). Additionally, it is well known that in the F1 animals, the heterozygosity is 100% and maximum heterosis.
The Brazilian beef industry values the body weight and finishing degree of cattle, which are correlated to the operational cost and carcass yield. However, data from literature showed that evaluations of genotypes are compromised when the slaughter end point is defined through a fixed body weight, since the expression of finishing differences and conditions among breeds are limited (Williams & Bennett, 1995; Amer et al. , 1997; Euclides Filho et al., 1997).
The economic analysis of production systems is essential to help the producer to make decisions and to guide the selection of programmers. According to Faturi et al. (2003), the economic evaluation of feeding costs of finishing cattle in feedlot, which represent over 70% of the total production cost, when the cost for the acquisition of animals is not considered (Pacheco et al., 2006), is funda-mental, because not always the best biological response is the best economic response. Amer et al. (1994) mentioned that the increase in profit, compared to fixed points, is a more appropriate slaughter criterion to compare genotypes. Thus, studies to evaluate the relationship between biological and economic responses of different genotypes (Pacheco et al., 2006) and slaughter weights (Restle et al., 2007) are important to increase the animal performance index and to improve the activity profitability. In this context, this study aimed to evaluate the economic response of feedlot finishing of F1 Bos taurus taurus × Bos taurus indicus crossbred bulls slaughtered at different body weights.
Material and Methods
The experiment was conducted at the “Agência Paulista de Tecnologia dos Agronegócios” (APTA), Pólo Regional do Desenvolvimento Tecnológico dos Agronegócios da Alta Mogiana, located in the municipality of Colina, state of Sao Paulo, Brazil.
Thirty-six F1 crossbred young bull were used, with 20 months of initial average age: 18 Red Angus × Nellore (½RA½ N) and 18 Blonde D’Aquitaine × Nellore (½N½ BA). Data evaluated in this study were obtained in accordance with procedures described by Mello (2007).
The treatments were composed of two genetic groups (GG): ½ RA½ N and ½ N½ BA and three slaughter weights (SW): 480, 520 and 560 kg of fasting body weight. A completely randomized experimental design in a 2 × 3 factorial arrangement (two genetic groups × three slaughter weights) was used, with six replications, according to the statistical model: Yijk =µ + αi + βj + (αΒ)ij + εijk, where Yijk = value observed in the i-th genetic group, j-th slaughter weight and k-th replication; µ = overall mean of variable response; αi= effect of the i-th genetic group;
βj = effect of the j-thslaughter weight; (αΒ)ij = effect of the interaction between i-th genetic group and j-thslaughter weight; εijk = random effect associated with observation
ijk
Y , assuming
(
2)
0
σ
ε
~
N ,iid
ijk , following normal ordinary linear model of Gauss-Markov (Graybill, 1976). The experimental diet was formulated according to the NRC (1996) to meet the maintenance requirementsof beef cattle with 420 kg of body weight and weight gain of 1.3 kg/day (Table 1).
The marketing value of fatty beef used for economic analysis was the average price of R$ 55.00 per arroba in May 2007 (Centre for Advanced Studies in Applied Economics - CEPEA, 2007), where one arroba (@) is equal to 15 kg of carcass.
The dressing percentage (DP) was expressed in relation to the hot carcass weight. Carcass gain was expressed by total period (TCG) and daily (DCG) and its relationship with the weight gain (CWR).
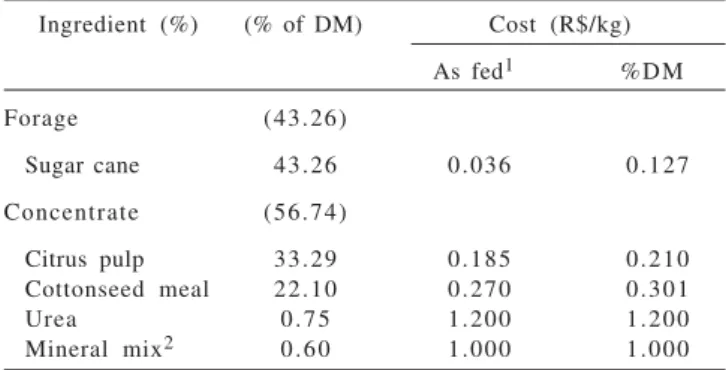
Table 1 - Composition and cost of the experimental diet
Ingredient (%) (% of DM) Cost (R$/kg)
As fed1 %DM
Forage (43.26)
Sugar cane 43.26 0.036 0.127
Concentrate (56.74)
Citrus pulp 33.29 0.185 0.210
Cottonseed meal 22.10 0.270 0.301
Urea 0 . 7 5 1.200 1.200
Mineral mix2 0 . 6 0 1.000 1.000
1Source: Scot Consultoria (2007).
The nutritional performance was measured by feed conversion (FC) and feed efficiency (FE). These quotient indices were calculated by non-linear combination of voluntary dry matter intake and daily carcass gain.
From the nutritional and economic point of view, animals were evaluated by the bioeconomic index (BEI) and bioeconomic multivariate nutritional index (BEMNI); obtained by linear combination of continuous dependent random variables, and correlated with normal probability distribution as follows:
⇒ × − = ijk ij ijk ijk y W x
BEI = − × ijk ⇒
ij ij ijk
ijk x
SP FP y BEI
ijk ijk ijk y EDI
BEI = −
GG; , 1,
i= L
∀ ∀ j=1,L,SWand k 1, ,r
(
replications)
;i L = ∀ 1
W 0 that
so < ij< .
where: BEIijk = bioeconomic index of the k-th replication in the i-th genetic group and j-th slaughter weight; yijk = daily carcass gain (DCG, kg/day) of the k-th replication in the i-th genetic group and j-th the slaughter weight; xijk = voluntary dry matter intake (DMI, kg/day) of the k-th replication in the i-th genetic group and j-th is the slaughter weight; Wij = relation of unit prices between diet and animal transformation for each treatment involved in the experiment; FPij and SPij are, respectively, the feed price (R$/kg of DM of diet) and sale price (R$/kg of carcass) in the i-th genetic group and j-th slaughter weight; EDIijk = equivalent diet intake of the k-th replication in the i-th genetic group and j-th slaughter weight, expressed economically as part of animal transformation. In this study, Wij was constant, because the composition of the diet is the same for all treatments. Thus, W = FP/SP = 0.21/3.67 = 0.0572 thus BEI = DCG - 0.0572 × DMI.
For the BEMNI calculation, a multivariate analysis of variance (MANOVA) was used (Johnson & Wichern, 1998; Khattree & Naik, 1999; Khattree & Naik, 2000), complemented by the first canonical Fisher’s discriminant function (Mardia et al., 1997). Thus, data of daily carcass gain and equivalent diet intake were submitted to MANOVA in a completely randomized design, ignoring the factorial arrangement, according to the statistical model: Yijk =µk+αik +εijkwhere
ijk
Y = observed value of the k-thvariable under the i-th
treatment in the j-th replication; µk= overall mean of
the k-th variable; αik= effect of the i-th treatment in the k-th variable, and εijk= random effect associated with the
observation Yijk assuming NID (0, σ2).
From the MANOVA, the eigenvalues were calculated determining the roots characteristics of the equation
(Harris, 1975): −1 − =0
I H
E λ where E- 1 = common
inverse matrix of the residual sums of squares and products;
H = matrix of the sums of squares and products relating to
treatments;
λ
1andλ
2= eigenvalues of the matrix E−1Hand I = identity matrix of order p = 2.
Then, the non-normal eigenvector associated with the largest eigenvalue was estimated through the solution of the system of equations:
(
− −)
=00 ⇒(
−1 − 1)
=00~ 1 1
b a I H E v
I H
E λ λ
where λ1= largest eigenvalue, v~= non-normal eigenvector
associated with the largest eigenvalue, a and b = canonic
coefficients, E−1and, H and I = as previously defined.
Subsequently, the eigenvector normalization was conducted through the solution of the linear system, according to the restriction:
[
]
1' ' ' ' 1
~ '
~ =
⇒
=
b a
n E b a n
E
e e
l l
where l~= normal eigenvector associated with the largest
eigenvalue;l~'= transpose of the normal eigenvector;
E = matrix of the sums of squares and residual products;
e
n = number of degrees of freedom of the residue;
a
'
and b' =canonic coefficients.
Then, the Fisher’s linear discriminant function (FLDF) or the first canonical variable (CV1) was calculated, which was defined by: Z=a'Y+b'WXwhere Z = Fisher’s linear
discriminant function or the first canonical variable;
Y = animal transformation (DCG); WX = equivalent diet
intake (EDI);
a
'
and b' as previously defined. The values of this function were called bioeconomic multivariate nutritional index – BEMNI (Guidoni, 1994).The economic analysis was based on the following variables: gross income per head (GIH, R$/head), per arroba (GIA, R$/@), per day (GID, R$/day); feed costs per head (FCH, R$ /head), per arroba (FCA, R$/@), per day (FCD R$/day); gross profit of feed per head (GPFH, R$/head), per arroba (GPFA, R$/@), per day (GPFD, R$/day); even point (BE, kg of carcass/day); break-even cost of diet (BECD, @ of cattle/t of diet DM) and benefit: cost ratio (BCR, R$). The procedures for calculation to obtain these variables can be found in Mello (2007).
submitted to the univariate analysis of variance through general linear models procedure (PROC GLM – General Linear Models Procedures). The means were adjusted through the ordinary least squares method (LSMEANS - Least Square Means) and compared through the Tukey test at 5% of significance. Moreover, the Pearson and Spearman analysis of correlation was conducted between these variables.
The feed conversion (FC), carcass gain: weight gain ratio (CWR), feed cost per arroba (FCA) and gross profit of feed per arroba (GPFA) values showed no normal distribution, hence, they were analyzed through the generalized linear
models method using the GENMOD procedure of SAS. For
heterocedasticity reasons, feeding cost per head (FCH) was analyzed through the Weighted Least Squares(WLS), so that each observation was weighted by the reciprocal of the variance of treatment to which it belonged to (Hoffmann, 2006), being the Best Linear Unbiased Estimator (BLUE)
Gross margin sensitivity analysis (GPFA) and profitability (BCR) were conducted through fluctuations in the exchange relation (ER) of the diet in equivalent per arroba of cattle (ER, @ of cattle/t DM of the diet), i.e. encompassing changes in the sale prices of kilograms of cattle meat and purchasing of the diet ingredients and keeping up the other conditions constant (ceteris paribus).
After a sensitivity analysis, a linear regression analysis of GPFA was carried out, according to the variation in the exchange relation (ER) for each treatment, according to the statistical model: Yijk =β0+β1Xij+εijk, where Yijk= dependent variable gross profit of feed per arroba (GPFA) of the k-th replication in the i-th genetic group and j-th is
the slaughter weight; β0= intercept, or regression constant,
representing the value of price per arroba when ER = 0;
1
β = regression coefficient or angular coefficient of a
straight line, expressing reduction rate GPFA with the increase of the exchange ratio; Xij= independent variable
exchange relation (ER) in the i-th genetic group and j-th
is the slaughter weight; εijk= experimental error of
observation ijk, assuming
( )
0, 2~
σε N
iid
ijk . Parameters of
the model in question were estimated through REG
procedure of SAS.
Then, analysis of non-linear regression of BCR was also conducted according to the variation in the exchange relation (ER) for each treatment, according the statistical
model: ijk
X
ijk
e
ij
Y =θ θ2 +ε
1 where Yijk= dependent variable
benefit: cost ratio (BCR) of the k-th replication in the i-th
genetic group and j-th is the slaughter weight; θ1 =
constant, representing the value of the BCR when ER = 0;
e
= exponential;θ2= reduction rate of BCR with theincrease of ER; Xij = independent variable exchange
relation (ER) in the i-th genetic group and j-th is the
slaughter weight;εijk= experimental error associated
with each observation, assuming
( )
0, 2~
σε N
iid
ijk . The
parameters of the model in question were estimated through the modified Gauss-Newton algorithm inserted
in the NLIN procedure of SAS. In both linear and
non-linear regression models, the coefficient o f
determination (r2) was expressed in relation to the
treatment sources (regression + lack of fitting).
In the case of the linear model (GPFA), the F test was applied with the purpose of verifying the identity and equality of the linear regression model parameters fitted for the genetic group, slaughter weight and combination of both, according to Regazzi (1999). The hypotheses
tested were as follows: H ( ) 01 0H
1
0 :β =K=β , i.e., the “H”
equations have a common intercept; H ( ) 11 1H
2
0 :β =K=β , i.e.
the “H” equations have equal regression coefficients;
( )
H
H
~ 1 ~ 3
0 :β =K=β , i.e., the “H” equations are similar in
=
h h
h 1
0
~ β
β
β .
The likelihood ratio test with rapprochement through F statistical was also applied to verify the identity and equality of non-linear regression model parameters (BCR) fitted for the genetic group, slaughter weight and combination of both, according to Regazzi & Silva (2004). The hypotheses tested were as follows: H0( )1 :θ11=K=θ1H, i.e., the “H” equations have a common constant;
( )
H
H 21 2
2
0 :θ =K=θ , i.e., the “H” equations have an equal
decline rate; ( )
H H
~ 1 ~ 3
0 :θ =K=θ , i.e., the “H” equations are
similar in = h h h
2 1
~ θ
θ
θ .
All statistical analyses were performed with SAS®
software (SAS, 2002).
Results and Discussion
Initial body weight (IBW) had no influence on the genetic group, slaughter weight and interaction of both (P>0.05), because the animals belonged to the same contemporary group and were homogeneous (Table 2).
The dressing percentage (DP) differed between the genetic groups and slaughter weights (Table 2) and was higher (P<0.05) for F1 Blonde D’Aquitaine animals, probably due to the higher growth rate of continental European breeds (large frame) when compared to British European breeds (small frame). Similarly, animals slaughtered at 560 kg had greater dressing percentage (P<0.05) than those slaughtered at 520 or 480 kg. One possible explanation for the better dressing percentage in heavier animals may be due to the most advanced finishing degree, with greater
deposition of subcutaneous fat and marbling in the carcass, besides small relative proportion of non-integrant parts of the carcass, mainly leather, head and feet (Galvão et al., 1991).
Data from literature show variations in the dressing percentage among animals from different genetic groups (Perotto et al., 1999; Vaz & Restle, 2001; Menezes et al., 2005a), and some of these variations were real and confirmed. However, the effects of genetic group, slaughter weight and other factors that affect the dressing percentage may Table 2 - Initial and final body weights, days in feedlot and dressing percentage of F1 Red Angus (RA) or Blonde D’Aquitaine (BA)
× Nellore (N) bulls
Slaughter weight Genetic group Mean P value1
½ RA ½ N ½ BA ½ N GG SW GG × SW
Initial body weight (IBW), kg 0.7191 0.9486 0.8541
480 453.3 442.8 448.1
520 444.5 446.0 445.3
560 445.2 444.2 444.7
Mean 447.7 444.3 CV2 = 6.2 SEM3 = 4.3
Final body weight (FBW), kg 0.6133 0.0001 0.9920
480 483.8 478.7 481.3c
520 521.7 516.3 519.0b
560 559.7 556.8 558.2a
Mean 521.7 517.3 CV2 = 5.0 SEM3 = 6.7
Days in feedlot (DIF), days5 - -
-480 21 21 21
520 50 50 50
560 78 78 78
Mean 50 50 CV = - SEM3 =
-Dressing percentage (DP), % 0.0425 0.0002 0.1458
480 52.1 54.0 53.0b
520 53.0 54.9 53.9b
560 56.2 55.9 56.1a
Mean 53.8B 54.9A CV2 = 2.8 SEM3 = 0.3
Total carcass gain (TCG), kg 0.0809 0.0001 0.2875
480 22.2 36.8 29.5c
520 54.3 60.1 57.2b
560 92.0 91.8 91.9a
Mean 56.2 62.9 CV2 = 18.1 SEM3 = 4.7
Daily carcass gain (DCG), kg/day 0.0009 0.0002 0.0076
480 1.244Ba 1.910Aa 1.577
520 1.087Aa 1.202Ab 1.144
560 1.179Aa 1.246Ab 1.213
Mean 1.170 1.452 CV2 = 16.5 E P M3 = 0.06
Carcass gain:weight gain ratio (CWR)4 0.2372 0.0532 0.2588
480 0.92 0.99 0.95
520 0.70 0.88 0.79
560 0.81 0.77 0.79
Mean 0.81 0.88 CV2 = 21.7 E P M3 = 0.03
Means followed by different capital letters within a row and different small letters within a column differ (P<0.05), respectively, between genetic groups and slaughter weights by Tukey test.
1 Pr>F = probabilistic value; 2 CV (%) = coefficient of variation; 3 SEM = standard error of mean; 4 Pr>χ2= probabilistic value through the likelihood ratio test with rapprochement
be confused, because when animals from genetic groups that differ in the maturity size are slaughtered at similar body weight, animals of smaller maturity size will be in greater finishing degree, which also affects the dressing percentage, impairing the comparison between genetic groups. On the other hand, when animals are slaughtered at different body weights, the effect of the genetic group will be confused with the effect of body weight on the dressing percentage (Galvão et al., 1991). Therefore, caution in the interpretation of the dressing percentage should be taken.
There was a difference (P<0.05) of total carcass gain (TCG) between slaughter weights and a tendency (P<0.09) of higher TCG for F1 Blonde D’Aquitaine in relation to F1 Red Angus animals (Table 2), hence TCG increased according to the slaughter weight, as a result of higher number of days in feedlot and increasing in dressing percentage. The tendency of higher TCG for F1 Blonde D’Aquitaine animals could be attributed to the higher growth rate of genetic groups of late maturation (continental breeds),
confirmed by higher (P<0.05) daily carcass gain (DCG) of F1 Blonde D’Aquitaine in relation to F1 Red Angus animals. Effect of the genetic group × slaughter weight interaction (P<0.05) on the DCG was observed, which ranged from 1.087 to 1.910 kg/day (Table 2). F1 Blonde D’Aquitaine animals slaughtered at 480 kg showed higher DCG, probably because continental breeds had higher muscle growth rate and reach physiological maturity with higher body weight when compared to British breeds. Higher daily carcass gain in these animals could be justified by high carcass gain: weight gain ratio (CWR).
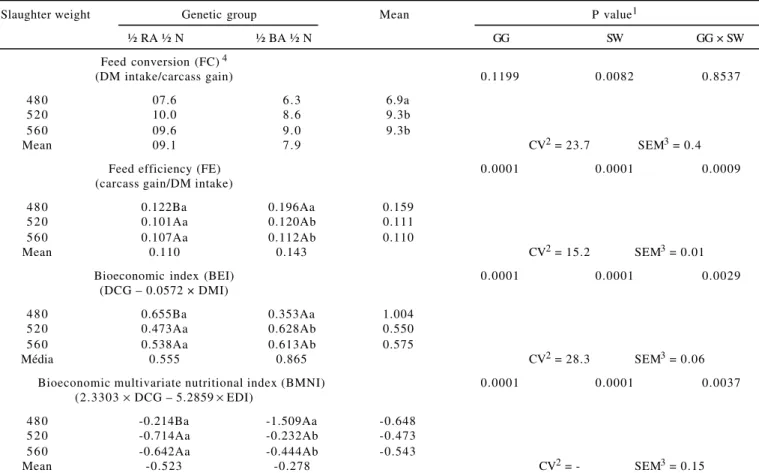
An effect (P<0.05) of the slaughter weight on the feed conversion (FC) was observed, which ranged from 6.3 to 10 kg DM/kg daily carcass gain. Feed conversion was better (lower value) in lighter animals. F1 Blonde D’Aquitaine animals showed tendency (P<0.12) to lower feed conversion values when compared to F1 Red Angus (Table 3) animals. This may be due to the high potential for the muscle growth of large-frame breeds (continental), which reduces the amount of feed required per kg of gain, a fact evidenced
Table 3 - Feed conversion, feed efficiency, bioeconomic index and bioeconomic multivariate nutritional index of F1 Red Angus (RA) or Blonde D’Aquitaine (BA) × Nellore (N) bulls slaughtered at three body weights
Slaughter weight Genetic group Mean P value1
½ RA ½ N ½ BA ½ N GG SW GG × SW
Feed conversion (FC) 4
(DM intake/carcass gain) 0.1199 0.0082 0.8537
480 07.6 6.3 6.9a
520 10.0 8.6 9.3b
560 09.6 9.0 9.3b
Mean 09.1 7.9 CV2 = 23.7 SEM3 = 0.4
Feed efficiency (FE) 0.0001 0.0001 0.0009
(carcass gain/DM intake)
480 0.122Ba 0.196Aa 0.159
520 0.101Aa 0.120Ab 0.111
560 0.107Aa 0.112Ab 0.110
Mean 0.110 0.143 CV2 = 15.2 SEM3 = 0.01
Bioeconomic index (BEI) 0.0001 0.0001 0.0029
(DCG – 0.0572 × DMI)
480 0.655Ba 0.353Aa 1.004
520 0.473Aa 0.628Ab 0.550
560 0.538Aa 0.613Ab 0.575
Média 0.555 0.865 CV2 = 28.3 SEM3 = 0.06
Bioeconomic multivariate nutritional index (BMNI) 0.0001 0.0001 0.0037
(2.3303 × DCG – 5.2859 × EDI)
480 -0.214Ba -1.509Aa -0.648
520 -0.714Aa -0.232Ab -0.473
560 -0.642Aa -0.444Ab -0.543
Mean -0.523 -0.278 CV2 = - SEM3 = 0.15
Means followed by different capital letters within a row and different small letters within a column differ (P<0.05), respectively, between genetic groups and slaughter weights by Tukey test.
1 Pr>F = probabilistic value; 2 CV (%) = coefficient of variation; 3 SEM = standard error of mean; 4 Pr>χ2= probabilistic value through the likelihood ratio test with rapprochement
by the higher (P<0.05) feed efficiency (Table 3) and the highest daily gain and dressing percentage of this genetic group (Table 2). As the feed conversion indicates that all feed consumed is used for animal transformation, ignoring losses to maintain the animal, the better feed conversion of animals slaughtered at lighter weights may have been due to lower fat deposition and lower energy requirements for weight gain.
The genetic group × slaughter weight interaction was significant for feed efficiency (FE), bioeconomic index (BEI) and bioeconomic multivariate nutritional index (BEMNI) (Table 3). F1 Blonde D’Aquitaine animals slaughtered at 480 kg had higher feed efficiency, probably due to the lower voluntary feed intake and higher weight gain rate, since these animals have genes from continental European breeds. This genetic group is characterized by high growth potential, lower fat deposition and lower energy requirements for weight gain. Considering that the fast estimator for feed conversion is the arithmetic mean and their reciprocal (FE = 1/FC) is the harmonic mean, and that the arithmetic mean is higher than the harmonic mean, when using feed conversion, the biological efficiency is underestimated. However, if the feed efficiency is used, the biological efficiency is overestimated. Moreover, the quotient index resulting from non-linear combination between animal transformation and diet intake usually does not have normal probability distribution (Guidoni, 1994). Thus, it does not meet the assumptions of normal ordinary Gauss-Markov linear model (Graybill, 1976). Thus, it was decided to use BEI and BEMNI.
Bioeconomic index efficiency represents the net transformation produced by the animal after discounting the feed supplied, economically expressed as part of the transformation. In this discount, orts, losses in feces, urine and gases are implicitly included, and also the fraction of diet used for maintaining animal body (Guidoni, 1994). F1 Blonde D’Aquitaine animals slaughtered at 480 kg had greater BEI because of greater DCG and FE of these animals and smaller maintenance requirements and feed conversion of lighter animals.
Bioeconomic multivariate nutritional index is characterized by the use of the information from data between the variables involved. Therefore, when variables are correlated, the fact of not rejecting the null hypothesis in univariate analysis does not imply that the hypothesis should be accepted, because in multivariate analysis, this hypothesis can be rejected (Guidoni, 1994). Since canonic coefficients (normal eigenvectors) admit solution of signal change, greater and lower BEMNI values may be beneficial
and desirable. If the coefficient of the animal transformation variable has positive signal and the intake variable has negative sign, higher BEMNI value will be more advantageous. Otherwise, higher BEMNI values will be less advantageous. In this study, it was opted for the expression of the first form. F1 Blonde D’Aquitaine animals slaughtered at 480 kg had greater BEMNI as a result of higher BEI, showing its superiority and better bioeconomic efficiency.
The GIH and FCH values increased (P<0.05) with the slaughter weight, obviously due to higher number of days in feedlot (Table 4). To raise the slaughter weight in 80 kg, or from 480 to 560 kg, there was an increase of 211% in GIH, while FCH has increased 316%. Therefore, since the slaughter weight increases, the feed costs increase with a higher pro portion than the gross income, at approximately 1.5:1.
In this work, the animals entered the feedlot in August and were slaughtered in October (480 kg), November (520 kg) and December (560 kg), precisely in the months in which they obtain the best prices per arroba. For the economic analysis, the fixed sale price of R$ 55.00 per arroba of fat cattle was considered, not representing the experimental condition. Thus, in addition to efficient management, the management must foresee the ideal moment to remove animals from the feedlot, seeking, among other benefits, for selling the animals in the period of better prices. Moreover, the adequacy of the seasonality price of commodity can be made through future market operations (hedge) or option contracts (buy and sale) in the stock market.
F1 Blonde D’Aquitaine animals slaughtered at 480 kg showed higher (P<0.05) gross income (Table 4) and daily gross profit of feed (Table 5), since they had higher DCG (Table 2) and feed efficiency (Table 3). Feed cost per arroba (FCA) and per day (FCD) increased (P<0.05) according to the slaughter weight, as a result of changes in the weight gain composition, evidenced in the feed conversion (Table 3). Thus, the maintenance of animals in feedlot in search for better price should be weighted to ensure the profitability, considering the market fluctuations, since the gain rate reduces and the feedcost increases with the increase in number of days in the feedlot. Thus, a smaller number of days in the feedlot can improve the profitability of feedlot finishing.
GIH and lower (P<0.18) FCH for F1 Blonde animals was confirmed by higher (P<0.05) GPFH in these animals, which could be attributed to the tendency of higher (P<0.09) TCG (Table 2) and lower (P<0.12) FC (Table 3) found for this genetic group.
The range observed for gross profit of feed per arroba (GPFA) was from R$ 24.01 to R$ 35.56 and, as previously mentioned, the GPFA reduced (P<0.05) as the slaughter weight increased, due to the increase in the FCA value (Table 4). This finding confirms the assumption that short feeding periods improve the profitability of the feedlot finishing system.
The break-even point (BEP) represents the minimum amount that the animal must produce for equal income and cost, that is, means the minimum production limit with no
occurrence of losses , giving an idea of the economic viability of the activity. The break-even point increased (P<0.05) with the increase of the slaughter weight, that is, animals slaughtered at lighter weight need to produce less carcass to cover the feeding costs, similarly to the changes observed in the behavior of FCD (Table 4 ).
The break-even cost of diet (BECD) expresses the maximum cost of the diet to equal with the gross income, that is, the cost of the diet in which the gross profit of feed is null (zero). However, the benefit-cost ratio (BCR) reflects the internal rate of return on invested capital. The genetic group × slaughter weight interaction was significant for BECD and BCR (Table 5). The feedlot system of F1 Blonde animals slaughtered at 480 kg showed higher (P<0.05) BECD and BCR values, that is, for this type of animal, the diet can Table 4 - Gross income and feed costs of F1 Red Angus (RA) or Blonde D’Aquitaine (BA) × Nellore (N) bulls slaughtered at three body
weights
Slaughter weight Genetic group Mean P value1
½ RA ½ N ½ BA ½ N GG SW GG × SW
Gross income per head (GIH), R$ 0.0812 0.0001 0.2877
480 081.40 135.06 108.23c
I 199.22 220.31 209.76b
560 337.33 336.60 336.97a
Mean 205.98 230.65 CV2 = 18.1 SEM3 = 17.3
Gross income per arroba (GIA), R$/@5 - -
-480 55.00 55.00 55.00
520 55.00 55.00 55.00
560 55.00 55.00 55.00
Mean 55.00 55.00 CV2 = - SEM3 =
-Gross income per day (GID), R$/day 0.0009 0.0002 0.0077
480 4.56Ba 7.00Aa 5.78
520 3.98Aa 4.40Ab 4.19
560 4.32Aa 4.57Ab 4.45
Mean 4.29 5.32 CV2 = 16.6 SEM3 = 0.21
Feed cost per head (FCH), R$ 0.1724 0.0001 0.5315
480 044.56 043.58 044.07a
520 110.71 103.41 107.06b
560 188.78 178.09 183.43c
Mean 114.68 108.36 CV2 = 1.8 SEM3 = 9.88
Feed cost per arroba (FCA), R$/@4 0.1207 0.0082 0.8548
480 23.39 19.44 21.41a
520 30.99 26.56 28.78b
560 29.79 27.81 28.80b
Mean 28.05 24.60 CV2 = 23.7 SEM3 = 1.19
Feed cost per day (FCD), R$/day 0.1763 0.0334 0.8425
480 2.12 2.07 2.10ax
520 2.21 2.07 2.14ab
560 2.42 2.28 2.35bx
Mean 2.25 2.14 CV2 = 10.7 SEM3 = 0.04
Means followed by different capital letters within a row and different small letters within a column differ (P<0.05), respectively, between genetic groups and slaughter weights by Tukey test.
1 Pr>F = probabilistic value; 2 CV (%) = coefficient of variation; 3 SEM = standard error of mean; 4 Pr>χ2= probabilistic value through the likelihood ratio test with rapprochement
have higher cost without the occurrence of losses, because higher return on feed cost was obtained. This fact can be explained by the fact that animals had been more nutritionally efficient (Table 3) promoting, therefore, greater gross profit of feed per day (GPFD, Table 5). The results observed in this study have practical implications for the producer, since the highest number of days in feedlot of animals resulting in inevitable change in nutritional efficiency (Table 3). Thus, short feeding periods are important alternative for reducing production costs (Table 4), since animals under this type of production system show carcasses that meet the minimum requirements recommended by the Brazilian
beef industry. The fat excess deposition, besides more energy expenditure in relation to muscle tissue, affects the optimization in carcass cuts processing, resulting in lower profitability per animal slaughtered (Table 5).
To identify the closer variables with profitability in feedlot-finished animals, correlation analysis between these variables was performed (Table 6). Since FC did not present residual normality and the calculation of the Pearson correlation coefficients requires data to be normally distributed, because the occurrence of non-normal distributions results in wrong outcome, the Spearman correlation was also performed. The Spearman correlation
Table 5 - Gross profit of feed (Gross income - feed cost) per head, per arroba and per day, break-even point, break-even cost of diet on a dry basis and the benefit: cost ratio of F1 Red Angus (RA) or Blonde D’Aquitaine (BA) × Nellore (N) bulls slaughtered at three body weights
Slaughter weight Genetic group Mean P value1
½ RA ½ N ½ BA ½ N GG SW GG × SW
Gross profit of feed per 0 . 0 3 5 7 0 . 0 0 0 1 0 . 8 5 4 9
head (GPFH), R$
4 8 0 0 5 1 . 2 2 0 9 1 . 4 8 071.35b
5 2 0 0 8 8 . 5 1 1 1 6 . 9 0 102.70b
5 6 0 1 5 6 . 9 1 1 7 8 . 1 9 167.55a
Mean 098.88B 128.86A CV2 = 33.3 SEM3 = 9.49
Gross profit of feed 0 . 1 1 4 3 0 . 0 0 9 3 0 . 8 7 9 3
per arroba (GPFA), R$/@4
4 8 0 3 1 . 6 1 3 5 . 5 6 3 3 . 5 9 a
5 2 0 24.01 28.43 26.22b
5 6 0 25.21 27.19 26.20b
Mean 26.94 30.40 CV2 = 21.9 SEM3 = 1.19
Gross profit of feed 0 . 0 0 0 1 0 . 0 0 0 1 0 . 0 0 2 9
per day (GPFD), R$/day
4 8 0 2.44Ba 5.00Aa 3 . 7 2
5 2 0 1.77Aa 2.34Ab 2 . 0 5
5 6 0 2.01Aa 2.28Ab 2 . 1 5
Mean 2 . 0 7 3 . 2 1 CV2 = 27.8 SEM3 = 0.22
Break-even point (BEP), kg/day 0 . 1 7 3 7 0 . 0 3 5 2 0 . 8 5 1 2
4 8 0 0.579 0.566 0.572ax
5 2 0 0.604 0.564 0.584ab
5 6 0 0.660 0.622 0.641bx
Mean 0.614 0.584 CV2 = 10.7 SEM3 = 0.01
Break-even cost of diet (BECD), @/t 0 . 0 0 0 1 0 . 0 0 0 1 0 . 0 0 0 9
4 8 0 8.2Ba 13.1Aa 1 0 . 6
5 2 0 6.7Aa 08.0Ab 0 7 . 4
5 6 0 7.2Aa 07.4Ab 0 7 . 3
Mean 7 . 4 0 9 . 5 CV2 = 15.1 SEM3 = 0.4
Benefit:cost ratio (BCR) 0 . 0 0 0 1 0 . 0 0 0 1 0 . 0 0 0 9
4 8 0 1.17Ba 2.48Aa 1 . 8 3
5 2 0 0.80Aa 1.13Ab 0 . 9 7
5 6 0 0.91Aa 0.99Ab 0 . 9 5
Mean 0 . 9 6 1 . 5 4 CV2 = 27.6 SEM3 = 0.11
Means followed by different capital letters within a row and different small letters within a column differ (P<0.05), respectively, between genetic groups and slaughter weights by Tukey test.
1 Pr>F = probabilistic value; 2 CV (%) = coefficient of variation; 3 SEM = standard error of mean; 4 Pr>χ2= probabilistic value through the likelihood ratio test with rapprochement
differs from the Pearson correlation, basically by the observations being converted into ranks before coefficients are computed, and no assumption is necessary.
The correlation coefficients (r) indicate the degree of association and the direction of the relationship between two random variables. Among the productive indicators (FBW, DF, DMI, ADG, DP and DCG), ADG and DP showed no correlation (P>0.05) with profitability (BCR), while DF and DMI showed low negative correlation (P<0.05), the FBW showed average negative correlation (P<0.05) and DCG high positive correlation (P <0.05) with BCR. Although DCG is dependent on ADG and DP, it was found that, separately, they have no influence on profitability. However, ADG had medium positive correlation (P<0.05) with DCG, while the Pearson correlation between DP and DCG was not significant. Also, significant correlation of DP with the other variables could be hardly observed. Thus, DP is not good bioeconomic predictor in feedlot system. Accordingly, management strategies that prioritize DP rather than ADG may not be contributing to the increase in the profitability in feedlot-finished cattle.
The product-moment or rank-order correlations between FBW and DP suggest that the number of days in feedlot is directly related to carcass weights. The correlations of DMI with ADG or with DCG were of low magnitude or not significant, showing that animals, probably, failed to express the full potential for genetic gain. Perhaps, some nutrient in the diet may have limited gain, which is believed to be protein, because as observed (Figure 1), the energy intake was, on average, 1.08 times the energy required, while protein was consumed, on average, 0.90 times the protein requirement. The nutritional efficiency indicators (FC, FE, BEI, and BEMNI) showed a high correlation (P<0.05) with BCR. Even if all nutrition indicators have strong associations
with profitability, FC and FE suggest that all nutrients are used for animal transformation, which is not true. According to Guidoni (1994), despite the contradiction between FC and FE, in the way both are being used, it is postulated in their interpretations that the economic aspect of feed is implicitly involved, and that is not true either, unless all diets or experimental treatments have the same cost. The author also mentioned that they do not constitute proper nutrition indicators. Thus, and through the BEMNI attributes, it is recommended that this indicator should be employed in profitability estimation of feedlot animals. However, canonic coefficients can assume an opposite sign solution in obtaining BEMNI, as explained above. Thus, it is necessary to take caution in the interpretation of the BEMNI correlation coefficients because, although the degree of association is the same, the direction can be the opposite (positive/negative).
Pearson and Spearman coefficients were slightly different, but these differences can be considered null and without practical significance. Thus, it seems that the Spearman correlation provides as much information as the Pearson correlation, but with wider validity because, unlike the Pearson correlation, it does not require any assumption on the frequency distribution of the variables. Therefore, it should not be excluded.
The gross profit (GPFA) differed (P<0.05) between slaughter weights, and profitability (BCR) was significant for the genetic group × slaughter weight interaction in each diet exchange relation in the sensitivity analysis (data not shown). The stipulations of diet exchange apparently did not interfere in the comparisons of the results, because it seems that animals slaughtered at 480 kg (GPFA) and F1 Blonde crossbred slaughtered at 480 kg (BCR) were economically better in each of the exchange relation, that is,
Figure 1 - Energy and protein balance in the diet of F1 young bull crossbred cattle (Bos taurus × Bos indicus) finished in feedlot and
slaughtered at different body weights.
y = 1,0771x
30 35 40 45 50 55 60 65 70
30 35 40 45 50 55 60 65 70
y = 0,8971x
400 500 600 700 800 900 1000 1100 1200 1300 1400
400 500 600 700 800 900 1000 1100 1200 1300 1400
Proteína Metabolizável consumida (g/d)Metabolizable protein intake (g/d)
Net energy requirement (MJ/d) Metabolizable protein requirement (g/d)
Net energy intake (MJ/d)
119
© 2009 Sociedade Brasileira de Zootecnia
FBW DF DMI ADG DP DCG FC FE BEI BMNI GID FCD GPFD BEP BECD BCR
FBW 0.80* * * 0.65* * * 0.05ns 0.30ns -0.42* 0.62* * * -0.64* * * -0.54** -0.65* * * -0.42* 0.65* * * -0.53** 0.65* * * -0.64* * * -0.64* * * DF 0.81* * * 0.40* -0.07ns 0.58** -0.45** 0.44** -0.57** -0.52** -0.57** -0.45** 0.40* -0.52** 0.40* -0.57** -0.57** DMI 0.65* * * 0.43** 0.38* 0.23ns -0.02ns 0.48** -0.40* -0.22ns -0.44* -0.02ns 0.99* * * -0.22ns 0.99* * * -0.40* -0.40* ADG -0.00ns -0.10ns 0.34ns -0.11ns 0.51** -0.20ns 0.29ns 0.41* 0.27ns 0.51** 0.38* 0.41* 0.38* 0.29ns 0.29ns DP 0.27ns 0.58** 0.33ns -0.01ns 0.27ns -0.32ns 0.17ns 0.23ns 0.18ns 0.27ns 0.23ns 0.23ns 0.23ns 0.17ns 0.17ns DCG -0.39* -0.34ns 0.07ns 0.60** 0.35* -0.86* * * 0.91* * * 0.98* * * 0.90* * * 1.00* * * -0.02ns 0.98* * * -0.02ns 0.91* * * 0.91* * * FC 0.63* * * 0.40* 0.44** -0.29ns -0.35* -0.85* * * -0.96* * * -0.93* * * -0.96* * * -0.86* * * 0.48** -0.93* * * 0.48** -0.96* * * -0.96* * * FE -0.65* * * -0.45** -0.37* 0.30ns 0.33ns 0.85* * * -1.00* * * 0.98* * * 0.99* * * 0.91* * * -0.40* 0.97* * * -0.40* 0.99* * * 0.99* * * BEI -0.55** -0.40* -0.17ns 0.45** 0.36* 0.95* * * -0.96* * * 0.96* * * 0.97* * * 0.98* * * -0.22ns 0.99* * * -0.22ns 0.98* * * 0.98* * * BMNI -0.67* * * -0.47** -0.43* 0.25ns 0.30ns 0.82* * * -0.99* * * 0.99* * * 0.95* * * 0.90* * * -0.44* 0.97* * * -0.44* 0.99* * * 0.99* * * GID -0.38* -0.34ns 0.08ns 0.60** 0.35* 0.99* * * -0.85* * * 0.85* * * 0.95* * * 0.81* * * -0.02ns 0.98* * * -0.02ns 0.91* * * 0.91* * * FCD 0.66* * * 0.44** 0.99* * * 0.34ns 0.32ns 0.06ns 0.45** -0.38* -0.18ns -0.44* 0.07ns -0.22ns 0.99* * * -0.40* -0.40* GPFD -0.54** -0.40* -0.15ns 0.47** 0.35* 0.96* * * -0.95* * * 0.95* * * 0.99* * * 0.94* * * 0.95* * * -0.15ns -0.22ns 0.97* * * 0.98* * * BEP 0.65* * * 0.43* 0.99* * * 0.34ns 0.32ns 0.07ns 0.44** -0.37* -0.17ns -0.43* 0.08ns 0.99* * * -0.14ns -0.40* -0.40* BECD -0.65* * * -0.46** -0.37* 0.30ns 0.32ns 0.85* * * -0.99* * * 0.99* * * 0.97* * * 0.99* * * 0.85* * * -0.38* 0.96* * * -0.37* 0.99* * * BCR -0.64* * * -0.44** -0.37* 0.30ns 0.33ns 0.85* * * -0.99* * * 0.99* * * 0.96* * * 0.99* * * 0.85* * * -0.38* 0.95* * * -0.37* 0.99* * *
1 FBW (kg) = final body weight; DF (days) = days in feedlot; DMI (kg/day) = daily dry matter intake; ADG (kg/day) = average daily weight gain; DP (%) = dressing percentage; DCG (kg/day) = daily carcass gain; FC = feed convertion;
FE = feed efficiency; BEI = bioeconomic index; BMNI = bioeconomic multivariate nutritional index; GID (R$/day) = gross income per day; FCD (R$/day) = feeding cost per day; GPFD (R$/day) = gross profit of feed per day; BEP (kg DCG/day) = break-even point; BECD (@/tDM) = break-even cost of the diet; BCR = benefit:cost ratio.
ns Not significant (P>0.05); * Significant (P<0.05); ** Significant (P<0.01); * * * Significant (P<0.0001).
Table 7
-Fitted regression equations in the gross margin (
GPFA
and profitability (BCR)
sensitivity analysis
of F1 Red
Angus (RA) or Blonde D’Aquitaine (BA) × Nellore
(N) bulls slaughtered at three
body
weights
Model
Fitted regression equation
r2(1)
Gross profit of feed per arroba (GPFA)
Genetic group
½ RA ½ N
i i ER y × − = 5520. 7 9996. 54 ˆ 0.99
½ BA ½ N
i i ER y × − = 5589. 6 9999. 54 ˆ 0.99 Slaughter weight 480 i i ER y × − = 6604. 5 0007. 55 ˆ 0.99 520 i i ER y × − = 6710. 7 0000. 55 ˆ 0.99 560 i i ER y × − = 6774. 7 9987. 54 ˆ 0.99 Combining both
½ RA ½ N
480 i i ER y × − = 2344. 6 0004. 55 ˆ 0.99 520 i i ER y × − = 2605. 8 0003. 55 ˆ 0.99 560 i i ER y × − = 9415. 7 9983. 54 ˆ 0.99
½ BA ½ N
480 i i ER y × − = 1820. 5 0010. 55 ˆ 0.99 520 i i ER y × − = 0815. 7 9997. 54 ˆ 0.99 560 i i ER y × − = 4133. 7 9990. 54 ˆ 0.99 Common i i ER y × − = 0413. 7 9998. 54 ˆ 0.99
Benefit: cost ratio (BCR)
Genetic group
½ RA ½ N
i 5994. 0 6983. 8 ˆ ER i e y × − × = 0.99
½ BA ½ N
i 4969. 0 7553. 9 ˆ ER i e y × − × = 0.99 Slaughter weight 480 i ER i e y × − × = 4557. 0 8748. 10 ˆ 0.99 520 i 5901. 0 7355. 8 ˆ ER i e y × − × = 0.99 560 i 5951. 0 7151. 8 ˆ ER i e y × − × = 0.99 Combining both
½ RA ½ N
480 i 5444. 0 0822. 9 ˆ ER i e y × − × = 0.99 520 i 6426. 0 5903. 8 ˆ ER i e y × − × = 0.99 560 i 6061. 0 6710. 8 ˆ ER i e y × − × = 0.99
½ BA ½ N
480 i ER i e y × − × = 4206. 0 5777. 12 ˆ 0.99 520 i ER i e y × − × = 5511. 0 0037. 9 ˆ 0.99 560 i ER i e y × − × = 5848. 0 7661. 8 ˆ 0.99 Common i ER i e y × − × = 5364. 0 1563. 9 ˆ 0.99 1 r 2
= coefficient of determination ;
2
ER= exchange relation of the diet
(2 to 6 @/
t DM of diet).
independent of the stipulations of exchange, these animals
were, verisimilarly, more profitable than the
others
Additionally, it was found
that GPFA and BCR
decreased
with the increase
in the diet exchange relation
(ER, @ of
fatter cattle/t of DM of diet), and from the ER = 4, in general,
The equations obtained for GPFA and BCR in the sensitivity analysis (Table 7) are numerically in agreement between the genetic groups, F1 Blonde D’Aquitaine bulls were more profitable and lucrative than F1 Red Angus, and between the slaughter weights, animals slaughtered at 480 kg were more profitable and lucrative than those slaughtered at 520 or 560 kg. In the combination of factors, without considering the factorial arrangement, F1 Blonde animals slaughtered at 480 kg were more profitable and lucrative than the others (Table 7). However, a test was applied to verify, from statistical and probabilistic point of view, the equality of estimates of the parameters and the identity of the regression models (Table 8) in order to investigate whether the return and profitability could be represented by a unique profile or
to identify the treatments with greater return and profitability in the origin (ER= 0) and with smaller reduction rate as the ER increases, that is, the animals most economically efficient were independent from market fluctuations.
A difference (P<0.05) between genetic groups, slaughter weight and combination of factors was observed for GPFA and BCR (Table 8). Therefore, the factors should not be analyzed as a isolated one but as a set.
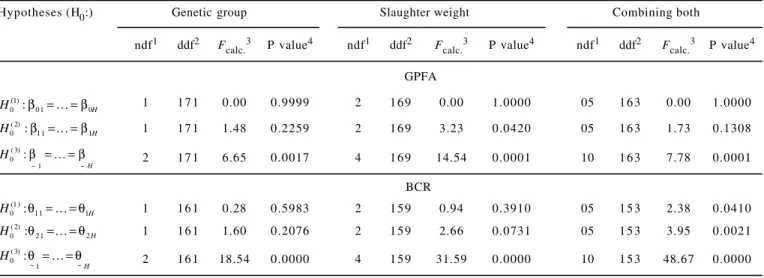
The parameters β0 were similar (P>0.05) to each other,
the parameters β1 (reduction rate) have been uneven
between them (P<0.05) and the identity of the models differed (P<0.05) in the combination of the genetic group and slaughter weight gain for GPFA. In this case, the GPFA should be represented by different curves with common
Table 8 - Test to verify the equality parameters and identity models for fitted regression equations in the sensitivity analysis of gross profit of feed per arroba (GPFA) and benefit:cost ratio (BCR) applied to genetic group, slaughter weight and combination of both
Hypotheses (H0:) Genetic group Slaughter weight Combining both
ndf1 ddf2 Fcalc.3 P value4 ndf1 ddf2 Fcalc.3 P value4 ndf1 ddf2 Fcalc.3 P value4
GPFA
H
H 01 0
) 1 (
0 :β =K=β 1 171 0.00 0.9999 2 169 0.00 1.0000 05 163 0.00 1.0000
H
H0(2):β11=K=β1 1 171 1.48 0.2259 2 169 3.23 0.0420 05 163 1.73 0.1308
H
H
~ 1 ~ ) 3 (
0 :β =K=β 2 171 6.65 0.0017 4 169 14.54 0.0001 10 163 7.78 0.0001
BCR
H
H0(1):θ11=K=θ1 1 161 0.28 0.5983 2 159 0.94 0.3910 05 153 2.38 0.0410
H
H 21 2
) 2 (
0 :θ =K=θ 1 161 1.60 0.2076 2 159 2.66 0.0731 05 153 3.95 0.0021
H
H
~ 1 ~ ) 3 (
0 :θ =K=θ 2 161 18.54 0.0000 4 159 31.59 0.0000 10 153 48.67 0.0000
1ndf = numerator degrees of freedom number. 2ddf = denominator degrees of freedom number. 3F calculated.
4Probabilistic value (Pr>F).
intercept and variable rate, according to the equation
i
i ER
yˆ =55.00−β1× .
The parameters θ1differed (P<0.05) among themselves, the parameters θ2 (reduction rate) were distinct from each other (P<0.05) and the identity of the models was significant in the combination of genetic group and slaughter weight for BCR (Table 8). Therefore, BCR should be represented by individual curves (Table 7). Thus, it is possible to infer that F1 Blonde animals slaughtered at 480 kg were actually more rentable and profitable, regardless of fluctuations in the diet exchange relation.
Conclusions
stipulations in equivalent carcass. The viability of feedlot-finished beef cattle, independent of genetic group and slaughter weight, depends on the diet exchange stipulations in favorable equivalent carcass.
Acknowledgements
The first author is thankful to Conselho Nacional de Desenvolvimento Científico e Tecnológico (CNPq) for partial fellowship, and also to Coordenação de Aperfeiçoamento de Pessoal de Nível Superior (CAPES) and Universidade Federal de Roraima (UFRR) by Programa de Auxílio à Pesquisa dos Recém Pós-Graduados (PROPESQUISA-II) for financial support.
Literature Cited
AMER, P.R.; EMMANS, G.C.; SIMM, G. Economic values for carcase traits in UK commercial beef cattle. L i v e s t o c k Production Science, v.51, p.267-281, 1997.
AMER, P.R.; KEMP, R.A.; BUCHANAN-SMITH, J.G. et al. A bioeconomic model for comparing beef cattle genotypes at their optimal economic slaughter end point. J o u r n a l o f A n i m a l S c i e n c e , v.72, n.1, p.38-50, 1994.
CENTRO DE ESTUDOS AVANÇADOS EM ECONOMIA APLICADA - CEPEA [2007]. Agromensal - ESALQ/BM&F. Piracicaba: Informativo de mercado. Disponível em: <http:// www.cepea.esalq.usp.br> Acesso em: 10/6/2007.
CRUZ, G.M.; TULLIO, R.R.; ESTEVES, S.N. et al. Peso de abate de machos não-castrados para produção do bovino jovem. 2. Peso, idade e características da carcaça. R e v i s t a B r a s i l e i r a d e Zootecnia, v.33, n.3, p.646-657, 2004.
EUCLIDES FILHO, K.; EUCLIDES, V.P.B.; FIGUEIREDO, G.R. et al. Avaliação de animais Nelore e de seus mestiços com Charolês, Fleckvieh e Chianina, em três dietas. 2. Características de carcaça. Revista Brasileira de Zootecnia, v.26, n.1, p.73-79, 1997. FATURI, C.; RESTLE. J.; PASCOAL, L.L. et al. Avaliação econômica
de dietas com diferentes níveis de substituição do grão de sorgo por grão de aveia preta para terminação de novilhos em confinamento. Ciência Rural, v.33, n.5, p.937-942, 2003. GALVÃO, J.G.; FONTES, C.A.A.; PIRES, C.C. et al. Características
e composição física da carcaça de bovinos não-castrados, abatidos em três estágios de maturidade, de três grupos raciais (estudo II). Revista Brasileira de Zootecnia, v.20, n.5, p.502-512, 1991.
GRAYBILL, F.A. Theory and application of the linear model. Belmont: Duxbury Press, 1976. 704p.
GUIDONI, A.L. A l t e r n a t i v a s p a r a c o m p a r a r t r a t a m e n t o s envolvendo o desempenho nutricional animal. 1994. 105f. Tese (Doutorado em Agronomia) - Escola Superior de Agricultura “Luiz de Queiroz”, Universidade de São Paulo, Piracicaba, 1994. HARRIS, R.J. A primer of multivariate statistics. New York:
Academic Press, 1975. 332p.
HOFFMANN, R. A n á l i s e d e r e g r e s s ã o: uma introdução à econometria. 4.ed. São Paulo: Hucitec, 2006. 378p.
JOHNSON, R.A.; WICHERN, D.W. A p p l i e d m u l t i v a r i a t e s t a t i s t i c a l a n a l y s i s. New Jersey: Prentice Hall, 1998. 816p. KHATTREE, R.; NAIK, D.N. Applied multivariate statistical with SAS software. 2.ed. New York: John Wiley & Sons, 1999. 338p.
KHATTREE, R.; NAIK, D.N. Multivariate data reduction and discrimination with SAS Software. Cary: SAS Institute, 2000. 558p.
MARDIA, K.V.; KENT, J.T.; BIBBY, J.M. Multivariate analysis. 6.ed. London: Academic Press, 1997. 518p.
MELLO, R. Eficiência produtiva e econômica, características da carcaça e qualidade da carne de bovinos mestiços confinados e abatidos com diferentes pesos corporais. 2007. 147f. Tese (Doutorado em Zootecnia) - Universidade Federal de Viçosa, Viçosa, MG, 2007.
MENEZES, L.F.G.; RESTLE, J.; BRONDANI, I.L. et al. Características da carcaça de novilhos de gerações avançadas do cruzamento alternado entre as raças Charolês e Nelore, terminados em confinamento. R e v i s t a B r a s i l e i r a d e Zootecnia, v.34, n.3, p.934-945, 2005a.
MENEZES, L.F.G.; RESTLE, J.; VAZ, F.N. et al. Composição física da carcaça e qualidade da carne de novilhos de gerações avançadas do cruzamento alternado entre as raças Charolês e Nelore, terminados em confinamento. R e v i s t a B r a s i l e i r a d e Zootecnia, v.34, n.3, p.946-956, 2005b.
NATIONAL RESEARCH COUNCIL - NRC. Nutrient requirements of beef cattle. 7.ed.rev. Washington, D.C.: National Academy Press, 1996. 242p.
PACHECO, P.S.; RESTLE, J.; VAZ, F.N. et al. Avaliação econômica d a t e r m i n a ç ã o e m c o n f i n a m e n t o d e n o v i l h o s j o v e n s e superjovens de diferentes grupos genéticos. Revista Brasileira de Zootecnia, v.35, n.1, p.309-320, 2006.
PEROTTO, D.; MOLETTA, J.L.; CUBAS, A.C. Características da carcaça de bovinos Canchim e Aberdeen Angus e de seus cruzamentos recíprocos terminados em confinamento. Ciência R u r a l, v.29, n.2, p.331-338, 1999.
REGAZZI, A.J. Teste para verificar a identidade de modelos de regressão e a igualdade de parâmetros no caso de dados de delineamentos experimentais. R e v i s t a C e r e s, v.46, n.266, p.383-409, 1999.
REGAZZI, A.J.; SILVA, C.H.O. Teste para verificar a igualdade de parâmetros e a identidade de modelos de regressão não-linear. I. dados no delineamento inteiramente casualizado. Revista de Matemática e Estatística, v.22, n.3, p.33-45, 2004. RESTLE, J.; PACHECO, P.S.; COSTA, E.C. et al. Apreciação
econômica da terminação em confinamento de novilhos Red Angus superjovens abatidos com diferentes pesos. R e v i s t a Brasileira de Zootecnia, v.36, n.4, p.978-986, 2007. STATISTICAL ANALYSIS SYSTEM - SAS. User’s guide. Version
9.1. Cary: SAS Institute, 2002. (CD-ROM).
SCOT CONSULTORIA [2007]. A nata do leite. Bebedouro: Informativo de Mercado da Pecuária Leiteira, n.107. 16p. Disponível em: <http://www.scotconsultoria.com.br> Acesso em: 24/5/2007.
VAZ, F.N.; RESTLE, J. Efeito de raça e heterose para características de carcaça de novilhos da primeira geração de cruzamento entre Charolês e Nelore. Revista Brasileira de Zootecnia, v.30, n.2, p.409-416, 2001.