AGGREGATE STABILITY AS AFFECTED BY SHORT
AND LONG-TERM TILLAGE SYSTEMS AND
NUTRIENT SOURCES OF A HAPLUDOX IN
SOUTHERN BRAZIL
(1)Milton da Veiga(2), Dalvan José Reinert(3) & José Miguel Reichert(3)
SUMMARY
The ability of a soil to keep its structure under the erosive action of water is usually high in natural conditions and decreases under frequent and intensive cultivation. The effect of five tillage systems (NT = no-till; CP = chisel plowing and one secondary disking; CT = primary and two secondary distings; CTb = CT with crop residue burning; and CTr = CT with removal of crop residues from the field), combined with five nutrient sources (C = control, no nutrient application; MF = mineral fertilizers according to technical recommendations for each crop; PL = 5 Mg ha-1 y-1 fresh matter of poultry litter; CM = 60 m3 ha-1 y-1 slurry cattle manure;
and SM = 40 m3 ha-1 y-1 slurry swine manure) on wet-aggregate stability was
determined after nine years (four sampled soil layers) and on five sampling dates in the 10th year (two sampled soil layers) of the experiment. The size distribution
of the air-dried aggregates was strongly affected by soil bulk density, and greater values of geometric mean diameter (GMDAD) found in some soil tillage or layer
may be partly due to the higher compaction degree. After nine years, the GMDAD
on the surface was greater in NT and CP compared to conventional tillage systems (CT, CTb and CTr), due to the higher organic matter content, as well as less soil mobilization. Aggregate stability in water, on the other hand, was affected by the low variation in previous gravimetric moisture of aggregates, which contributed to a high coefficient of variation of this attribute. The geometric mean diameter of water-stable aggregates (GMDWS) was highest in the 0.00–0.05 m layer in the NT
system, in the layers 0.05–0.10 and 0.12–0.17 m in the CT, and values were intermediate in CP. The stability index (SI) in the surface layers was greater in treatments where crop residues were kept in the field (NT, CP and CT), which is associated with soil organic matter content. No differences were found in the layer 0.27–0.32 m. The effect of nutrient sources on GMDAD and GMDWS was small
and did not affect SI.
Index terms: soil tillage, manure, sampling time, soil structure, aggregation.
(1) Part of the Thesys of the first author. Received for publication in march 2008 and aproved in a aplil 2009.
(2) Researcher of the Epagri, Experimental Station of Campos Novos, P.O. Box 116, CEP 89620-000 Campos Novos (SC). E-mail: [email protected]
RESUMO: EFEITOS DE CURTO E DE LONGO PRAZO DA APLICAÇÃO DE SISTEMAS DE MANEJO DO SOLO E DE FONTES DE NUTRIENTES SOBRE A ESTABILIDADE DE AGREGADOS, EM UM NITOSSOLO VERMELHO
A capacidade do solo em manter sua estrutura diante da ação de agentes erosivos como a água é geralmente alta em condições naturais e reduz quando o solo é sujeito a um preparo frequente e intensivo. O efeito de curto e de longo prazo de cinco sistemas de preparo do solo (PD = plantio direto; PE = escarificação e gradagem; PC = aração e duas gradagens; PCq = PC com resíduos queimados; e PCr = PC com resíduos retirados) associados com cinco fontes de nutrientes (T = testemunha; AM = adubação mineral de acordo com a recomendação para manutenção de cada cultura; EA = 5 Mg ha-1 ano-1 de cama de aviário, base úmida; EB =
60 m3 ha-1 ano-1 de esterco líquido de bovinos; e 40 m3 ha-1 ano-1 de esterco líquido de suínos)
sobre a estabilidade dos agregados foi determinado ao final do nono ano de experimentação (coleta em quatro camadas) e em cinco épocas de amostragens efetuadas durante o décimo ano (coleta em duas camadas), em um Nitossolo Vermelho com alto teor de argila, no Sul do Brasil. A distribuição de tamanho de agregados secos ao ar foi fortemente alterada pela densidade do solo, e os maiores valores de diâmetro médio geométrico (DMGSA) encontrado em
alguns sistemas de preparo ou camadas podem ser parcialmente devidos ao maior estado de compactação do solo. Depois de nove anos, o PD e o PE apresentaram maior DMGSA na
camada superficial, em comparação com os sistemas de preparo convencional (PC, PCq e PCr), devido ao maior conteúdo de matéria orgânica, bem como à menor mobilização do solo. A estabilidade dos agregados em água, por outro lado, foi influenciada pela pequena variação na umidade das amostras por ocasião da realização do teste, resultando em alto coeficiente de variação dessa determinação. O PD apresentou maior diâmetro médio geométrico dos agregados estáveis em água (DMGEA) na camada de 0,00–0,05 m; o PC, nas camadas de 0,05–0,10 e
0,12–0,17 m; e o PE, valores intermediários. O índice de estabilidade dos agregados (IE) na camada superficial foi maior nos tratamentos em que os resíduos das culturas foram mantidos na lavoura (PD, PE e PC), o que está associado com o conteúdo de matéria orgânica. Não foram encontradas diferenças na camada de 0,27–0,32 m. As fontes de nutrientes mostraram pequeno efeito sobre o DMGSA e DMGEA e nenhum efeito sobre o IE.
Termos de indexação: preparo do solo, estercos, tempo de coleta, estrutura do solo, agregação.
INTRODUCTION
Soil structure has been defined as the size, shape and arrangement of the solid particles and voids, and is highly variable and associated with a complex set of interactions among mineralogical, chemical and biological factors (Letey, 1991). Although soil structure is not considered a factor directly related to crop production, it plays an important role in water and air supply to roots, root elongation, nutrient availability and macrofauna activity. A favorable structure for plant growth can be defined in terms of the presence of pores for water storage in a tension range available to crops, pores for water and air transmission and pores in which roots can grow (Oades, 1984).
For agriculture or horticulture, a soil should have not only a good structure, but also a structure which will persist for a long time, e.g., a structure of high quality and stability (Dexter, 1988). This author classifies structure stability in two principal types: (a) the ability of a soil to keep its structure under water action; and (b) the ability of moist soil to keep
its structure under the action of external mechanical stresses. The first type of structure stability is commonly evaluated through wet-sieving methods to determine aggregate stability in water, as proposed by Yoder (1936) and Kemper & Chepil (1965). The structure stability under external stresses can be determined in tests of compressibility (Gupta et al., 2002) and shear strength (Fredlung & Vanapalli, 2002).
The decrease in aggregate stability from natural conditions to intensive cultivation and the possible increase of this parameter with application of conservation tillage are usually associated with variations in the soil organic matter content (Campos et al., 1995; Silva & Mielniczuk, 1997; Castro Filho et al., 1998; Beutler et al., 2001; D’Andréa et al., 2002; Marcolan & Anghinoni, 2006; Silva et al., 2006). Both macro and microaggregates (diameter > and < 250
μm, respectively) depend on organic matter for stability against disruptive forces caused by quick wetting (Oades, 1984). According to Tisdall & Oades (1982), the organic binding agents which promote aggregate stability are classified into transient (mainly polysaccharides), temporary (roots and fungal hyphae) and persistent (amorphous oxides and resistant aromatic compounds, associated with polyvalent metal cations and strongly sorbed polymers). Since roots and hyphae stabilize macroaggregates, and soil tillage influences plant root growth and organic carbon oxidation, macroaggregation is mainly controlled by soil management and tillage (Tisdall & Oades, 1982; Oades, 1984) and can vary seasonally. On the other hand, water-stability of microaggregates depends on the persistent organic binding agents and appears to be a characteristic of the soil, less variable over time (Tisdall & Oades, 1982).
Due to the variation in biomass production and root systems, crops have different ability to promote aggregation and stabilization of soil aggregates due to carbon supply (Wohlenberg et al, 2004), mechanical effect (Tisdall & Oades, 1979; Silva & Mielniczuk, 1997, 1998; Campos et al., 1999), exudate production or mycorrhizal association (Tisdall & Oades, 1979; Tisdall, 1991; Degens, 1997), and can contribute to seasonal variation of aggregate stability over a growing season (Campos et al., 1999).
Studies of aggregate stability in different tillage systems are usually carried out at a specific time and do not necessarily reflect the effect during the entire growing season. Furthermore, few studies about annually manure applications in doses recommended only to supply nutrients, and their interactions with soil tillage are available. This study was performed with the objective to evaluate the long-term and seasonal effect of tillage systems and nutrient sources on aggregate stability, and correlations of aggregate stability with some soil physical and chemical properties.
MATERIAL AND METHODS
This study was performed using samples collected at the end of the ninth and during the tenth year of a field experiment carried out at the Epagri Experimental Station of Campos Novos (Campos Novos, SC, Brazil, 27 ° 24 ’ S, 51 ° 13 ’ W, 970 m.a.s.l.), with the objective to study long-term
effects of soil tillage and nutrient source treatments on soil properties and crop yield. The soil was a Typic Hapludox (Nitossolo Vermelho by the Brazilian Soil Classification) with 705 g kg-1 clay, 18.4 g kg-1 organic carbon, and high base saturation in the Ap horizon.
Treatments
The main treatments were a combination of residue management and soil tillage, namely: no-till (NT); chisel plowing and one secondary disking (CP); primary and two secondary diskings (CT); CT with crop residues burning (CTb); and CT with removal of crop residues from the field (CTr). The treatments were established annually in 6 x 30 m plots, perpendicular to slope, prior to sowing of spring/ summer cash crops. Crop residues were also burned or removed after harvesting of the spring/summer crops, but without tillage operations. Chiseling and primary disking broke the soil up to a depth of 0.25 and 0.15 m, respectively. Winter cover crops were sown in autumn by a direct drilling machine. A tractor with approximately 4.0 Mg and four-wheel drive was used to perform the primary tillage operations (i.e. primary disking and chisel plowing) and a tractor with approximately 2.9 Mg and two– wheel drive for the secondary tillage operations (i.e. secondary distings) and sowing. Only soybean was harvested with a combine harvester (mass of 10 Mg).
Nutrient source treatments consisted of: control -no nutrient application (C); mineral fertilizer according to technical recommendations for each crop (CFSRS/SC, 1995) (MF); 5 Mg ha-1 y-1 fresh-matter of poultry litter (PL); 60 m3 ha-1 y-1 slurry cattle manure (CM); and 40 m3 ha-1 y-1 slurry swine manure (SM). Fertilization was applied just before the spring/ summer crop sowing, in 6 x 30 m plots, transversal to tillage systems (slope direction) in each block, before the secondary tilling. The experimental design was 5 x 5 factorial, with 25 treatment combinations and three replications, in a split random block design. Crops were sown in a three-year rotation, according to the sequence: rye (Cecale cereale)/soybean (Glycine max); common vetch (Vicia sativa)/corn (Zea mays); black oat (Avena strigosa)/black bean (Phaseolus vulgaris).
Soil sampling
Aggregate stability was determined with the same cores used to establish the water retention curve. After application of 100 kPa tension, part of the sample was used to determine gravimetric water content and the remaining was carefully broken down to clods smaller than 0.008 m diameter, which passed through a 8.0 mm screen. The clods/aggregates were air-dried for 72 h under laboratory conditions and stored in metal cans shut with a lid (not hermetically closed), where they remained until the aggregate stability test was performed. These aggregates were labelled “air-dried aggregates”.
Air-dried aggregate size distribution
The air-dried aggregates (AD) were spread carefully in a plastic box using right-and-left movements, starting at one end and moving to the center of the box, in order to avoid segregation. A small plastic box with rectangular edges was used to sample approximately 25 to 30 g of air-dried aggregates all along the band of previous right-and-left disposal. At the same time, 10 to 15 g was sampled to determine gravimetric moisture.
For size distribution determination, a nest of sieves with opening screens of 4.0, 2.0, 1.0, 0.5, and 0.25 mm was used. Aggregates which passed through a sieve with 0.25 mm opening were collected at the bottom. The aggregate sample was spread on the upper sieve and the set was submitted to 12 gentle right-and-left movements, turned 90º and submitted again to 12 gentle right-and-left movements, to allow that only aggregates with a diameter greater than the respective open mesh of each sieve would be maintained on it, without applying excessive disruptive energy. The mass of aggregates retained on each sieve was used to calculate the AD geometric mean diameter (GMDAD) using the following equation:
(1)
where i denotes the aggregate classes (8.0-4.0; 4.0-2.0; 2.0-1.0; 1.0–0.5; 0.5–0.25; and < 0.25 mm), ri the ratio of aggregate mass from class i related to the total, and di the mean diameter for class i.
Wet-aggregate size distribution and stability index
The aggregates from all sieves of the previous measurements were joined for wet-aggregate stability determination. For this measurement, a method similar to the modified approach of Kemper & Chepil (1965) was used. Nests of sieves with 4.0, 2.0, 1.0, 0.5 and 0.25 mm open mesh were placed within individual PVC tubes. The water level in each tube was enough to touch the bottom of the top sieve on the upper position of the apparatus. Aggregate sample was spread on the top sieve and allowed to saturate by capillarity during approximately 1 min, and then the water level was raised until the sample in the top
sieve was just covered. Samples remained in this condition for 10 min for complete wetting, and than apparatus was, applying up-and-down movements of approximately 4.0 cm throughout the water, at a frequency of 42 times per minute. After that, the nests of sieves were removed and the aggregates remaining on each sieve were transferred to individual cans, oven-dried and weighed, to determine the aggregate mass of each class. The mass of aggregates < 0.25 mm diameter was determined as the difference of total mass of aggregates (oven-dried mass) and the sum of oven-dried mass of aggregate classes > 0.25 mm diameter. Since the sand content was low (< 3 %) in the Ap horizon, it was not removed to correct calculations of aggregate stability.
The water-stable geometric mean diameter (GMDWS) was determined using the same equation as described for size distribution of air-dried aggregates. Additionally, the aggregate stability index (SI) was determined by the relation between water-stable and air-dried mean diameter:
SI = GMDWS/GMDAD (2)
Chemical analysis
Chemical analysis was performed in disturbed samples collected at the same time as soil cores, from the layers 0.00–0.05, 0.05–0.10, 0.10–0.20 and 0.20– 0.40 m. Soil for chemical analysis was sampled at four positions in each plot, mixed, oven-dried at 60 °C during 48 h, ground with an electronic device and stored in paper boxes. The chemical analysis was performed at the Laboratory for Soil Analysis of the Epagri Research Center for Family Agriculture (Chapecó, SC), using the method described in CFSRS/ SC (1995).
Statistical analysis
The analysis of variance (ANOVA) test was run to quantify variances among tillage systems, nutrient sources, soil layer and sampling dates. Mean differences were compared using the Tukey test (p < 0.05). Due to the covariance between gravimetric moisture and aggregate stability, the procedure of general linear models was performed to determine mean differences among tillage systems in each layer, among layers within each tillage system, and among tillage systems across sampling times. The Pearson correlation was established among aggregate stability indexes and soil properties.
RESULTS AND DISCUSSION
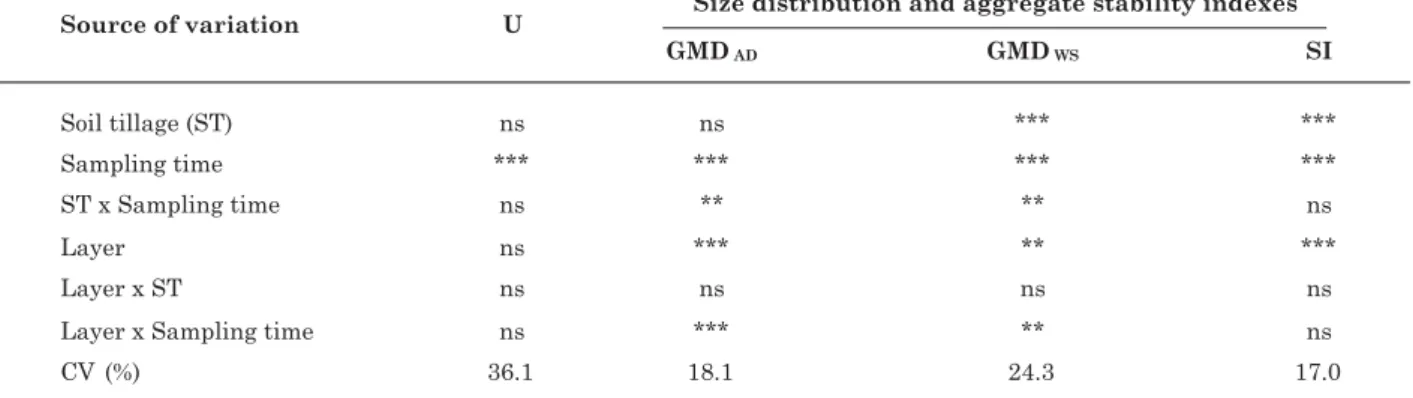
tillage systems and sampling layers and SI were observed in the dry (GMDAD) and water-stable size distributions, with interaction between these two sources of variation at the end of the ninth year of treatment application. The differences among nutrient sources were smaller, and there was no interaction with tillage systems and sampling layers. Aggregates sampled on five dates during the 10th year showed statistical differences among tillage systems for GMDws, and SI among sampling dates, layers, with interactions between sampling dates and layers or tillage systems for some parameters (Table 2). In both studies, the coefficient of variation was high, especially for GMDWS and SI, which can be partly explained by the variation in gravimetric moisture of aggregates at the time of aggregate stability determination.
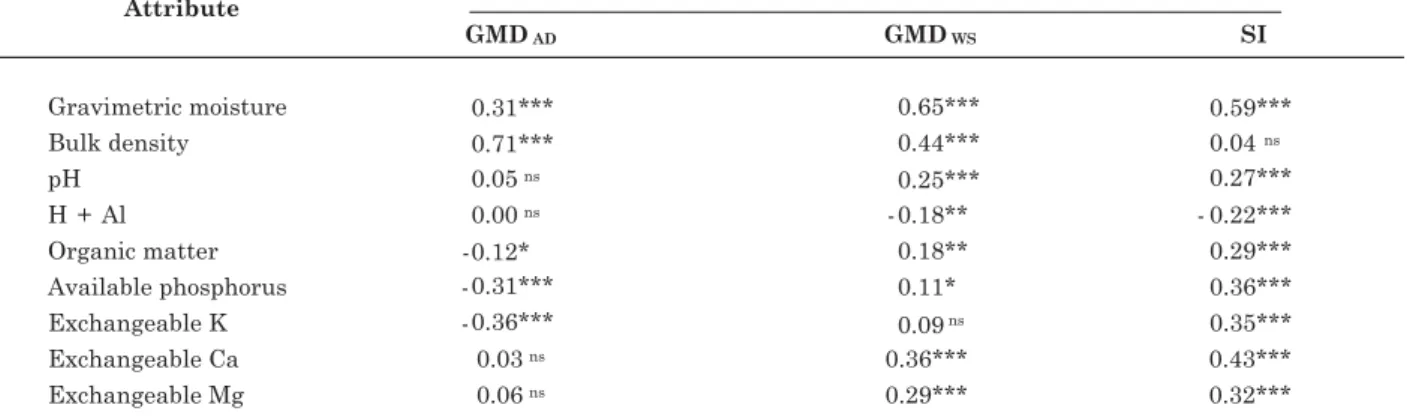
Gravimetric moisture correlated best with aggregate stability in water, both for GMDWS and SI, in soil sampled after nine years of treatment (Table 3).
When dry aggregates were allowed to saturate in contact with water at atmospheric pressure, air bubbles are entrapped inside the aggregate and are compressed by water pulled into it by capillarity, until the air bubbles burst out of the partially wetted aggregate, with its partial disintegration (Kemper & Koch, 1966). The wetter the aggregate, the smaller the effect of air bubble entrapment, which may be expressed in a high positive correlation between gravimetric moisture and aggregate stability (Table 3 and Figure 1). The size distribution of air-dried aggregates (GMDAD), on the other hand, was strongly affected by bulk density, determined in the same core as used to sample aggregates (Table 3 and Figure 2). Since almost the whole volume of the soil core sampled was used in this determination, the greater the bulk density, the greater the mean aggregate diameter obtained by the disruption of the soil core. This correlation explains part of the differences found in
Table 2. Analysis of variance (ANOVA) for size distribution and aggregate stability indexes, determined in two layers on five sampling dates in the tenth year under five tillage systems and five mineral nutrient sources
U: gravimetric moisture; GMDAD: geometric mean diameter of air-dried aggregates; GMDWS: geometric mean diameter of water-stable aggregates; and SI: aggregate stability index. ***, **, *, and ns: statistical significance at 0.1, 1 and 5 % and non-significant.
Table 1. Analysis of variance (ANOVA) for size distribution and aggregate stability indexes, determined in four layers after nine years under five tillage systems and five nutrient sources
Table 3. Pearson correlation coefficients between size distribution and aggregate stability indexes with physical and chemical properties determined in four layers, after nine years under five tillage systems and five nutrient sources
GMDAD: geometric mean diameter of air-dried aggregates; GMDWS: geometric mean diameter of water-stable aggregates; and SI: aggregate stability index. ***, **, *, and ns: statistical significance at 0.1, 1 and 5 % and non-significant.
Figure 1. Correlation between gravimetric moisture (U) at the time of testing aggregate stability, with geometric mean diameter of water-stable aggregates (GMDWS) and aggregate stability index (SI), of cores sampled in four layers after nine years under five soil tillage systems and five nutrient sources.
size distribution (Table 4). It means that soil compaction and size distribution of air-dried aggregates are well correlated, and greater values of GMDAD found in some tillage treatments or layers might be partially due to a greater compaction degree. Greater GMDAD can be due to physical approximation of soil particles caused by external stress application without subsequent stabilization, since the effect of bulk density on water stability was lower (Figure 2) as observed also by Silva & Mielniczuk (1997). Carpenedo & Mielniczuk (1990)
pointed out that the greater aggregate stability found in NT compared to CT did not result in a better quality of soil aggregates, because in both tillage systems the aggregates were compacted, with predominance of micropores, while in aggregates from soil under perennial grass, savanna or forest macroporosity and total porosity were higher. Bulk density was also highly and positively correlated with GMDWS (r = 0.44), but not with SI (r = 0.04), supporting the above statements.
Chemical parameters and organic matter had a positive and highly significant correlation with SI, and only potential acidity (H + Al) was negatively correlated (Table 3), which was not expected once cations act as bridges between organic colloids and clay, and H and multivalent are more efficient in promoting stabilization than monovalent or divalent cations (Oades, 1984). Organic matter, on the other
hand, promotes aggregate stabilization because organic binding agents may have a transient, temporary or persistent effect, depending on which binding agent is involved in stabilization (Tisdall & Oades, 1982). The correlation between pH and available phosphorus with aggregate stability is probably due to the association of these parameters with others involved in aggregate formation and stabilization.
The geometric mean diameter of air-dried aggregates was greater in the intermediate soil layer and lower in the surface layer (Table 4). In the intermediate layer, the bulk density was greater (data not shown), showing close association between both parameter (Table 3 and Figure 2). Differences among tillage systems were found in the layers 0.00–0.05 and 0.12–0.17 m. After nine years of tillage system,
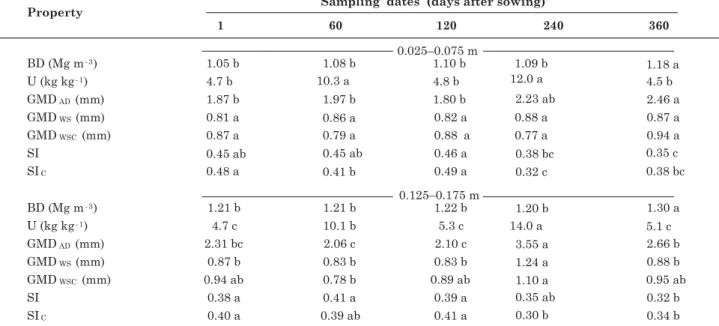
the GMDAD in the NT and CP was higher in the 0.00– 0.05 m layer, but no differences were found in the surface layer (0.025–0.075 m layer) when considering all five sampling dates performed during the tenth year (Table 5). The higher values in the surface layer of NT and CP can be explained not only by the higher organic matter content (Table 6), but also because the soil is less broken up by soil till than in the conventional systems (CT, CTb and CTr). This statement can be confirmed by the increase in GMDAD 240 and 360 days after sowing (Table 7), when natural soil reconsolidation occurred, resulting in increased bulk density.
There were differences in GMDWS among tillage systems and layers (Table 4). Since this determination was highly correlated with aggregate moisture at the
Table 4. Size distribution and aggregate stability indexes in four layers, after nine years under five tillage systems (averaged across nutrient sources)
time of aggregate stability analysis (Table 3 and Figure 1), differences among means were also compared with least square means, using general linear models and considering covariance among these variables, both for tillage system within each layer and for layer within each tillage system. This procedure improved the mean differentiation among soil tillage in each layer, despite the low variability in aggregate moisture within each one, and corrected mean values for soil layers, where the variation in aggregate moisture was greater due to variation in storage time among them (data not shown).
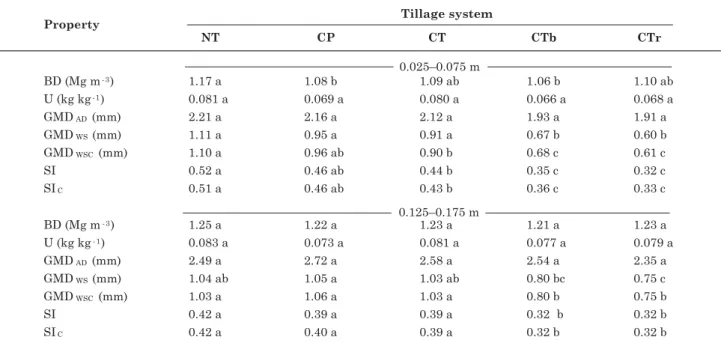
Greater differentiation in GMDWS among tillage systems was found in the surface layer (Tables 4 and 5). NT system showed greater GMDWS in the 0.00– 0.05 m layer, CT in 0.05–0.10 and 0.12–0.17 m layer, and CP intermediate values. A similar trend as in 0.00–0.05 m was observed in the 0.025–0.075 m layer when soil cores were sampled on five dates during the tenth year of treatments (Table 5). These results can be explained by the differences among tillage systems concerning crop residue disposition after tillage (on the surface in NT, partly incorporated in CP and incorporated in the arable layer in CT) and,
Table 5. Bulk density, gravimetric moisture at time of water aggregate stability test, size distribution and aggregate stability indexes at two layers and in five tillage systems (averaged across sampling dates performed during the tenth year)
NT: no-till; CP: chisel plowing; CT: conventional tillage; CTb: CT with crop residues burned; and CTr: CT with crop residues removed; GMDAD: geometric mean diameter of air-dried aggregates; GMDWS: geometric mean diameter of water-stable aggregates; GMDWSC: geometric mean diameter of water-stable aggregates corrected to aggregate moisture; SI: aggregate stability index; SIC: aggregate stability index, corrected to aggregate moisture; U: gravimetric moisture; and BD: bulk density. Means followed by the same lower case letters in a given row do not differ statistically (Tukey, p < 0.05).
Table 6. Organic matter content in four layers after nine years under five tillage systems (averaged across nutrient sources)
consequently, by the aggregate stability promoted by transient and temporary organic binding agents resulting from the crop residue decomposition (Tisdall & Oades, 1982). Soil organic carbon content and organic matter supply are usually correlated to aggregate stability, as determined in other studies which compared tillage systems (Castro Filho et al., 1998; Beutler et al., 2001; D’Andréa et al., 2002; Wohlenberg et al., 2004; Marcolan & Anghinoni, 2006; Silva et al., 2006). This is also confirmed by the much lower values of GMDWS found in three surface layers in tillage treatments where crop residues were burned (CTb) or removed from the field (CTr). Only NT system showed greater GMDWS in the surface layer. The other tillage systems showed higher GMDWS in intermediate or lower sampling layers.
Highest SI values were found in the surface layer (0.00–0.05 m) in tillage systems with crop residues maintained on the field, which is related to organic matter supply (Wohlenberg et al., 2004), and there were no differences among layers when crop residues were burned (CTb) or removed (CTr) after applying the correction to antecedent moisture (Tables 4 and 5). The variation of SI among sampling dates (Table 7) is related to the dynamics of supply and decomposition of organic matter, which is greater after straw addition and decreases in the intervals.
The effect of the nutrient sources, which in this study also have, on average, low C:N carbon sources,
Table 8. Size distribution and aggregate stability indexes after nine years under five nutrient sources (averaged across five tillage systems and four layers)
GMDAD: geometric mean diameter of air-dried aggregates; GMDWS: geometric mean diameter of water-stable aggregates; and SI: aggregate stability index. Means followed by the same letter in a given column do not differ statistically (Tukey, p < 0.05).
was small on size distribution of GMDAD and GMDWS and not detected on SI (Table 8). Among nutrient sources, the mean diameter of aggregates in poultry litter and cattle manure was greater than others, probably because in both manures the amount of organic material with high C:N ratio is greater, from which persistent binding agents are derived (Tisdall & Oades, 1982), as well as greater fungi development during decomposition. The low effect of nutrient
Table 7. Bulk density, gravimetric moisture at time of water aggregate stability test, size distribution and aggregate stability indexes at two layers and in five sampling dates performed during the tenth year (averaged across tillage systems)
sources on size distribution and aggregate stability can be associated to the low rates applied (only for nutrient supply) and high soil clay content, since the effect of organic matter is more pronounced in soils with higher application of organic material (Weil & Kroontje, 1979) or containing smaller amounts of the finer particle class (Baver et al., 1972).
CONCLUSIONS
1. Air-dried aggregate size distribution is strongly affected by bulk density, and greater values of geometric mean diameter are found in no-till and chisel plow systems, or in compacted layers under conventional tillage system. The stability index is highly correlated with previous gravimetric aggregate moisture. In treatments where crop residues are maintained in the field, the stability index in the surface layer is greater, which is associated with organic matter supply. Soil tillage did not affect aggregation in the 0.27–0.32 m layer.
2. The geometric mean diameter of water-stable aggregates in the no-till system was highest in the 0.00–0.05 m layer, lowest in the 0.05–0.10 and 0.12– 0.17 m layers under conventional tillage, and intermediate under chisel plowing. The effect of nutrient sources on aggregate stability is lower than of tillage systems after nine years of annual application.
LITERATURE CITED
BAVER, L.D.; GARDNER, W.H. & GARDNER, W.R. Soil physics. 4.ed. New York, John Wiley & Sons, 1972. 498p. BEUTLER, A.N.; SILVA, M.L.N.; CURI, N.; FERREIRA, M.M.; PEREIRA FILHO, I.A. & CRUZ, J.C. Agregação de Latossolo Vermelho distrófico típico relacionado com o manejo na região dos cerrados no Estado de Minas Gerais. R. Bras. Ci. Solo, 25:129-136, 2001.
CAMPOS, B.C.; REINERT, D.J.; NICOLODI, R.; RUEDELL. J. & PETRERE, C. Estabilidade estrutural de um Latossolo Vermelho-Escuro distrófico após sete anos de rotação de culturas e sistemas de manejo do solo. R. Bras. Ci. Solo, 19:121-126, 1995.
CAMPOS, B.C.; REINERT, D.J.; NICOLODI, R. & CASSOL, L.C. Dinâmica da agregação induzida pelo uso de plantas de inverno para cobertura do solo. R. Bras. Ci. Solo, 23:383-391, 1999.
CARPENEDO, V. & MIELNICZUK, J. Estado de agregação e qualidade de agregados de Latossolos Roxos, submetidos a diferentes sistemas de manejo. R. Bras. Ci. Solo, 14:99-105, 1990.
CASTRO FILHO, C.; MUZILLI, O. & PODANOSCHI, A.L. Estabilidade dos agregados e sua relação com o teor de carbono orgânico num Latossolo Roxo distrófico, em função de sistemas de plantio, rotações de culturas e métodos de preparo das amostras. R. Bras. Ci. Solo, 22:527-538, 1998.
COMISSÃO DE FERTILIDADE DO SOLO – CFSRS/SC. Recomendação de adubação e de calagem para os Estados do Rio Grande do Sul e Santa Catarina. 3.ed. Passo Fundo, SBCS-Núcleo Regional Sul, 1995. 223p.
D’ANDRÉA, A.F.; SILVA, M.L.N.; CURI, N. & FERREIRA, M.M. Atributos de agregação e indicadores de qualidade do solo em sistemas de manejo na região dos Cerrados no Sul do Estado de Goiás. R. Bras. Ci. Solo, 26:1047-1054, 2002. DA ROS, C.O.; SECCO, D.; FIORIN, J.E.; PETRERE, C.;
CADORE, M.A. & PASA, L. Manejo do solo a partir de campo nativo: Efeito sobre a forma e estabilidade da estrutura ao final de cinco anos. R. Bras. Ci. Solo, 21:241-247, 1997.
DEGENS, B.P. Macro-aggregation of soils by biological bonding and binding mechanisms and the factors affecting these: A review. Aust. J. Soil Res., 35:431-459, 1997.
DEXTER, A.R. Advances in characterization of soil structure. Soil Till. Res., 11:199-238, 1988.
FREDLUND, D.G. & VANAPALLI, S.K. Shear strength of unsaturated soils. In: DANE, J.H. & TOPP, G.C., eds. Methods of soil analysis: Physical methods. Madison, Soil Science Society of America, 2002. Part 4. p.329-361. (SSSA Book Series, 5)
GUPTA, S.C.; BRADFORD, J.M. & DRESCHER, A. Soil compressibility. In: DANE, J.H. & TOPP, G.C., eds. Methods of soil analysis: Physical methods. Madison, Soil Science Society of America, 2002. Part 4. p.399-415. (SSSA Book Series, 5)
HAMBLIN, A.P. Changes in aggregate stability and associated organic matter properties after direct drilling and ploughing on some Australian soils. Aust. J. Soil Res., 18:27-36, 1980.
KEMPER, W.D. & CHEPIL, W.S. Size distribution of aggregates. In: BLACK, C.A.; EVANS, D.D.; WHITE, J.L.; ENSMINGER, L.E. & CLARK, F.E., eds. Methods of soil analysis. Madison, American Society of Agronomy, 1965. Part 1. p.499-510, (Agronomy Series, 9)
KEMPER, W.D. & KOCH, E.J. Aggregate stability of soils from Western United State and Canada. Washington, Agricultural Research Service/USDA, 1966. 52p. (Technical Bulletin, 1355)
LETEY, J. The study of soil structure: Science or art. Aust. J. Soil Res., 29:699-707, 1991.
MARCOLAN, A.L. & ANGHINONI, I. Atributos físicos de um Argissolo e rendimento de culturas de acordo com o revolvimento do solo em plantio direto. R. Bras. Ci. Solo, 30:163-170, 2006.
SILVA, I.F. & MIELNICZUK, J. Avaliação do estado de agregação do solo afetado pelo uso agrícola. R. Bras. Ci. Solo, 22:313-319, 1997.
SILVA, I.F. & MIELNICZUK, J. Sistemas de cultivo e características do solo afetando a estabilidade dos agregados. R. Bras. Ci. Solo, 21:311-317, 1998.
SILVA, M.A.S.; MAFRA, A.L.; ALBUQUERQUE, J.A.; DALLA ROSA, J.; BAYER, C. & MIELNICZUK, J. Propriedades físicas e teor de carbono orgânico de um Argissolo Vermelho sob distintos sistemas de uso e manejo. R. Bras. Ci. Solo, 30:329-337, 2006.
TISDALL, J.M. Fungal hyphae and structural stability of soil. Aust. J. Soil Res., 29:729-743, 1991.
TISDALL, J.M. & OADES, J.M. Stabilization of soil aggregates by the root systems of ryegrass. Aust. J. Soil Res., 17:429-441, 1979.
TISDALL, J.M. & OADES, J.M. Organic matter and water-stable aggregates in soils. J. Soil Sci., 33:141-163, 1982. YODER, R.E. A direct method of aggregate analysis of soils
and a study of the physical nature of erosion losses. J. Am. Soc. Agron., 28:337-351, 1936.
WEIL, R.R. & KROONTJE, W. Physical condition of a Davidson Clay Loam after five years of heavy poultry manure applications. J. Environ. Qual., 8:387-392, 1979. WOHLENBERG, E.V.; REICHERT, J.M.; REINERT, D.J. &