MODELLING THE RISK OF NITRATE LEACHING
FROM TWO SOILS AMENDED WITH FIVE
DIFFERENT BIOSOLIDS
(1)Rodrigo Studart Corrêa(2), Robert Edwin White(3) & Anthony James Weatherley(4)
SUMMARY
High N concentrations in biosolids are one of the strongest reasons for their agricultural use. However, it is essential to understand the fate of N in soils treated with biosolids for both plant nutrition and managing the environmental risk of NO3--N leaching. This work aimed at evaluating the risk of NO3--N leaching
from a Spodosol and an Oxisol, each one treated with 0.5–8.0 dry Mg ha-1 of fresh
tertiary sewage sludge, composted biosolids, limed biosolids, heat-dried biosolids and solar-irradiated biosolids. Results indicated that under similar application rates NO3--N accumulated up to three times more in the 20 cm topsoil of the
Oxisol than the Spodosol. However, a higher water content held at field capacity in the Oxisol compensated for the greater nitrate concentrations. A 20 % NO3--N
loss from the root zone in the amended Oxisol could be expected. Depending on the biosolids type, 42 to 76 % of the NO3--N accumulated in the Spodosol could be
expected to leach down from the amended 20 cm topsoil. NO3--N expected to
leach from the Spodosol ranged from 0.8 (composted sludge) to 3.5 times (limed sludge) the amounts leaching from the Oxisol treated alike. Nevertheless, the risk of NO3--N groundwater contamination as a result of a single biosolids land
application at 0.5–8.0 dry Mg ha-1 could be considered low.
Index terms: biosolids, sewage sludge, nitrogen leaching.
(1) Research at the University of Melbourne sponsored by CNPq and SEMARH/DF. Recebido para publicação em abrill de 2003 e aprovado em maio de 2005.
(2) Lecturer at the Department of Forestry of the “Universidade de Brasília”. Caixa Postal 10.814, CEP 70324-980 Brasilia (DF), Brazil. E-mail: [email protected]
(3) Professor of Soil Science at the University of Melbourne – ILFR. Victoria 3010, Australia. E-mail: [email protected] (4) Lecturer at the Institute of Land and Food Resources of the University of Melbourne-ILFR. Victoria 3010, Australia. E-mail:
RESUMO: MODELAGEM DO RISCO DE LIXIVIAÇÃO DE NITRATO EM DOIS SOLOS TRATADOS COM CINCO DIFERENTES BIOSSÓLIDOS
Concentrações altas de nitrogênio (N) em biossólidos são uma das maiores razões para a utilização agronômica deles. Entretanto, é essencial entender o destino do N em solos tratados com biossólidos, tanto por motivos de nutrição vegetal quanto para manejar o risco ambiental representado pela lixiviação de nitrato. Este trabalho teve como objetivo avaliar o risco de lixiviação de nitrato em um Espodossolo e em um Latossolo, cada um tratado com doses de 0,5 a 8,0 Mg ha-1 de biossólido fresco, biossólido compostado, biossólido caleado, biossólido seco a calor e biossólido irradiado por sol. Os resultados mostraram que, para doses iguais de aplicação, o nitrato acumulou-se até três vezes mais na camada superficial de 20 cm do Latossolo do que do Espodossolo. Entretanto, a maior capacidade de campo do Latossolo compensou as maiores concentrações de nitrato e espera-se a lixiviação de 20 % do nitrato acumulado na camada superficial desse solo. Dependendo do tipo de biossólido, entre 42 e 76 % do nitrato acumulado no Espodossolo serão lixiviados. A expectativa de lixiviação de nitrato no Espodossolo variou de 0,8 (biossólido compostado) a 3,5 vezes (biossólido caleado) em relação ao Latossolo tratado de maneira similar. Entretanto, o risco de contaminação de aqüíferos por lixiviação de nitrato nos solos tratados com uma dose única de biossólidos entre 0,5 e 8,0 Mg ha-1 foi considerado baixo.
Termos de indexação: biossólidos, lodo de esgoto, lixiviação de nitrato.
INTRODUCTION
The constantly growing quantities of sewage sludge (biosolids) have led to their use as a source of
organic matter for soils (Pascualet al., 1997). The
idea of feeding valuable organic matter, containing primarily nitrogen (N) and phosphorus (P), back into the natural cycle forms the basis of using biosolids on land (Frank, 1998). High concentrations of N and P compared to manures and other organic matter sources are one of the strongest reasons for applying biosolids to soils.
Heavy metals, diseases, and environmental hazards related to the high N and P contents in biosolids stand out among the problems arising with the application of sewage materials to land. Therefore, health safety standards, maximum rates and frequency of application have been set according to the concentrations of pathogens, N, and heavy metals in biosolids. The USEPA Part 503 rule (USEPA, 1995) alludes to the need for the application of biosolids at agronomic rates based on biosolids’ N content and the crop’s N need.
Nutrient enrichment may lead to eutrophication of surface water and contamination of groundwater, which is strongly linked to N and P pollution originating from agriculture and waste sources
(Sharpleyet al., 1999). P in water is not considered
directly toxic to humans and animals and therefore drinking water standards for P have not been
established so far. On the other hand, NO3- is
reduced to NO2 in human intestine and can cause
methemoglobinemia in human infants if NO3- is
present in sufficient quantity in drinking water. As a result, water is considered inappropriate for
human consumption when NO3--N concentrations
reach values of 10 mg L-1 or higher (Haering et al.,
2000). According to Polgase & Robison (1996), NO3
-leaching and subsequent groundwater contamination is potentially one of the most important factors limiting the long-term viability of biosolids application to land.
Two broad considerations in modelling NO3
-leaching are generally taken into account: the net
input of NO3- into soil and the transport of NO3- with
water through the soil (White et al., 1998). NO3--N
leaching can be simulated by several models at various levels of detail and complexity in respect of temporal and spatial scales. One of the simplest simulations is the screening analysis that provides
a rapid means of identifying potential NO3- leaching
problems (Shaffer et al., 1991). The screening
approach uses a simplified water balance and the
amount of NO3--N available for leaching. Shaffer et
al. (1991) encourage the use of a screening analysis first, and then the use of more detailed approaches
if significant amounts of NO3--N are expected to
leach.
Our study aimed at evaluating the environmental risk associated with the agronomic use of biosolids. This risk was evaluated through the potential
leaching of N as NO3--N from two contrasting soils
MATERIAL AND METHODS
Sludge stabilization
A 500 kg sample of fresh tertiary treated biological domestic sewage sludge was taken at Coliban Water Treatment Works in Victoria (Australia) as raw material for stabilized biosolids (composted, limed, heat dried, and solar irradiated biosolids). The fresh sample was analysed in triplicate for gravimetric
water content (105 oC for 48 h), total-N (dry
combustion method), and mineral-N (Kjeldahl steam
distillation - NH4+-N + NO3--N) method as described
in Rayment & Higginson (1992).
Then, fresh sewage sludge (878 g kg-1 moisture,
bulk density = 1.2 Mg m-3, C/N ratio = 6.2) were
mixed with enough hardwood sawdust and woodchips (bulk agents) to achieve a C/N ratio = 25:1. Three 450 L composting piles were pitched on a
sheltered cement pavement, run at 35–65 oC for
34 days, let to mature for another 60 days and sieved at 2 mm. Lime stabilization used CaO at a 30 % rate to fresh biosolids’ dry solids (weight/weight). Heat
drying was performed in a furnace at 250 oC until
constant weight. The heat-dried biosolids were ground and passed through a 2 mm sieve. For the solar irradiation process, three 10 kg fresh sludge samples were stored in freely drained plastic bowls under transparent plastic-covers under sunny conditions for 14 days during Melbourne’s summer (Australia),
with daily temperatures ranging from 12.8–26.5 oC.
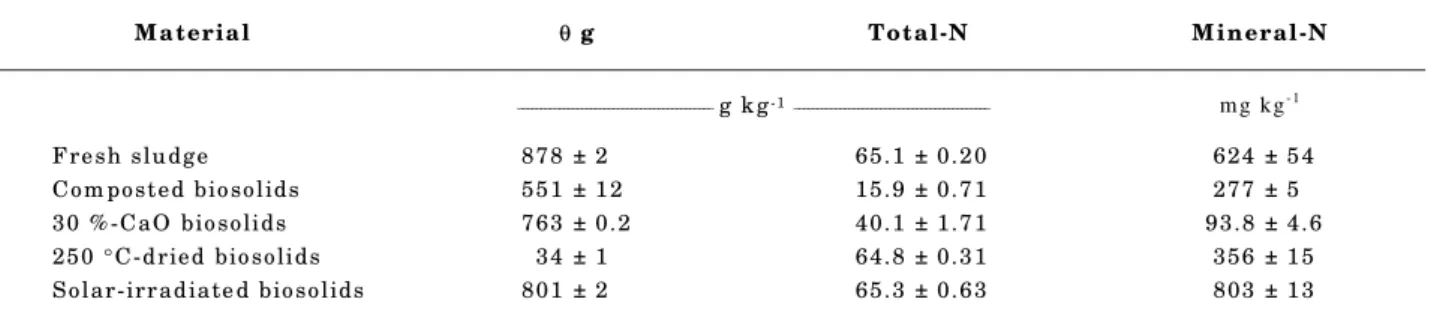
The stabilization criteria established in USEPA (1995) were achieved in all the employed processes. All biosolids were analysed in triplicate for gravimetric water, total-N, mineral-N, using the same analytical methods for the fresh sludge (Table 1).
Soils
Two contrasting soils (Table 2) were selected to be amended with the five biosolids: a sandy “Espodossolo Cárbico Órtico” (Spodosol) and a clayey “Latossolo Vermelho Perférrico” (Oxisol) (Embrapa, 1999). Both soils had their 10 cm top layer removed before being collected from native areas. The aim was to simulate barren land situations, namely low
organic matter and nutrient contents. Such conditions can better isolate the effects of biosolids from any other organic matter previously present in the soils. A 200 kg sample of the Spodosol was collected from 10–30 cm depth. Another 200 kg sample of the Oxisol was collected from 10–50 cm depth. Both soils were air-dried for 2 weeks and then passed through a 4 mm sieve.
Soil physical characteristics
Blank and biosolids-amended soil samples were
analysed in triplicate for texture, bulk density-ρb,
total porosity-PSR and field capacity-FC (Cassel & Nielsen, 1986) before incubation for the simulation
of NO3--N leaching (Table 2).
Mineralisation experiment
Triplicate 1.5 kg soil samples were amended with
0.5, 1.0, 2.0, 4.0, 6.0, and 8.0 dry Mg biosolids ha-1
and filled in 1.7 L free-draining pots. The amended-soils were wetted with deionised water to their pot capacity, as described by Cassel & Nielsen (1986), and covered with plastic lids punched with three 4 mm holes.
Table 2. Some characteristics of the two selected soils (means ± standard deviations, n = 3)
Characteristic Spodosol Oxisol
(10–30 cm) (10–50 cm)
Total-N (g kg-1) 0.38 ± 0.03 1.6 ± 0.11
Mineral-N (mg kg-1) 0.1 ± 0.01 5.0 ± 0.08
pH [1:5 water (w/v)] 4.9 ± 0.1 5.0 ± 0.1
Clay (g kg-1) 48 ± 3 499 ± 38
Silt (g kg-1) 37 ± 1 145 ± 9
Sand (g kg-1) 915 ± 21 356 ± 19
θb (Mg m-3) 1.6 ± 0.1 0.9 ± 0.1
PSR (m3 m-3) 0.41 ± 0.01 0.67 ± 0.08
FC (m3 m-3) 0.07 ± 0.02 0.31 ± 0.02
Table 1. Moisture (θθθθθg), total-N, and mineral-N of biosolids (means ± standard deviations, n = 3)
M aterial θ g Total-N M ineral-N
___________________________________________g kg-1___________________________________________ m g k g- 1
Fresh sludge 878 ± 2 65.1 ± 0.20 624 ± 54
Com posted biosolids 551 ± 12 15.9 ± 0.71 277 ± 5
30 % -CaO biosolids 763 ± 0.2 40.1 ± 1.71 93.8 ± 4.6
250 °C-dried biosolids 34 ± 1 64.8 ± 0.31 356 ± 15
Pots containing amended soils were incubated
at 25 oC (± 1 oC) in a high humidity chamber (95 %
air moisture) for 12 hours light/day during 23 weeks for a non-leaching experiment. Three pots containing 1.5 kg blank-Spodosol and three with blank-Oxisol were placed together with the others as control. Blank control soils and amended soils were mixed prior to each sampling, which occurred on day 0 and after 1, 3, 7, 15, and 23 weeks. Pots were randomised weekly and deionised water was sprayed over the surface every second week to replace moisture losses.
Nitrate recovery from incubated soils
Incubated soil samples were extracted in
triplicate from each pot with a 2 mol L-1 KCl solution
at 1:10 material/solution ratio and shaken for 1 hour. Extracts were immediately filtered through Whatman 42 paper filters and analysed on the same
day for NO3--N by the Kjeldahl steam distillation
method as described by Rayment & Higginson (1992). Means from each pot were grouped per treatment (three pots each) to calculate treatment means.
Data for modelling
The modelling of NO3--leaching was based on the
data collected from soil samples analysed on day 0
and in the 1st, 3rd, 7th, 15th and 23rd weeks of
incubation (six months of trial). Monthly rainfall and pan-evaporation data (long-term means for Melbourne, latitude 37.81 South and longitude 144.97 East) were provided by the Bureau of Meteorology. Pan-evaporation values were converted to effective evapotranspiration by multiplying by the crop factor - 0.8 (Table 3).
NO3--N leaching model
NO3--N expected to leach from the amended
20 cm topsoils was modelled based on the studies of Shaffer et al. (1991) and White et al. (1998). Shaffer et al. (1991) introduced the Nitrate Leaching and Economic Analysis Package - NLEAP as a rapid and
site-specific model for the estimation of NO3--N
leaching potential. NLEAP uses an exponential probability density function (pdf) for predicting N leached for periods of time or cumulative drainage, which can be calculated as precipitation in excess of
evaporation from meteorological data (Whiteet al.,
1998). Because the input variables are easily measured, White et al. (1998) point out the great potential of exponential pdf as a management tool. Edis (1998) explains that indigenous solutes such
as NO3--N formed in soil are generally distributed
throughout the water-filled porosity, which means that pdf-based models could describe changes in
drainage flux of NO3--N concentrations
advanta-geously (White et al., 1998). Using such a pdf
approach, NO3--N expected to leach (NL) from the
incubated soils’ 20 cm layer was calculated by the formula:
− − =
FC R exp 1 N
NL O (Equation 1)
where N0 is the amount of NO3--N available in a
given soil layer (kg ha-1), R is surplus water for
leaching (mm), and FC the field capacity of the soil
layer (mm). Values of N0 (kg ha-1) were derived from
the NO3--N concentrations (mg kg-1 soil) measured
in weeks 0, 1, 3, 7, 15 and 23 of soil incubation. The distance the leachate was transported through the soil profile in time was calculated according to White (1997):
FC R ) t (
z = (Equation 2)
where Z is the distance (mm), t is a given time, R is surplus water for leaching (mm), and FC is the field
capacity of the soil layer (m3 m-3).
Data transformation from mg kg-1 to kg ha-1
and mg L-1 considered a 20 cm soil layer, soil FC and
bulk density. Analysis of variance and Tukey test
were performed with Minitab® 12.1 for Windows.
RESULTS AND DISCUSSION
NO3--N available for leaching (N0)
From the environmental point of view, NO3--N
accumulation in soils should be avoided. However, mineralization of biosolids’ organic N and nitrification occurred in all amended soil samples
Table 3. Some long-term climate data for Melbourne
Month Rainfall Effective
evapotranspiration
Surplus water for leaching
________________________________________________ mm ________________________________________________
January 48.7 148.8 -100.1
February 47.5 127.7 -82.2
March 51.0 101.7 -50.7
April 57.8 62.4 -4.6
May 57.3 48.1 9.2
June 50.0 29.6 20.4
July 48.2 38.7 9.5
August 50.5 44.6 5.9
September 59.0 62.4 -3.4
October 67.3 91.8 -24.5
November 59.9 112.8 -59.9
December 59.6 136.3 -76.7
thereafter. Nitrification increased N0 according to
both application rate and time and as a result
accumulated a maximum of 36 kg ha-1 of NO
3--N in
the Spodosol and 86 kg ha-1 of NO
3--N in the Oxisol
after 23 weeks of biosolids-soil incubation (Table 4). Based on the concept that N loss is related to the amount of potentially leachable N present in soil,
the risk of NO3--N leaching from soils treated with
biosolids would be greater with increased application rates and time.
For the same biosolids and application rate, amounts of nitrified and accumulated N varied in the two contrasting soils. Nitrification in the Spodosol was highest for solar-irradiated biosolids,
then fresh = 30 %-CaO > composted = 250 oC-dried
biosolids. NO3--N accumulated three times as much
in the Spodosol treated with solar-irradiated
biosolids as with 250 oC-dried biosolids (Table 4).
Amounts of NO3--N produced in incubated Oxisol
could be ranked as fresh = solar-irradiated > 250 o
C-dried = composted, which is equivalent to 30 %-CaO biosolids. There was also an approximately three-fold difference between the highest and the lowest
NO3--N contents accumulated in the Oxisol (Table 4).
Finally, the Spodosol and Oxisol treated with fresh and solar-irradiated biosolids ended up with the
highestNO3--N concentrations. These two biosolids
manifested the highest potential for nitrate leaching,
whereas the application of composted or 250 oC-dried
biosolids to the soils would pose the least risk under the given experimental conditions.
The 250 oC-dried biosolids incubated in the
Spodosol remained under 4 mg NO3--N kg-1 soil
throughout the entire trial, which poses no threat to groundwater. Low nitrification rates are frequently reported when heat-dried biosolids are incorporated into soils (Smith et al., 1998). Considering that soil pH, temperature and moisture were not unfavourable for the occurrence of nitrification during the experiment, the heat treatment, which sterilises sewage sludge for all kinds of organisms, must have caused a shortage of
nitrifying organisms in the 250 oC-dried biosolids.
Smith et al. (1998) observed different NO3--N
concentrations in twelve biosolids incubated in soils.
They found that the NO3--N accumulation rate in
soils was controlled by soil type and stability of the organic N contained in biosolids. Dewatering
significantly reduces NO3- formation in amended
soils through the removal of soluble NH4+-N (Smith
et al., 1998). Similar results were found by Shepherd
(1996) who reported that a lower initial NH4+-N
content and mineralisation rates result in lower NO3
--N formation and less leaching from sludge-amended soils.
Modelling NO3--N leaching based on incubated
amended soils over time and without plant N uptake
displays the worst scenario since NO3- leaching is
higher in fallow soils than those where plants grow
(Laverman, 2000). Crop N uptake reduces leaching
and NO3--N losses from planted fields are likely to
occur only when the crop N need is exceeded (Shepherd, 1996).
The Oxisol accumulated up to three times more
N0 in the 20 cm topsoil (kg ha-1) than the Spodosol
treated alike (Table 4). But as the Oxisol can hold approximately four times more water at FC than
the Spodosol (Table 2), it can compensate higher N0
values.
Soil water infiltration (R)
Water drainage is the most important factor for nitrate movement downwards into the soil profile (Edis, 1998). Under the present experimental conditions, the water drained in June was twice as much as in May and July and over three times as much as in August (Table 3). Since the highest risk
of NO3--N leaching from biosolids-amended soils
occurred in June, this was the only month considered for modelling.
Field capacity (FC)
Soil incorporation of biosolids is frequently reported to improve the soil structure and a higher amount of water held at FC may be expected (Joshua et al., 1998). Nevertheless, there were no significant changes in the physical characteristics of the Oxisol and the Spodosol caused by biosolids incorporation
at 0.5–8.0 dry Mg ha-1, except through the
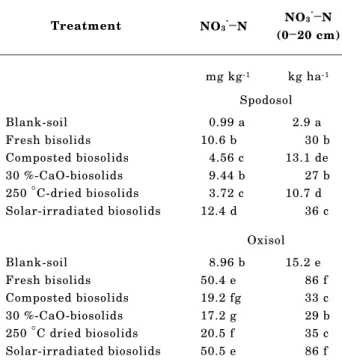
Table 4. Maximum NO3--N concentrations retrieved
from blank and amended-soils during 23 weeks of incubation
Treatment NO3-—N NO3
-—
N
(0—20 cm)
mg kg-1 kg ha-1
Spodosol
Blank-soil 0.99 a 2.9 a
Fresh bisolids 10.6 b 30 b
Composted biosolids 4.56 c 13.1 de
30 %-CaO-biosolids 9.44 b 27 b
250 °C-dried biosolids 3.72 c 10.7 d
Solar-irradiated biosolids 12.4 d 36 c
Oxisol
Blank-soil 8.96 b 15.2 e
Fresh bisolids 50.4 e 86 f
Composted biosolids 19.2 fg 33 c
30 %-CaO-biosolids 17.2 g 29 b
250 °C dried biosolids 20.5 f 35 c
Solar-irradiated biosolids 50.5 e 86 f
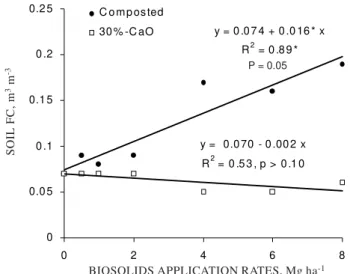
incorporation of composted biosolids in the Spodosol (Figure 1). The application of composted biosolids linearly increased the water content held at FC, which may significantly reduce water percolation from the 20 cm amended topsoil.
Although not significant at p = 0.10, an opposite effect was noticed in the Spodosol treated with 30 %-CaO biosolids where the water content at FC tended to decrease (Figure 1). A reasonable explanation could not be found, but the application of CaO on the Spodosol seems to have a negative effect on the soil structure and needs to be further investigated. Biosolids rates required to alter the soil’s physical characteristics have been reported as very high.
Epstein (1997) had to incorporate 100 dry Mg ha-1
of fresh sewage sludge to a silt loam soil to observe a shifted soil water retention curve. Magesan et al. (1996) had to apply domestic sewage sludge consecutively for five years to a sandy soil in order to increase PSR and hydraulic conductivity. Such high application rates are not justified to avoid water percolation from soils, since the produced and
leached NO3--N amounts would probably offset the
higher water amounts retained at FC.
NO3--N expected to leach (NL)
Data fitted to Equation 1 have shown that NO3--N
expected to leach from amended soils (NL) ranged
from 20 % to 76 % of the NO3--N available for
leaching (N0), depending on both biosolids and soil
types (Figure 2). Higher NO3--N concentrations in
the Oxisol were in fact counterbalanced by higher
amounts of water held at FC. As a result, top NO3--N
concentrations expected to leach down from Oxisol treated with fresh or solar-irradiated biosolids
reached 17 kg ha-1 against 21–24 kg ha-1 from
Spodosol amended with solar-irradiated and 30 %-CaO biosolids (Figure 2).
Figure 2 depicts the combined effect of N0 and
FC on NL. As biosolids applied at 0.5–8.0 dry Mg ha-1
did not change the Oxisols’s water content at FC,
NL depended on the amounts of mineralised and
nitrified N in this soil over the trial period. A fixed 20 % loss of the nitrate stocked in the 20 cm
amended-Oxisol topsoil (N0) was expected to leach regardless
of the biosolids type (Figure 2). Composted and 30 %-CaO biosolids altered water content at FC in
the Spodosol and different N0 proportions were due
to leach (NL) from this soil: NL was 42 % of N0 from
Spodosol treated with composted biosolids, 66 % for
soil samples treated with fresh, 250 oC-dried and
solar-irradiated biosolids, and 76 % of N0 from the
Spodosol treated with 30 %-CaO biosolids (Figure 2).
As long as NO3--N contamination of groundwater is a
concern, solar-irradiated and 30 %-CaO biosolids should not be applied to Spodosols. Composted and
250 oC-dried biosolids would be more appropriate to
be used in such soils.
At a similar NO3--N concentration in both soils,
nitrate would leach between 3–4 times more from the Spodosol‘s topsoil than from the Oxisol‘s (Figure 2). However, mineralization and nitrification rates of biosolids were different in the two soils. As a result, at the same biosolids and application rate
the amounts of NO3--N expected to leach from the
Spodosol’s 20 cm topsoil (kg ha-1) ranged from 0.8
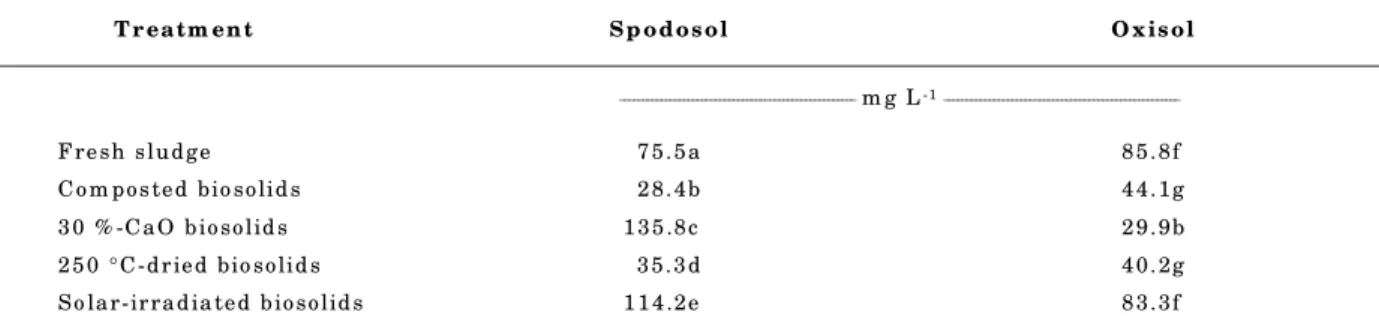
(composted biosolids) to 3.5 the amounts due to leaching from the topsoil of the Oxisol (Table 4 versus Figure 2). Nevertheless, leachate from the Spodosol was from 0.6 (composted biosolids) to 4.5 times (30 %-CaO biosolids) the nitrate concentrations leached from the Oxisol (Table 5).
Figure 2. Regression of NO3--N expected to leach
(NL) on NO3--N available for leaching (N O) for
amended Spodosol and Oxisol considering 20 cm topsoil.
y = 0.65 + 0.20** x
R2 = 0.99** 30% -C aO
y = - 0.02 + 0.76** x
R2 = 0.99**
Fresh, 250oC-dried, irradiated y = - 0.03 + 0.66** x
R2 = 0.99**
Composted y = 0.23 + 0.42* x
R2 = 0.89*
0 5 10 15 20 25 30
0 10 20 30 40 50 60 70 80 90
Espodossolo
Latossolo
NO3--N AVAILABLE FOR LEACHING (N0), kg ha-1
NO
3
- -N
EXPECTED T
O
LEACH (N
L
), kg ha
-1
Figure 1. Spodosol’s field capacity (FC) responses to the application of composted and 30 %-CaO biosolids.
y = 0 .0 7 4 + 0 .0 16 * x
R2 = 0 .8 9 *
y = 0.0 70 - 0 .00 2 x
R2 = 0 .5 3 , p > 0 .1 0
0 0.0 5 0 .1 0.1 5 0 .2 0.2 5
0 2 4 6 8
BIOSOLIDS APPLICATION RATES, Mg ha-1
SOIL FC, m
3 m
-3
C o m p os ted
30 % -C aO
NO3--N leaching-distance into soil profile [z(t)]
As NO3--N moves downward into the soil profile,
the risk of groundwater contamination is reduced by dilution, since more water is needed for
percolation and also because part of the NO3--N is
retained in a given soil layer. This effect was well demonstrated by Mitchell et al. (2000) who applied
approximately 20 dry Mg ha-1 of digested sewage
sludge to a forested Spodosol in Scotland to recover
10 kg ha-1 NO
3--N from the O1 horizon, but only
4 kg ha-1 from approximately 50 cm deeper.
Maximum surplus water under Melbourne
conditions over a year (Table 3) would leach NO3--N
64 cm deeper into the Spodosol’s 20 cm toplayer, and 15 cm deeper into the Oxisol profile according to Equation 2. Such short distances travelled in a year do not threaten deep groundwater on a short-term basis. Lysimeter studies also indicated that the
amount of NO3--N leaching from an Argissolo
(Ultisol) amended with sewage sludge at
30 dry Mg ha-1 would not significantly affect
groundwater (Barry et al., 1998).
Joshua et al. (1998) applied sewage sludge at 30–
120 dry Mg ha-1 to Australian pastures and
measured significant NO3--N movement in soils as
deep as 70 cm after one year. But, as concentrations
remained under 10 mg NO3--N kg-1 at such depth,
they concluded that a single application of sewage sludge to pastures did not pose risks of groundwater contamination.
For a different rainfall regime the contribution
from each factor (N0, R, FC) may change.
Accordingly, some countries manage NO3- leaching
risk from biosolids through rainfall. For instance, some European countries ban application of digested sludge between late summer and early winter to
reduce water pollution by NO3--N (Smith et al.,
1998). Shepherd (1996) stated that sludges applied early in the United Kingdom autumn presented a greater potential for N leaching because of the greater winter rainfall and drainage.
NO3- leaching is also sensitive to land management
practices, with the largest losses usually occurring under bare fallow conditions. The presence of a cover
crop may drastically reduce NO3- leachate since
much of the mineralised N is taken up by plants
(Edis, 1998; Shepherd, 1996). Values of NO3--N
expected to leach from 20 cm topsoils (Figure 2 and Table 5) would surely be lower for biosolids-treated soils under a cover crop. However, the relative leaching risks from the two selected soils amended with the five biosolids could be well illustrated here. The adopted approach could figure out the highest risk posed to groundwater by a single biosolids application. Such a risk can be considered low for the application rates used.
CONCLUSIONS
1. NO3--N expected to leach from biosolids
incubated in the clayey Oxisol depended exclusively on the amounts of nitrified N. Changes in the sandy Spodosol’s field capacity by some biosolids strongly
influenced amounts of NO3--N expected to leach from
this latter soil.
2. The application of solar-irradiated and fresh
biosolids at least doubled the risk posed by NO3--N to
groundwater compared to the application of
composted, 250 oC-dried and 30 %-CaO biosolids to
the Oxisol.
3. Composting and heat-drying could reduce the
NO3--N leaching risk of fresh sludge applications to
Spodosol to a third.
4. For similar amounts of NO3--N present in soils,
the risk of NO3--N leaching from Spodosol was
between 3 and 4 times higher than from the Oxisol. 5. Leaching was limited to 64 cm soil depth below
root zone and the risk of NO3--N groundwater
contamination caused by a single application of
biosolids at rates up to 8.0 dry Mg ha-1 can be
considered low for both soils.
Table 5. Leachate’s maximum NO3--N concentrations expected to leave the 20 cm amended-topsoils with
20.4 mm of drainage
T r eatm ent S p od os ol O x is ol
____________________________________________________ m g L-1 ____________________________________________________
Fresh sludge 75.5a 85.8f
Com pos ted bio solid s 28.4b 44.1g
30 % -CaO biosolid s 135.8c 29.9b
250 °C-dried bio solid s 35.3d 40.2g
So lar-irradia ted biosolid s 114.2e 83.3f
LITERATURE CITED
BARRY, G.A.; BLOESCH, P.; GARDNER, E.A.; RAYMENT, G.E. & HOGARTH, D.M. Re-use of sewage biosolids on canelands. In: CONFERENCE OF THE AUSTRALIAN SOCIETY OF SUGAR CANE TECHNOLOGISTS, 20., Ballina, 1998. Annals. New South Wales, Editorial Services, 1998. p.69-75.
BUREAU OF METEOROLOGY - BOM. Melbourne climate data base. Access under < http://www.bom.gov.au>. Access date: July 13, 1999.
CASSEL, D.K. & NIELSEN, D.R. Field capacity and available water capacity. In: KLUTE A., ed. Methods of soil analysis. Part 1: Physical Methods. Madison, American Society of Agronomy & Soil Science Society of America, 1986. p.901-926.
EDIS, R. Transfer function modelling of bromite and nitrate leaching through soil with and without plants. Melbourne, The University of Melbourne - ILFR, 1998. 277p. (Tese de Doutorado)
EMPRESA BRASILEIRA DE PESQUISA AGROPECUÁRIA -EMBRAPA. Centro Nacional de Pesquisa de Solos. Rio de Janeiro. Sistema brasileiro de classificação de solos. Brasília, Serviço de Produção de Informação - SPI, 1999. 412p.
EPSTEIN, E. The science of composting. Pennsylvania, Technomic Publishing Company, 1997. 335p.
FRANK, R. The use of biosolids from wastewater treatment plants in agriculture. Env. Manag., 9:165-169, 1998. HAERING, K.C.; DANIELS, W.L. & FEAGLEY, S.E. Reclaiming
mined lands with biosolids, manures, and papermill sludges. In: BARTELS, J., ed. Reclamation of drastically disturbed lands. Madison, American Society of Agronomy, Crop Service Society of America & Soil Science Society of America, 2000. p.615-644.
JOSHUA,W.D.; MICHALK, D.L.; CURTIS, I.H.; SALT, M. & OSBORNE, G.J. The potential for contamination of soil and surface waters from sewage sludge (biosolids) in a sheep grazing study, Australia. Georderma, 84:135-156, 1998. LAVERMAN, A.M.; ZOOMER, H.R.; VAN VERSEVELD, H.A.
& VERHOEF, H.A. Temporal and spatial variation of nitrogen transformations in a coniferous forest soil. Soil Biol. & Bioch., 32:1661-1670, 2000.
MAGESAN, G.N.; CLYDON, J.J. & HARRIS, S. Influence of municipal effluent application on soil physical and hydraulic properties. In: INTERNATIONAL CONFERENCE -CONTAMINANTS AND THE SOIL ENVIRONMENT, 1., Adelaide, 1996. Annals. Adelaide, Australian Soil Science Society, 1996. p.269-270.
MITCHELL, D.S.; EDWARDS, A.C. & FERRIER, R.C. Changes in fluxes of N and P in water draining a stand of Scots pine treated with sewage sludge. Forest Ecol. Manag., 139:203-213, 2000.
PASCUAL, J.A.; AYUSO, M.; GARCIA, C. & HERNÁNDEZ. Characterization of urban wastes according to fertility and phytotoxicity parameters. Waste Manag. Res., 15:103-112, 1997.
POLGASE, P.J. & ROBINSON, M.B. Sustainable use of biosolids in plantation forests. In: INTERNATIONAL CONFERENCE - CONTAMINANTS AND THE SOIL ENVIRONMENT, 1., Adelaide, 1996. Annals. Adelaide, Australian Soil Science Society, 1996. p.121-122. RAYMENT, G.E. & HIGGINSON, F.R. Australian laboratory
handbook of soil and water chemical methods. Melbourne, Inkata Press, 1992. 225p.
SHAFFER, M.J.; HALVORSON, A.D. & PIERCE, F.J. Nitrate leaching and economic analysis package (NLEAP): model description and application. In: FOLLETT, R.F., KEENEY, D.R. & CRUSE, R.M. eds. Managing nitrogen for groundwater quality and farm profitability. Madison, Soil Science Society of America, 1991. p.285-332.
SHARPLEY, A.N.; DANIEL, T.; SIMS, T.; LEMUNYON, J.; STEVENS R. & PARRY, R. Agriculture phosphorus and eutrophication. Washington, United States Department of Agriculture - Agriculture Research Service, 1999. 37p. SHEPHERD, M.A. Factors affecting nitrate leaching from
sewage sludges applied to sandy soil in arable agriculture. Agric., Ecosys. Environ., 58:171-185, 1996.
SMITH, S.R.; WOODS, V. & EVANS, T.D. Nitrate dynamics in biosolids-treated soils. I. influence of biosolids type and soil type. Biores. Technd., 66:139-149, 1998.
UNITED STATES ENVIRONMENTAL PROTECTION AGENCY - USEPA. A guide to the biosolids risk assessments for the EPA Part 503 rule. Washington, United States Environmental Protection Agency - Office of Wastewater Management, 1995. 143p.
WHITE, R.E. Principles and practices of soil science: the soil as a natural resource. 3.ed. Victoria, Blackwell Science, 1997. 348p.