BIOSOLIDS EFFECTIVENESS TO YIELD RYEGRASS
BASED ON THEIR NITROGEN CONTENT
Rodrigo Studart Corrêa1*; Robert E. White2; Anthony J. Weatherley2
1
UnB - Depto. de Engenharia Florestal, C.P. 10.814 - 70324-980 - Brasília, DF - Brasil. 2
The University of Melbourne - ILFR, Victoria 3010 - Australia. *Corresponding author <rodmanga@yahoo.com.br>
ABSTRACT: Biosolids have been reported to increase yields and supply plant nutrients. However, complying with health and environmental standards is necessary before applying biosolids to land. Thus, sludge stabilization is required to make biosolids safe enough for their agricultural use. Side effects of stabilization processes on agronomic features of sewage sludge are not quite known, although their understanding is essential for biosolids management. Based on a model equivalent to the Mitscherlich equation, effects of the most common processes for sludge stabilization were evaluated (composting, liming, heat-drying and solar irradiation) in relation to the agronomic effectiveness of biosolids to yield Lolium perenne L. on two tropical soils, with NH4H2PO4 as a reference. Sewage stabilization processes have affected the ability of biosolids to promote plant growth. Their effectiveness was usually higher than fertilizer in a Spodosol and lower in an Oxisol. Solar-irradiated sludge presented the highest effectiveness among the biosolids and reached peak yields at the lowest application rate independent on soil type. Biosolids could efficiently substitute fertilizers and even yield more plant dry matter than the NH4H2PO4 reference, depending on the biosolid and soil type.
Key words: Lolium perenne L., Mitscherlich, sewage sludge, biosolids, agronomic efficiency
EFICIÊNCIA DE BIOSSÓLIDOS NA PRODUÇÃO DE AZEVÉM
BASEADO NO CONTEÚDO DE NITROGÊNIO
RESUMO: Biossólidos têm sido citados como capazes de aumentar a produção de culturas e suprir nutrientes para plantas. Questões sanitárias e ambientais demandam que eles sejam estabilizados para que sejam usados na agricultura. Os efeitos dos processos de estabilização sobre as propriedades agronômicas de biossólidos não são completamente conhecidos, apesar de essenciais para o seu manejo. Baseado em um modelo equivalente à equação de Mitscherlich, este trabalho avaliou os efeitos dos processos mais comuns para a estabilização de lodos de esgotos (compostagem, caleação, secagem térmica e irradiação solar) sobre a eficiência agronômica de biossólidos na produção de Lolium perenne L. em um Esposossolo Carbico órtico arenoso e um Latossolo Vermelho perférrico argiloso, usando NH4H2PO4 como referência. Os processos de estabilização afetaram a eficiência agronômica do lodo de esgoto, sendo freqüentemente mais alta que o tratamento com NH4H2PO4 em um solo arenoso, e mais baixa que a referência em um solo argiloso. O lodo irradiado por sol mostrou a mais alta eficiência agronômica entre os biossólidos testados nos dois solos, e o azevém alcançou a produção de pico com a menor dose de aplicação. Os biossólidos puderam substituir fertilizantes e produzir mais matéria seca que o NH4H2PO4, a depender do tipo de biossólido e do solo.
Palavras-chave:Lolium perenne L., Mitscherlich, lodo de esgoto, biossólidos, eficiência agronômica
INTRODUCTION
The idea of applying organic matter, primarily containing nitrogen (N) and phosphorus (P), back into the natural cycle forms the basis of using sludge on land (Frank, 1998). There is actually a wide spectrum of sew-age products now internationally referred as biosolids that have been reported to improve soil physical and chemi-cal conditions and increase plant yield (Cameron et al., 1996). However, complying with health and environmen-tal regulations is a pre-condition for the use of sewage products on land.
pro-tection, land application rates of biosolids are currently based on matching biosolids-N with crop N-needs, namely N-agronomic rate (USEPA, 1995).
Policies worldwide will require in the next years a more intensive management of biosolids in order to avoid deleterious impacts of N and P on the environ-ment. However, few studies have attempted to determine the relationship between sludge treatment process and biosolid ability to promote plant growth (Maguire et al., 2000). Such an evaluation is necessary for a better man-agement of sewage products in soils. For that reason, this study aimed to evaluate the five most common biosolids (freshly digested sludge, composted sludge, limed sludge, heat-dried sludge, and solar-irradiated sludge) on their effectiveness to yield plant dry biom-ass on two contrasting soils based upon biosolid-N ag-ronomic rates.
MATERIAL AND METHODS
Sludge stabilization
A 500 kg sample of tertiary biological domes-tic sewage sludge was collected from a wastewater treat-ment plant at Bendigo shire, Victoria - Australia, and analyzed in triplicate for gravimetric water content
(105o
C for 48 hours), bulk density (BD) (Rayment & Higginson, 1992), total carbon (total-C), total nitrogen (total-N), mineral nitrogen (mineral-N), total phospho-rus (total-P), and available phosphophospho-rus (available-P), as described below. The fresh sewage sludge (Table 1)
pre-senting 878 g kg-1
water content, BD = 1.2 t m-3
, and C/ N ratio = 6.2 was mixed with hardwood sawdust (96 g
kg-1 moisture, BD = 0.3 t m-3, and C/N ratio = 668) and
woodchips (bulk agent) to achieve a C/N ratio = 25:1. Three 450 L composting piles were pitched on a
shel-tered cement pavement, run at 35o
C - 65o
C for 34 days, let to mature for another 60 days and sieved (2 mm). Lime treatment used CaO at 30% rate to sludge dry
sol-ids (weight/weight). Heat drying was performed in a
fur-nace at 250o
C until constant weight. The heat-dried sludge was ground and passed through a 2 mm sieve. For the solar irradiation process, three 10 kg fresh sludge samples were stored in freely drained plastic bowls un-der transparent plastic-covers and sunny conditions for 14 days during Melbourne’s summer, with daily
tem-peratures ranging from 12.8oC to 26.5oC. The
stabiliza-tion criteria established in USEPA (1995) were achieved in all the employed processes. All stabilized biosolids were analyzed in triplicate for total-C, total-N, mineral-N, total-P and available-P using the same analytical methods for the fresh sewage sludge, as described be-low. Results are shown in Table 1. Analysis of variance
and Tukey test were performed in Systat®
for Windows 2nd edition.
Soils
A Spodosol and an Oxisol were selected to be amended with the biosolids. Spodosols soils are domi-nated by aluminum, very permeable, and the agricultural use is limited by their extremely low fertility and poor water retention (Isbell, 1996). Oxisols soils are high in free iron and clay contents, well drained and easily com-pacted by poor agricultural practices (Isbell, 1996). Both soils were stripped of their 10 cm top layer before being collected. The aim was to simulate barren land situations, namely low organic matter and nutrient contents. Such conditions can better isolate the effects of biosolids from any other organic matter previously present in the soils. A 200 kg sample of each soil was collected from nearby Melbourne, allowed to air dry for two weeks, and passed through a 4 mm sieve. Blank-soil samples were analyzed in triplicate for bulk density, total porosity (Rayment & Higginson, 1992) and field capacity (Cassel & Nielsen, 1986). Analytical methods for the soils were the same as for biosolids, as described below. Main soil properties are shown in Table 2.
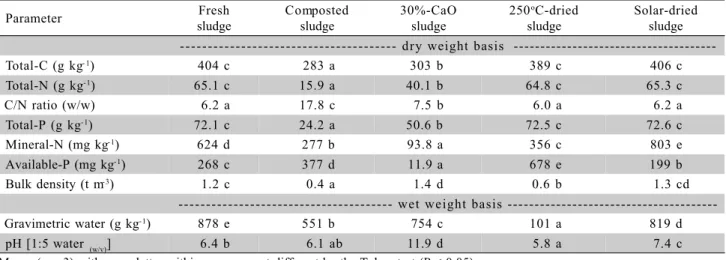
Table 1 - Some agronomic characteristics of stabilized biosolids.
Means (n = 3) with same letter within rows are not different by the Tukey test (P < 0.05)
Parameter Fresh
sludge
Composted sludge
30%-CaO sludge
250oC-dried sludge
Solar-dried sludge - - - d r y weight basis
---Total-C (g kg- 1) 404 c 283 a 303 b 389 c 406 c
Total-N (g kg-1) 65.1 c 15.9 a 40.1 b 64.8 c 65.3 c
C/N ratio (w/w) 6.2 a 17.8 c 7.5 b 6.0 a 6.2 a
Total-P (g kg-1) 72.1 c 24.2 a 50.6 b 72.5 c 72.6 c
Mineral-N (mg kg-1) 624 d 277 b 93.8 a 356 c 803 e
Available-P (mg kg-1) 268 c 377 d 11.9 a 678 e 199 b
Bulk density (t m-3) 1.2 c 0.4 a 1.4 d 0.6 b 1.3 cd
wet weight basis
---Gravimetric water (g kg-1) 878 e 551 b 754 c 101 a 819 d
Analytical methods
A Carbo-Erba NA 1500 analyzer was used to mea-sure total-C and total-N by the dry combustion method.
Soils and biosolids were oven dried at 70oC and ground to
powder. Samples weighing between 5 and 10 mg were placed in tin sample cups and introduced into a quartz re-actor. The combustion of organic matter inside the reactor
releases CO2, N-oxides and H2O, which are swept by the
helium carrier gas through chromium dioxide (CrO2) to
catalyze oxidation of organic fragments and Co3O4 coated
with Ag to remove halogens and sulfur oxides. The gases
then flow through a heated Cu (650o
C) column to reduce
the N oxides to N2 and to remove excess oxygen and
Mg(ClO4)2 and also to remove H2O, and into a
chromato-graphic column for separation of N2 and CO2. The two
gases are detected with a thermal conductivity detector, peaks are generated and their areas are calculated for the measurement of total-C and total-N concentrations.
Mineral-N was analyzed by Kjeldahl steam
dis-tillation for ammonium-N (NH4+
-N) and nitrate-N (NO3
--N) (Rayment & Higginson, 1992). Mineral-N was ex-tracted from biosolids and air-dried soils with KCl (2 mol L-1
) at a ratio 1:10 mass of material/volume of solution, shaking for one hour. Extracts were immediately filtered through Whatman 42 paper filters and analyzed on the
same day. MgO was used to convert NH4+-N to NH3-N.
Subsequently finely ground Devarda’s alloy was
em-ployed for reduction of NO3
--N and NO2
--N to NH4+
-N
and subsequently to NH3-N. The NH3-N formed was
steam distilled into a 2% boric acid solution (H3BO3). The
amount of 50 mL recovered solution was titrated with
H2SO4 (0.05 mol L-1
) to pH 5.0 employing an automatic
titrator. Finally, the concentrations of NH4+
-N + NO3
--N (mineral-N) were calculated for each sample.
The analysis of total-P was based on the HNO3
+ H2SO4 digestion of approximately 100 mg of powdered
oven-dried materials (biosolids and soils). The acid diges-tions were followed by color development based on the re-action of soluble P with molybdate-vanadate and analyzed at 420 nm wavelength (Rayment & Higginson, 1992).
For the analysis of available-P, biosolids and air-dried soil samples of 2.0 g were shaken for 60 s with 14.0
mL of Bray 1-P extraction solution [NH4F (0.03 mol L-1)
in HCl (0.025 mol L-1
)] and immediately filtered through Whatman 42 paper filters. The filtered extracts were mixed with color reagent (ammonium-molybdate sulfu-ric acid-Sb ascorbic acid solution) and analyzed for ab-sorbance at 882 nm (Rayment & Higginson, 1992).
Biosolid and air-dried soil pH was measured weighing 5.0 g samples and mechanically shaking them for one hour with 25.0 mL double distilled water (MilliQ water). Vials were allowed to rest for 20-30 min and ana-lyzed with a pH meter (Rayment & Higginson, 1992).
Pot experiment
A pot experiment was chosen for the plant test as an experiment on this scale is less costly, more rapid and allows more conditions to be controlled (Weatherley et al., 1988). Thus, soil samples of 1.8 kg (2 L) for the Oxisol and 3.2 kg (2 L) for the Spodosol were amended at biosolid rates shown in Table 3. Biosolid application rates consid-ered a 20 cm soil layer and respective soil bulk densities (Table 2). Soils treated with biosolids were placed in 2 L pots, wetted with distilled water to their pot capacity
(Cassel & Nielsen, 1986) and incubated for a week at 25o
C glasshouse environment before sowing. A non-fertilized control soil and soil samples containing chemical fertiliz-ers were placed among the pots containing biosolids-amended soils, and they were treated alike (Table 3).
Mono-ammonium phosphate - MAP (NH4H2PO4) was
em-ployed as chemical source of N and P to be used as the reference for the calculation of biosolid effectiveness. Fer-tilizer application rates aimed to cover the whole N and P ranges applied as biosolids (Table 3), since a complete re-sponse curve is necessary for an appropriate comparison among the effectiveness of nutrient sources (Palmer & Gilkes, 1983). Soils applied with MAP also received a basal
application of 78 mg kg-1 of K and 58 mg kg-1of Mg. A
commercial formulation containing 120 g kg-1
of FeSO4,
25 g kg-1
of MnSO4, 10 g kg-1
of ZnSO4, 5 g kg-1
of CuSO4,
1 g kg-1
of Na2BO3, and 1 g kg-1
of Na2MoO4was also
ap-plied at the of 1 g kg-1
of soil rate (Smith, 1986). Fertilizer application (Table 3) also considered a 20 cm soil layer and respective soils’ bulk densities (Table 2).
Plant test
Pots were sown with 10 seeds of Lolium perenne
L. - ryegrass - at 0.5 cm depth and 10-20 mL of distilled water were applied daily to meet plant requirements. All pots were randomized weekly. Two weeks after sowing, pots were thinned to five plants per pot, leaving the most
Property Spodosol Oxisol
Total-C (g kg- 1) 6.1 ± < 0.1 13.0 ± < 0.1
Total-N (g kg-1) 0.38 ± 0.03 1.6 ± 0.11
Mineral-N (mg kg-1) 0.1 ± 0.01 5.0 ± 0.08 Total-P (g kg-1) 0.15 ± 0.01 0.40 ± 0.02
Available-P (mg kg-1) 4.5 ± 0.1 14.6 ± 0.5
pH [1:5 water (w/v)] 4.9 ± 0.1 5.0 ± 0.1
Bulk Density (t m-3) 1.6 ± 0.1 0.9 ± 0.1 Clay (g kg- 1) 48 ± 3 499 ± 38
Silt (g kg- 1) 37 ± 1 145 ± 9
Sand (g kg-1) 915 ± 21 356 ± 19 Porosity (m3 m- 3) 0.41 ± 0.01 0.67 ± 0.08
Field capacity (m3 m-3) 0.07 ± 0.02 0.31 ± 0.02 Table 2 - Some properties of the two selected soils (means ±
uniform plants. Pots were harvested eight weeks after
thinning, plant materials were oven-dried (70oC for 72 h),
and yields were calculated on dry matter basis.
Data analysis
Yields were plotted against N-agronomic rates applied to soils and fitted by a modified Newton method of maximizing the likelihood to the following power
func-tion, using GenStat®
for Windows 5th
edition:
Y = A - BRX
, R positive and < 1 [Equation 1]
where Y is the yield (g dry matter/pot), X is the amount
of N applied (mg kg-1
soil), R is the model slope, A is the maximum yield and B is the yield response to the N-agronomic rates applied either as biosolid or as MAP-fer-tilizer. A curvature factor (C) was derived from -ln R for the calculation of the effectiveness of each product and the relative effectiveness of each biosolid compared with MAP-fertilizer, and based upon yield and N-agronomic rate. Equation 1 is equivalent to the Mitscherlich
equa-tion (Y = A - B-CX
) and as the value of C increases, less N from a source is required to produce the same plant yield or less N is required to reach the maximum yield (Bolland, 1997).
The effectiveness of each material to yield dry matter was calculated by the product of B and C (BC), since:
if Y = A - BRXÆ dy/dx = - BRX lnR = BRXC
when x = 0, RX
= 1 Æ dy/dx = BC
The ratio between BC for each biosolid and BC
for MAP-fertilizer (B1C1/B2C2) gives the relative
effec-tiveness (RE) of each biosolid against MAP-fertilizer (Bolan et al., 1990; Weatherley et al., 1988). When RE = 1, treatments or products are of equal effectiveness; when RE < 1 or RE > 1, a given treatment or product is respectively less or more effective than the reference. N-agronomic rates at yield peaks were extracted from the inflection point of each curve, from which yield responses started to flatten. Values for N-agronomic rates were con-verted to biosolids dry and wet weights as to volumetric basis as well.
Standard errors values for B and R (SEBand SER
respectively) were derived from the parameter estimates
given in the GenStat®. Standard errors for BC (SEBC) were
derived from the equation below (Beers, 1957):
SEBC = (SER2+ SEB2)0.5 [Equation 2]
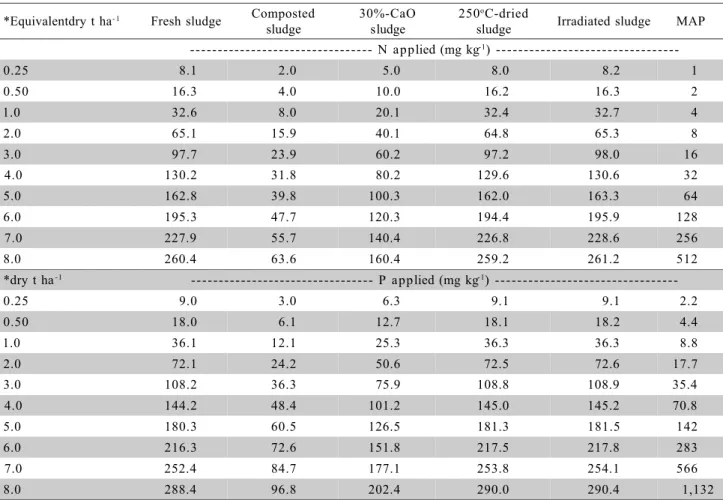
Table 3 - Total-N and total-P applied to air-dry soils, based on their contents in the biosolids.
*Equivalentdry t ha- 1 Fresh sludge Composted sludge
30%-CaO sludge
250oC-dried
sludge Irradiated sludge MAP --- N applied (mg kg-1)
-0.25 8.1 2.0 5.0 8.0 8.2 1
0.50 16.3 4.0 10.0 16.2 16.3 2
1.0 32.6 8.0 20.1 32.4 32.7 4
2.0 65.1 15.9 40.1 64.8 65.3 8
3.0 97.7 23.9 60.2 97.2 98.0 16
4.0 130.2 31.8 80.2 129.6 130.6 32
5.0 162.8 39.8 100.3 162.0 163.3 64
6.0 195.3 47.7 120.3 194.4 195.9 128
7.0 227.9 55.7 140.4 226.8 228.6 256
8.0 260.4 63.6 160.4 259.2 261.2 512
*dry t ha-1 --- P applied (mg kg-1)
-0.25 9.0 3.0 6.3 9.1 9.1 2.2
0.50 18.0 6.1 12.7 18.1 18.2 4.4
1.0 36.1 12.1 25.3 36.3 36.3 8.8
2.0 72.1 24.2 50.6 72.5 72.6 17.7
3.0 108.2 36.3 75.9 108.8 108.9 35.4
4.0 144.2 48.4 101.2 145.0 145.2 70.8
5.0 180.3 60.5 126.5 181.3 181.5 142
6.0 216.3 72.6 151.8 217.5 217.8 283
7.0 252.4 84.7 177.1 253.8 254.1 566
8.0 288.4 96.8 202.4 290.0 290.4 1,132
RESULTS AND DISCUSSION
Ryegrass yield on Spodosol soil
The sewage stabilization processes (composting, liming, heat-drying and solar-irradiation) have affected the fresh sewage sludge ability of promoting plant growth. Relative effectiveness (RE) greater than 1 indicates that biosolids worked more effectively to produce ryegrass dry matter on the Spodosol than the fertilizer used as refer-ence. This applies to fresh, 30%-CaO and
solar–irradi-ated sludge, but not to the 250o
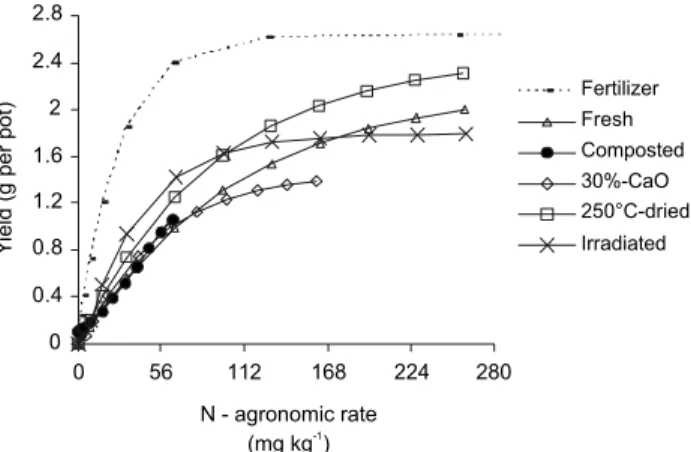
C-dried pellets, which RE refrained to 63% of MAP-fertilizer effectiveness (Table 4). Heat-drying process sterilizes fresh sludge for all kinds of organisms and the low mineralization rate may be the cause of poor performance of dried-pellets in the sandy Spodosol. But regardless to the RE of each product, plants responded positively to all biosolids applied to both soils and reached yield plateaus for all treatments on the Spodosol (Figure 1).
Osborne, (1996), Süss, (1997) and Fresquez et al., (1990) found sewage sludge being more effective for plant growth than fertilizers. On mining spoils, sewage sludge also out-performed the standard rehabilitation technique based on chemical fertilization (Phillips, 1994). However, there is virtually no difference in terms of plant dry mat-ter yield if different sources of nutrients are applied at same available elemental rate (McKenzie, 1999). Hence, it is not reasonable that, nutrients from biosolids can yield more biomass and be more efficiently used by plants (Table 4) than readily available nutrients from inorganic fertilizers.
In spite of it, plots amended with 10 dry t ha-1 of fresh
sludge were reported to produce 27% more dry matter than plots chemically fertilized (Gonçalves et al., 2000).
Land application of organic wastes has other ef-fects than only the releasing of plant nutrients to soils. Biosolids can increase soil aggregate stability and it is fre-quently reported for sandy soils, like the Spodosol (Cameron et al., 1996). Factors, as such as organic matter content have influenced yields in terms of improved soil physical conditions in biosolids-amended soils (Villar et al., 1998). A better soil physical condition in sewage sludge-amended soils has been frequently mentioned as the cause of a higher plant dry matter production as compared to soils chemically fertilized (Gavi et al., 1997; Osborne, 1996).
Composted sludge for instance was here applied at one-ninth of the amount of N applied as fertilizer (Table 3), but it was as effective and peaked at a similar level as MAP-fertilizer (Table 4). On the other hand, the
250oC-dried sludge, which contains three times more P
and four times more N than the composted sludge, showed a poorer performance on effectiveness (RE =
Treatment
Variable A (Maximum yield)
Variable B (Yield response)
Factor R (Slope)
Factor C (Curvature)
BC (Effectiveness)
RE
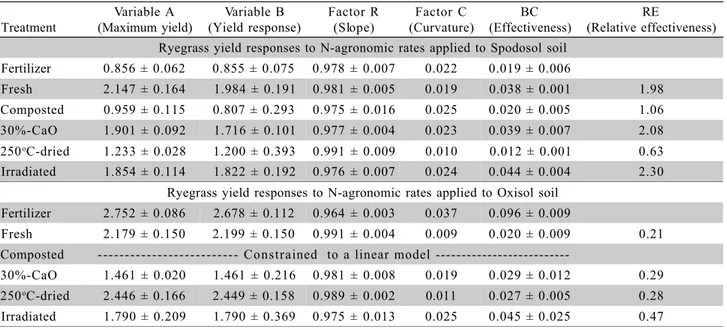
(Relative effectiveness) Ryegrass yield responses to N-agronomic rates applied to Spodosol soil
Fertilizer 0.856 ± 0.062 0.855 ± 0.075 0.978 ± 0.007 0.022 0.019 ± 0.006
Fresh 2.147 ± 0.164 1.984 ± 0.191 0.981 ± 0.005 0.019 0.038 ± 0.001 1.98 Composted 0.959 ± 0.115 0.807 ± 0.293 0.975 ± 0.016 0.025 0.020 ± 0.005 1.06
30%-CaO 1.901 ± 0.092 1.716 ± 0.101 0.977 ± 0.004 0.023 0.039 ± 0.007 2.08
250oC-dried 1.233 ± 0.028 1.200 ± 0.393 0.991 ± 0.009 0.010 0.012 ± 0.001 0.63 Irradiated 1.854 ± 0.114 1.822 ± 0.192 0.976 ± 0.007 0.024 0.044 ± 0.004 2.30
Ryegrass yield responses to N-agronomic rates applied to Oxisol soil
Fertilizer 2.752 ± 0.086 2.678 ± 0.112 0.964 ± 0.003 0.037 0.096 ± 0.009
Fresh 2.179 ± 0.150 2.199 ± 0.150 0.991 ± 0.004 0.009 0.020 ± 0.009 0.21 Composted Constrained to a linear model
---30%-CaO 1.461 ± 0.020 1.461 ± 0.216 0.981 ± 0.008 0.019 0.029 ± 0.012 0.29
250oC-dried 2.446 ± 0.166 2.449 ± 0.158 0.989 ± 0.002 0.011 0.027 ± 0.005 0.28 Irradiated 1.790 ± 0.209 1.790 ± 0.369 0.975 ± 0.013 0.025 0.045 ± 0.025 0.47
Table 4 - Coefficients for ryegrass yield responses to the treatments fitted to an asymptotic regression model (values ± standard errors).
Figure 1 - Ryegrass yields in response to biosolid-N application rates and to MAP -fertilizer in the Spodosol.
0 0.4 0.8 1.2 1.6 2 2.4 2.8
0 56 112 168 224 280
N - agronomic rate (mg kg )-1
Fertilizer Fresh Composted 30%-CaO 250°C-dried Irradiated
Y
ie
ld(
gp
e
r
p
o
0.63) than both composted sludge and MAP-fertilizer (Table 4). Thus, relative effectiveness values (RE) of biosolids in the Spodosol can not entirely be a result of their N contents, mainly because biosolid mineralization rates in Spodosol are very low (Corrêa, 2001).
Fresh, 30%-CaO, and solar-irradiated sludges were the most effective biosolids to yield ryegrass on the Spodosol. They were from twice to 2.3 times more ef-fective than the MAP-reference. Maximum yields of ryegrass grown on Spodosol treated with these three biosolids peaked on levels far higher than the other two biosolids and the fertilizer-control (Table 4, Figure 1). Sewage sludge stabilization affects both the nutrient con-tent and the mineralization rates of biosolids (Corrêa, 2001) and biosolids with higher potential of putrescibility (fresh, 30%-CaO and solar-irradiated sludge) presented higher RE values in the sandy Spodosol (Table 4).
Ryegrass yield on Oxisol
Unlike Spodosol, the full potential for plant growth and the highest effectiveness for nutrient use by plants on Oxisol were achieved with the use of MAP-fertilizer (Table
4, Figure 2). Although the 250oC-dried pellets were far less
effective than MAP-fertilizer, they produced similar maxi-mum ryegrass yields (Table 4).
Yields from MAP-treated Oxisol were always higher than from soil samples amended with biosolids at similar N application rates (Figure 2). Available nutrients from biosolids probably worked as limiting factors in the highly productive Oxisol. Ryegrass yield responses to MAP-fertilizer suggest higher biosolids application rates could increase biomass production, as more nutrients would be promptly available for the plants (Table 1). Slowly soluble sources of nutrients may be too low for optimum plant growth and a lower asymptote is then reached (Barrow & Bolland, 1990). Although not tested here, the combination of chemical fertilizers with biosolids may be a better option for the Oxisol, since some studies have shown this to be a reasonable practice for biosolid management (Klasink, 1998). The use of
wastes combined with nutrients from fertilizers to meet crop requirements is taken as the best waste management, because it is economically feasible and environmentally acceptable (Sikora & Enkiri, 1999).
Nutrient limitations were even more evident in Oxisol samples treated with composted sludge. Yields did not reach the asymptotic part of the curve (Figure 2) and
the response remained linear up to 8.0 dry t ha-1
applica-tion rate. The 30%-CaO and the 250o
C-dried sludge per-formed in the Oxisol at approximately one-third the effi-ciency of MAP-fertilizer. Fresh sludge RE was even lower than that and reached only one-fifth the MAP-fertilizer efficiency (Table 4).
Solar-irradiated sludge achieved also in the Oxisol the highest value of RE (Table 4). Ryegrass grown with solar-irradiated sludge reached yield peak at the low-est application rate (Table 5) on both soils, although fresh sludge reached higher maximum yields (Table 4). The in-crease of mineral-N through mineralization (Table 1) be-fore planting seemed an efficient way to make solar-ir-radiated sludge the most effective biosolid to promote plant growth. Mineral-N promptly available in biosolids influences dry matter production and N concentrations in plant tissue for short-term crops (Corrêa, 2001). Fresh sludge and limed sludge have been incorporated into soils at least six weeks before sowing to allow the products to react with soil and to release nutrients (Bamforth, 1996). Biosolid soil application and mineralization after-wards increase concentrations of various nutrients in soils, particularly N, P, Ca, S and Zn. Excess of P delivered to soils is an inherent consequence of biosolid N-agronomic rates (Table 1 and 3), a fact that is not observed for the other nutrients in short-term trials (Barbarick & Ippolito, 2000). Biosolids have similar N and P concentrations (Table 1) but plants need from 7 to 15 times less P than N, which leads to a surplus of P stocked in the soils (Barbarick & Ippolito, 2000). However, no toxic effect on plants could be observed in this work as a result of P be-ing applied in excess via biosolids or MAP-fertilizer.
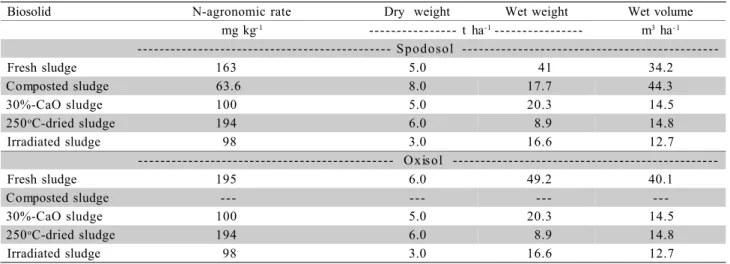
Soil characteristics and the degree of biosolid sta-bilization mostly determine the effectiveness of N use by plants (Corrêa, 2001). Ryegrass yields peaked at various biosolids N-agronomic rates (Figure 1 and 2, Table 5) and it is likely a result of biosolid different contents of plant nutrients and mineralization rates (Barrow & Bolland, 1990). Higher mineral-N concentration in solar-irradiated sludge (Table 1) was an agronomic advantage, since 3 dry t ha-1
equaled to 5 dry t ha-1
of fresh sludge applied to
Spodosol and 6 dry t ha-1 applied to Oxisol at yield peaks
(Table 5). Except for composted sludge in the Oxisol,
maximum yields were achieved at 3 - 8 dry t ha-1
biosolid application rates (Table 5). Recommendations have been advocating application rates of biosolids lower than 10
dry t ha-1 based on yield peaks of various crops and trees
(Gonçalves et al., 2000; Villar et al., 1998).
Figure 2 - Ryegrass yields in response to biosolid-N application rates and to MAP - fertilizer for the Oxisol.
0 0.4 0.8 1.2 1.6 2 2.4 2.8
0 56 112 168 224 280
Fertilizer Fresh Composted 30%-CaO 250°C-dried Irradiated
Y
ie
ld
(g
per
pot
)
ACKNOWLEDGMENTS
To CNPq, SEMARH/DF, Coliban Water Treat-ment Works and Burnley College.
REFERENCES
BAMFORTH, I. The growth and yield response of a range of summer crops to biosolids products. Sydney: NSW Agriculture Organic Waste Recycling Unit and Sydney Water, 1996. 123p.
BARBARICK, K.A.; IPPOLITO, J.A. Nitrogen fertiliser equivalency of sewage biosolids applied to dryland winter wheat. Journal of Environmental Quality, v.29, p.1345-1351, 2000.
BARROW, N.J.; BOLLAND, M.D.A. A comparison of methods for measuring the effect of level of application on the relative effectiveness of two fertilizers. Fertilizer Research, v.26, p.1-10, 1990.
BEERS, Y.Introduction to theory of error. Oxford: Addison-Wesley Publication, 1957. 66p.
BOLAN, N.S.; WHITE, R.E.; HEDLEY, M.J. A review of the use of phosphate rocks as fertilizers for direct application in Australia and New Zealand.
Australian Journal of Experimental Agriculture, v.30, p.297-313, 1990.
BOLLAND, M.D.A. Comparative phosphorus requirements of five annual medics.Journal of Plant Nutrition, v.20, p.1029-1043, 1997. CAMERON, K.C.; DI, H.J.; MCLAREN, R.G. Is the soil an appropriate
dumping ground for our wastes? In: AUSTRALIAN AND NEW ZEALAND NATIONAL SOILS CONFERENCE, Melbourne, 1996.
Proceedings. Melbourne: University of Melbourne, 1996. p.31-53. CASSEL, D.K.; NIELSEN, D.R. Field capacity and available water capacity.
In: KLUTE, A. (Ed.) Methods of soil analysis. Madison: ASA, 1986. p.901-926.
CORRÊA, R.S. Beneficial use of biosolids based on their N and P fertilizing value. Melbourne: The University of Melbourne, 2001. 305p. (Thesis -Ph.D.).
FRANK, R. The use of biosolids from wastewater treatment plants in agriculture.Environmental Management, v.9, p.165-169, 1998. FRESQUEZ, P.R.; FRANCIS, R.E.; DENNIS, G.L. Sewage sludge effects
on soil and plant quality in a degraded, semiarid grassland. Journal of Environmental Quality, v.19, p.324-329, 1990.
GAVI, F.; RAUN, W.R.; BASTA, N.T.; JOHNSON, G.V. Effect of sewage sludge and ammonium nitrate on wheat yield and soil profile - inorganic nitrogen accumulation. Journal of Plant Nutrition, v.20, p.203-218, 1997. GONÇALVES, J.L.M.; VAZ, L.M.S.; POGGIANI, F. Aplicabilidade de biossólido em plantações florestais: II. Efeito na fetilidade do solo, nutriçao e crescimento de árvores. In: BETTIOL, W. (Ed.) Impacto ambiental do uso agrícola do lodo de esgoto. Jaguariúma: Embrapa Meio Ambiente, 2000. p.179-195.
Table 5 - Biosolid application rates at yield peaks for Spodosol and Oxisol.
Biosolid N-agronomic rate Dry weight Wet weight Wet volume
mg kg-1 --- t ha-1- - - - m3 ha- 1 Spodoso l
-Fresh sludge 163 5.0 41 34.2
Composted sludge 63.6 8.0 17.7 44.3
30%-CaO sludge 100 5.0 20.3 14.5
250oC-dried sludge 194 6.0 8.9 14.8
Irradiated sludge 98 3.0 16.6 12.7
- - - O x is ol
---Fresh sludge 195 6.0 49.2 40.1
Composted sludge - - - - - -
-30%-CaO sludge 100 5.0 20.3 14.5
250oC-dried sludge 194 6.0 8.9 14.8
Irradiated sludge 98 3.0 16.6 12.7
Received January 19, 2004 Accepted February 25, 2005
ISBELL, R.F. The Australian soil classification. Australian soil and landsurvey handbook. Melbourne: CSIRO, 1996. 143p.
KLASINK, A. Compost agriculture, results of field experiments. In: INTERNATIONAL COMPOSTING CONFERENCE, Oldenburg, 1998.
Proceedings.Oldenburg: Institute for Agricultural Analysis and Research, 1998. p.1-8.
MAGUIRE, R.O.; SIMS, J.T.; COALE, F.J. Phosphorus solubility in biosolids-amended farm soils in the Mid-Atlantic Region of the USA.
Journal of Environmental Quality, v.29, p.1225-1233, 2000. MCKENZIE, F. Using nitrogen confidently. Victoria: Department of
Natural Resources and Environment, 1999. p.1-7: Getting the most out of nitrogen on grazed pastures.
NAVAS, A.; MACHIN, J.; NAVAS, B. Use of biosolids to restore the natural vegetation cover on degraded soils in the badlands of Zaragoza (NE Spain).Bioresource Technology, v.69, p.199-205, 1999.
OSBORNE, G.J. Fertilizer value of biosolids - a review. Sydney: NSW Agriculture Organic Waste Recycling Unit and Sydney Water, 1996. 32p.
PALMER, B.; GILKES, R.J. The influence of application rate on the relative effectiveness of calcined Christmas Island C-grade rock phosphate and super-phosphate when applied as mixtures.Fertilizer Research, v.4, p.45-50, 1983.
PHILLIPS, C.P.Utilization of sewage sludge for minesite rehabilitation:
Rix’s Creek Mine Trial. 76. Newcastle: Urban Water Research Association of Australia; University of Newcastle, 1994. 51p. RAYMENT, G.E.; HIGGINSON, F.R. Australian laboratory handbook
of soil and water chemical methods. Sydney: Inkata Press, 1992. 248p. SIKORA, L.J.; ENKIRI, N.K. Growth of tall fescue in compost/fertilizer blends.Soil Science Society of America Journal, v.164, p.62-69, 1999. SMITH, F.W. Pasture species. In: REUTER, J.B. (Ed.) Plant analysis: an
international manual. Melbourne: Inkata Press, 1986. p.100-119. SÜSS, A. Use of sewage sludge as a fertilizer for increasing soil fertility and
crop production. In: CHALK, B. (Ed.) Sewage sludge and wastewater for use in agriculture. Vienna: IAEA-UN, 1997. p.129-137.
UNITED STATES ENVIRONMENTAL PROTECTION AGENCY. A guide to the biosolids risk assessments for the EPA Part 503 rule. Washington: USEPA. Office of Wastewater Management, 1995. 195p. (EPA/832-B-93-005).
VILLAR, M.C.; GONZÀLEZ-PRIETO, S.J.; CARBALLAS, T. Evaluation of three organic wastes for reclaiming burnt soils: improvement in the recovery of vegetation cover and soil fertility in pot experiments. Biology and Fertility of Soils, v.26, p.122-129, 1998.