ANALYZING THE ASSOCIATION BETWEEN SAFETY
CLIMATE AND SAFETY OUTCOMES IN A BULGARIAN
COMPANY
Ivelina Ruseva Nikolaeva
Project submitted as partial requirement for the conferral of Master in Human Resource Management
Supervisor:
Dr. Jose Maria Leon Perez, ISCTE Business School, Department of Organizational Behavior and Human Resources
A
N
A
L
Y
Z
IN
G
T
H
E
A
SS
O
CI
A
T
IO
N
BE
T
W
E
E
N
SAFET
Y
C
L
IMA
T
E
A
N
D
SA
FE
T
Y
O
U
T
C
O
M
E
S IN A
B
U
L
G
A
RI
A
N
C
O
M
PA
N
Y
Iv
el
in
a R
us
ev
a Nikol
ae
va
Antóni
o
Au
gus
to
d
a S
ilva
(p u t you r fu ll n am e )I
Contents
Summary ... II Resumo ... III Executive Summary ... IV
1. Context of the issue and theoretical framework ... 1
The model of organizational climate and occupational accidents ... 2
2. Literature Review ... 5 Company profile ... 10 3. Study methodology ... 15 3.1. Procedure ... 15 3.2. Sample ... 15 3.3. Instruments ... 17
3.4. Data analysis strategy ... 19
4. Results ... 22
4.1. Reliability ... 22
4.2. Correlation ... 22
4.3. Multiple regressions ... 25
4.4. Complementary analysis: The NOSACQ-50 ... 34
5. Proposal ... 38 5.1. Forms of implementation... 40 5.1.1. Workers participation ... 40 5.1.2. Safety training ... 40 5.1.3. Hiring practices ... 41 5.1.4. Reward ... 41 5.1.5. Management commitment ... 41
5.1.6. Communication and feedback ... 42
6. Conclusions ... 45
Bibliography ... 48
Appendices ... 50
II
Summary
In recent years the interests about how safety climate influences the safety-related outcomes have increased significantly. Reason for that is the increasing importance of people and their significance as a part of the process. Achieving positive safety-related outcomes is crucial and in this sense, one of the main organizational aims is to provide a healthy work environment to all employees. In this project, questionnaires are presented, NOSACQ-50 (Nordic Occupational Safety Climate Questionnaire), Affective Commitment, Job Satisfaction, GHQ-12 (General Health Questionnaire), Subjective Productivity, and Intention to Leave, to characterize the main indicators (safety climate, psychological well-being, organizational commitment, job satisfaction and safety performance). The results of this cross-sectional research will be an integral part of understanding how safety climate influences the occupational accidents by following the model, which link them trough a number of pathways. Deriving from the results of this research will offer evidence about the role of safety climate on safety-related outcomes, which can be use for guiding future interventions aimed at improving the safety in this specific organization.
Keywords: Safety climate; Safety-related outcomes; Questionnaire research;
III
Resumo
Nos últimos anos aumentou significativamente o interesse acerca de como o clima de segurança no trabalho influencia os resultados relacionados com a segurança (e.g., acidentes de trabalho, desempenho). Isto deve-se à crescente importância das pessoas e da sua relevância como parte do processo. Conseguir resultados positivos relacionados com a segurança é crucial e, neste sentido, uma das maiores preocupações organizacionais é facultar um saudável ambiente de trabalho a todos os empregados. Neste projeto, utilizam-se questionários – NOSACQ-50 (Nordic Occupational Safety Climate Questionnaire), Affective
Commitment, Job Satisfaction, GHQ-12 (General Health Questionnaire), Subjective Productivity e Intention to Leave – para caracterizar os principais indicadores (clima de
segurança, bem estar psicológico, motivação organizacional, satisfação profissional e desempenho de segurança). O resultado desta pesquisa será parte integrante da compreensão de como o clima de segurança influencia os acidentes de trabalho, seguindo o modelo que o liga através de numerosos percursos. Do resultado desta pesquisa decorre a evidência do papel do clima de segurança nos resultados relacionados com a segurança, o que poderá ser utilizado para orientação de futuras intervenções motivadas pela melhoria da segurança no trabalho nesta empresa específica.
Palavras-chave: Clima de segurança no trabalho; Resultados relacionados com a
IV
Executive Summary
People spend a significant time at their workplaces, and often their jobs bring meaning to their life. Sometimes, work may dominate the lives of many people, and because of this all individuals should have safe and healthy work environment.
For an organization, to provide a healthy environment to all employees is not important only to worry about injury and illness. But, what exactly represents one healthy organization? Some authors define it as one that survives but also continuously develops and expand its abilities (Miles, 1965). Other authors extend this definition by including the health of employees when they describe the organization as one that is financially successful and has a healthy workforce (Cooper, 1994).
When the organization is “healthy”, it is able to maintain a healthy and satisfying work environment for all employees, even in times of market turbulence and change. Factors, such as high productivity, high employee satisfaction, good safety records, few disability claims and union grievances, low absenteeism, low turnover, and the absence of violence, can characterized the health of work environment (Quick, 1999).
From the paragraph above we saw when one organization is “healthy”, but what factors affect the health of the people inside the organization? The World Health Organization, in 1946, defined health as not just the absence of disease, but as a state of complete physical, mental, and social well–being. Later, in 1986, the Ottawa Charter defined health as a resource for everyday life. In conclusion, health includes social and personal resources as well as physical capabilities, and the ability to have and to reach goals, meet personal needs, and cope with everyday life.
After giving a definition for health and after explaning what is needed to work in a healthy and safety environment, now let’s define what will happen when we put everything in one system. Most of the authors call this system “climate”. "Climate" in one organization represents an emergent property, characterizing groups of individuals. Operationally, it is assessed by aggregating individual perceptions to the required unit of analysis (unit as organization, department, work group, etc.), and using the mean to represent the climate for the entity (Reichers, 1990). But, what is the difference between organizational and safety climate in one organization? Organizational climate refers to shared perceptions among members of an organization with regards to its fundamental properties. The fundamental properties are all policies, procedures and practices (Reichers, 1990).
V
On the other hand, safety climate relates to shared perceptions with regard to safety policies, procedures, and practices. Clarke (2000) is agreeing that safety climate contains three main dimensions/ components and they are:
- Management commitment – managers` actions and attitudes regarding safety; - Safety climate system – satisfaction with company, safety policy and procedures; - Risk – level of workplace risk and how the workforce perceives this (Clarke, 2000). Some authors said that safety climate may be viewed as a sub climate of the more general organizational climate, but focused on a more specific area of organizational functioning. At the individual level, safety climate represents perceptions of the work environment as regard safety. It allows individuals to interpret all organizational events and process in relation to personal and organizational safety values (Schneider, 1985).
Safety climate has the role of mediator between the organizational climate and safety – related outcomes. With other words, the influence of organizational climate is completely mediated by the safety climate. But, in one point climate perceptions could impact on work motivation which affects job performance. These perceptions could impact on job satisfaction as well, which affect the psychological well-being and withdrawal. Nevertheless, a positive safety climate, in which all employees in the organization perceive all safety policies, procedures and practices in an effective way, and when managers are committed to safety, this definitely will increase employees` feelings of commitment and satisfaction with the organization. In turn, this will affect their work attitudes and will reduce the occupational risks.
If in one organization the safety climate has a negative side, it is clear that climate perceptions show that all policies and procedures are ineffective, and there is a lack of management commitment to safety. As a result, this will have effect of reducing physical and psychological well–being, and leave employees more vulnerable to accidents and injuries.
The main purpose of this project is to analyze how the safety climate affects the work of all employees, the productivity, and the safety-related outcomes. To do this, will be conducted a cross-sectional research in a Bulgarian company: MLPS, an small company engaged in manufacturing of parts and assemblies made of ferrous and non-ferrous metals, plastics and rubbers.
First, a needs analysis was conducted. The company provided information about its safety-related issues and work accidents. This information was analyzed, showing that organizational climate is significant and from this depends what will be outcomes.
VI
Moreover, the safety-related outcomes depend on how well the employees perceived the existing safety policy. That is why, safety climate has a very strong impact on the safety-related outcomes, i.e. if the employees think only to do the job on time, and as a result they think less for the risks it may occur.
Such needs analysis motivated an empirical study to analyze the safety climate in the company through the NOSACQ-50 questionnaire (Nordic Occupational Safety Climate Questionnaire), and its association with key organizational indicators such as Affective Commitment, Job Satisfaction, psychological well-being (measured with the GHQ-12: General Health Questionnaire), Subjective Productivity, and Intention to Leave.
The results of this cross-sectional research will be an integral part of understanding how safety climate influences the occupational accidents by following the model, which link them trough a number of pathways (see Griffin & Neal, 2001).
Findings are used for guiding future interventions aimed at improving the safety in this specific organization. In that sense, it is necessary to mention that interventions are often recommended when one organization wants to improve employee psychological health and well-being (Nielsen, 2013). “Actors” who are involved in developing and implementing interventions are employees and managers. Employees are targets of intervention, but also play a role in the intervention program by developing and implementing. Their participation is recommended, because one the main goals of interventions are to improve their working conditions. Participation can take many forms – completing questionnaires to prioritize areas of action, developing action plans and being responsible for implementing interventions. The others “actors” are the managers. They play also very important role, because they have to support this intervention program and to ensure its success. Also, their role is vital to the process, without them this is not possible. They have the means to allocate resources to plan, implement and evaluate the program. In addition, they have the job to communicate these plans with all employees, who are involved in the process.
In sum, a proposal for implementing an intervention aimed at improving the safety climate in this particular company is made. Such proposal considers the features and characteristics of the participating company, which are discussed in detail as potential barriers need to be taken into account when interventions are designed. Finally, I offer some conclusions derived from this project that can apply to similar contexts.
1
1. Context of the issue and theoretical framework
The main purpose of this project is to analyze how the safety climate affects the work of all employees, the productivity, and the safety-related outcomes in a Bulgarian company. Thus, the relevance of this project resides in the fact that having a proper safety climate should be related to better productivity and employee health and well-being. Thus, for a company in the production sector is vital to have a strong safety policy; indeed, having healthy employees should be priority for the managers. It is obvious that working without clear safety system hides risks of high level of accidents and injuries. If the company does not see this the safety performance will be very poor.
In that sense, it is essential to give definition for accidents in the work place, because before making decisions it is important to know for what exactly to look. European Commission defines accident in the work place as “a discrete occurrence in the course of work which leads to physical harm”. This includes cases of different acts, but excludes deliberate self-inflicted injuries and accidents on the way to and from work (Dyreborg, 2011).
Work accidents cost to economy a lot of money every year. A fatal work injury occurs mostly in every 2 hours and a disabling injury in every 8 seconds. Some large accidents cause great damage not only to the organization, but to the economy and the industry as well. This is why there is a need for research in the path leading from safety climate to safety outcomes.
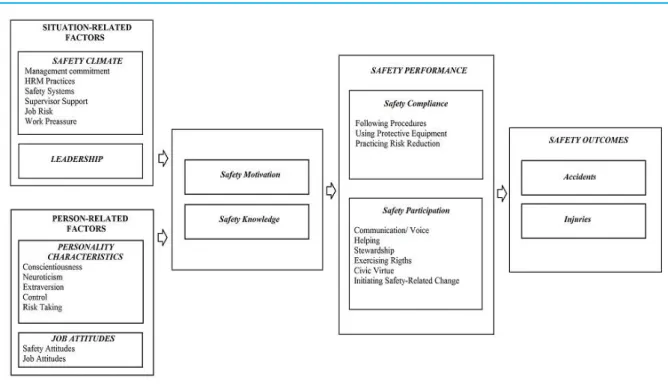
In doing so, this project follows the model proposed by Griffin (2000) (see Figure 1). Such model shows how important is to understand the links between all safety factors, such as safety climate, leadership, similarly all personality characteristics as control, risk taking, etc., through safety performance, and safety outcomes (Griffin & Neal, 2000).
Without analyzing the factors which can influence the performance, is not possible to predict what will be the safety outcomes. That is why is important first to understand how works the safety system in the company, after this to see what are the “weak” spots in it, and at the end to discuss how to improve them. Further, from the model above we see that there is a connection between safety climate and safety outcomes, and going step by step through the path is easier to understand what is not working right and how this affect the outcomes - on a negative way or on a positive way. All of the antecedents are indirect in that they operate through safety performance behaviors. The only direct antecedent to safety
2
outcomes is safety performance behavior. Everything of this makes the project so interesting and at the same time very important for the company.
Fig. 1. Model of workplace safety
The model of organizational climate and occupational accidents
The model which links the organizational climate (role, job, leader, group and organization) and occupational accidents can help easily to understand exactly how works the safety system. Safety climate influences occupational accidents through a number of mediating pathways. With the questionnaires were analyzed all 5 indicators from the model. With their help it has been estimated their condition. For example, with NOSACQ-50 has been estimated the condition of whole safety climate in the department, etc.
3
Linking the results from the analysis it can be said that if the manager position is not clear, then he wouldn`t be able to promote the safety policy in a successful way. For example, if he is not communicating with the employees about their needed equipment for doing their job normally, this will increase the chance of an accident happens. Following the model through the path, workers will think that their managers do not think about their safety. Moreover, they will say that they are feeling not productive. When employees feel that they do not contribute to their work and even to their company, they will stop thinking about their safety and will become sloppier about their performance. They will give low results in terms of their performance of their working duties and this will increase costs of the company. At the end of the model, when the safety performance of all workers gives negative results, then this will invariably lead to work accidents. Of course, there are many pathways in this model which link the organizational climate and occupational accidents. To conclude, following the model is very easy to understand how works the safety system in one organization. There is a link between all indicators which help to locate the problems and to improve the safety in one organization. On the next figure is easier to see the path from his very beginning.
4
Lastly, safety climate is important not only for the managers to sustain a healthy work environment, but the quantity and quality of production as well. The data shows that when small accidents such as slipping or small body injuries do not affect the production. But, when somebody broke his leg has a huge impact on the production. First, this has an impact on the quality of the production, because the supervisor needs time to discuss with the manager who will do his job, while they are looking for a solution. They have two options – to order other employee from the department who is aware with the nature of the job, or to hire person from outside to replace this employee. Definitely, the second option will cost much more to the company, because they have to train this person. Also, hiring person from outside requires paying health insurance, etc. An employee from the department will cost less, but this is hiding risk from burning out. He will be overloaded with duties while doing his job and the job of the employee whom he replaces. Also, there is a possibility of a rising problems with his supervisor who will follow strictly for how he is doing his job. As a result, the employee will feel that he doesn`t deserve that kind of respect, because he is hired for one job, but he is working another job.
For a specific moment like this one, company provided information in which they say that for the last six month they had two similar situations as the described above. Their policy, in this case was to hire people from outside who have the required capacity to do the job in a proper way. Why they do this? They had done that because the injured employees needed at least six months to get better physical and at least two months to get back in a shape to do their job. It is well known that when someone have a work accidents he needs time to get better physically and mentally as well. Since, the job in the department requires a perfect health, the management considered for the best solution to hire two people for six months, with a perspective to stay in the company. Benefits for the company are that they will have people who to replace the two injured employees and the costs which they will put in their training will return them after time.
5
2
.
Literature Review
Culture in one organization is ingrained in the behavior of all members of this organization. Also, to change the culture in one organization is very difficult process and requires time. With more simple words, the culture can be thought of as the “personality” of the organization. Every organization has a unique culture, which creates atmosphere that is felt by the people who are part of this. We can call this atmosphere as the climate of the organization. Organizational climate is defined as how members experience the culture of an organization (Denison, 1996).
Organizations have multiple goals and means of attaining those goals, so it is a job of the managers to develop a specific policies and procedures to which employees attend in multiple specific climates. Thus, safety climate relates to shared perceptions with regard to safety policy, procedures and practices (Zohar, 2002). Cooper (1996) claims that safety
climate is concerned with the shared perceptions and beliefs that employees hold regarding safety in their workplace. Many researchers have shown that organizations with a good safety climate tend to have fewer accidents, and vice versa (Cooper D. , 1996). It makes sense to measure safety climate vie different surveys and questionnaires, so that any lack in safety system to be identified. The results enable managers to see their communication, weaknesses in safety procedures, gaps in safety training, etc.
The association between organizational climate and safety climate is linked with the occupational accidents. It is important to track the connection between training, all safety systems, the quality of communication, and human resource practices. Vredenburgh (2002) examined six major management practices and their role is to be injury rate predictors. They are: management commitment, rewards, communication and feedback, selection, training and participation. All of them can be considered as different aspects from the organizational climate, and each of them has effect on the safety outcomes.
Leadership style, management support and trust have been associated with safety perceptions and accident involvements. Also, they can be considered as an element of organizational climate. Barling, Loughlin and Kelloway (2002) found that there is no significant relationship between leadership and injuries, but safety climate is a mediator between transformational leadership and occupational healthy. How this works? All transformational leaders generate a positive safety climate; they show interest in the personal and professional development of their subordinates; demonstrate concern for them, including emotional support. The support from a leader can have a negative and a positive
6
relationship with injuries. Negative relation is when there is a lack of communication between leader and subordinates; when the supervisors do not provide informational assistance to workers in carrying their work is a negative relation as well. In contrast, Parker, Axtell, and Turner (2001) found that supportive supervisors build more positive relationship with their subordinates, encourage them to be more open, the communication is informal, and then the results lead to higher level of safety commitment and compliance amongst workers.
Another important variable which can predict the safety initiative is the work group cohesiveness. Group cohesion is a group of members who share common values, beliefs, and objectives. In a result, this promotes sharing of similar ideas and their mutual acceptance. The cohesion is positively related to performance, and the “working climate” (communication and relationships) is significantly related to work injuries (Gully, 1995) (Trimpop, 2000). The aspect of team climate can allow group members to suggest alternative ways of working, to admit mistakes and problems, and contributes to learning, and as a result to reduce injury rates. All group process could influence individual safety behavior.
Last but not least, the nature of the job and the work role may have direct effects on injury rates. Workers who perceive that they are under high pressure to increase the production, in one point may deviate the safety rules and to perform the tasks with less care, increasing the likelihood of errors. Two factors are significantly related and they are time pressure and “time binding” (autonomy over time management) (Greiner, 1998).
Except these factors, safety performance in one point might refer to an organizational metric for safety outcomes. It is important to note that safety outcomes can be number of injuries per week, month, or year. Conversely, safety performance may refer to a metric for safety-related behaviors of individuals (Neal, 2001). Of course, there are some factors which can influence safety performance, and they are listed below:
- Management commitment – all employees perceive organizational support and managerial communication from their managers/ supervisors;
- Human resource management practices – when there are clear selections systems, safety training program, performance management, and reward system;
- Safety system – safety policy and procedures, and in case of accident to have incident investigation;
- Supervisor support – supervisory safety communication, safety orientation, and supervisory safety consciousness and safety values;
7
- Internal group process – safety backup from colleagues, peer safety orientation and trust in them;
- Risk – all kind of job risk to be perceived, the accident potential and physical hazards of the job to be prevented and perceived job safety;
- Work pressure – pressure from the production, to take shortcuts, time pressure, and workload.
As it was already mentioned, safety climate has the role of a mediator between organizational climate and safety outcomes. But, in one point climate perceptions could impact on work motivation, which affects job performance. These perceptions could impact on job satisfaction as well, which affects the psychological well – being and withdrawal. Nevertheless, a positive safety climate, in which all employees in the organization perceive all safety policies, procedures and practices in an effective way, and when managers are committed to safety, this definitely will increase employees` feelings of commitment and satisfaction with the organization. In turn, this will affect their work attitudes and will reduce the occupational risk. If in one organization the safety climate has a negative side, it is clear that climate perceptions show that all policies and procedures are ineffective, and there is a lack of management commitment to safety. As a result, this will have effect of reducing physical and psychological well–being, and leave employees more vulnerable to accidents and injuries.
Morrow and Grum (1998) found that safety climate is a significant predictor of occupational stress. Stressors as job control, skill use, responsibility for others` safety and job certainty can reduce the confidence in working safety, and to increase perceptions of danger, and this can lead to increasing the workplace stress. On the other hand, when employees experience high level of stress is also likely to affect the safety climate, fostering negative perceptions of management commitment, dissatisfaction with safety, and reducing feelings of individual responsibility for safety. In conclusion, it is obvious that the relationship between safety climate and occupational stress is likely to be reciprocal, as it could be seen below.
8 Fig. 3. Extended model of the relationship between organizational climate, safety climate, and
accidents to include the injury of job stress (Cooper L. C., 2009)
Figure 3 above shows that stress has an indirect effect on injuries, mediated by safety climate. This means that stress at work affects the way that workers perceive the work environment, which leads to more negative safety attitudes. The safety culture has an indirect effect on injuries, mediated by occupational stress, or the way the work environment is perceived by workers affect the experience of workplace factors as stressful.
As it was already mentioned, the occupational stressors have a significant direct effect on near misses, and the responsibility for others` safety also had a direct effect on injuries (Morrow, 1998). This relationship is mediated by psychological and physical symptoms. The link between mental health and work injuries is also important, because job stressors on the workplace may include increased absenteeism, high turnover, or low job performance. This is the effect at an organizational level, but at the individual level, these stressors can affect efficiency, motivation, etc. Even if the individuals attend work when they are sick or distressed, their performance will be reduced, which will lead to increasing errors and feelings of resentment.
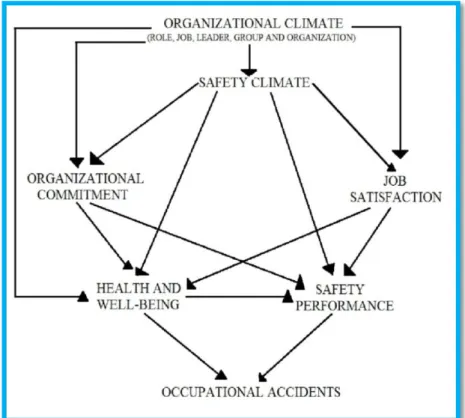
To summarize, the relationships between safety climate, occupational accidents and safety outcomes, will be used the model below (Cooper L. C., 2009). In this model is visible that organizational climate acts as an antecedent of safety climate. This link in turn influences occupational accidents through a number of mediating pathways. They are organizational commitment, job satisfaction, psychological well-being, and safety
9
performance. But, there are also significant pathways between organizational climate, organizational commitment, job satisfaction, and psychological well-being. In addition, significant relationship exists between work attitudes and well-being, given the links between organizational commitment, job satisfaction, and psychological strain. The model could be seen below.
Fig. 4. Hypothesized model of linking organizational climate, safety climate, work attitudes and
individual safety outcomes
To conclude, the proposed model of safety climate above, which considers the influence of a range of job and organizational factors on safety climate, extends the type and the scope of interventions that could be used to improve the safety in one organization.
In the nineteenth century, the efforts to reduce the rate of occupational accidents were mainly concentrated on technical solutions, regulations and human factors. In recent years the awareness has increased of the importance for safety performance of organizational, managerial and social factors (Clarke S, 2006).
Nowadays, many companies do different researches within the area of work accidents. The general aims are at developing, implementing and evaluating interventions which are directed at improving safety.
10
It is common that small companies have high rates of work related injuries and pervasive challenges in preventing them (Ozmec M.N., 2015). Reason for that statement is the
belief that small companies do not invest so many resources in safety policy as opposed to big companies. It can be said that this is one of the main reasons leading to ineffective safety climate in one organization.
This situation may apply to the organization analyzed in this project, which is a small company involved with the development of parking systems and devices. Until the moment, in the company work 65 employees, 40 of them are in the production. Consequently, this project will focus in areas where there is a high risk of work accidents and main goals will be to develop, implement and evaluate interventions and means directed at improving the safety of the company.
In the next section, I describe the company and provide information about their current status in safety-related issues (company profile). Then, I focus on the empirical study and its methodology (e.g., characteristics of the sample, measures and instruments used, data analysis strategy). Then, after analyzing the results and doing the diagnosis of the company in safety issues, the intervention program that may be applied in this case is described. Finally, some conclusions of the current project are discussed.
Company profile
The name of the company is “MLPS” and was established in January 2013 in Rousse, Bulgaria, but the factory is situated in Tutrakan city. Company is engaged in manufacturing of parts and assemblies made of ferrous and non-ferrous metals, plastics and rubbers. It works on tolling for the Italian company “GLS”. “MLPS” is predecessor of the company “DSH”, which was involved with the development of parking systems and devices.
Mission of the company is through their products to guarantee the satisfaction of their customers and partners on the quality, durability and efficiency. Their business plans, innovations and technologies used in production, ensure continuous growth in their market competitiveness and increase the company`s value for shareholders and society. Also, they constantly are caring for the human health, nature conservation and the health and well-being of their employees.
11 Fig. 5. Structure of “MLPS”
Regarding safety performance and accidents at workplace, the company provided number and type of organizational accidents for each employee in the department and incidence rate for the safety performance. Components of safety performance describe the actual behaviors that each employee performs at work. For the two major components of safety performance will be considered task performance and contextual performance (Borman, 1993). First, for the task performance will be used safety compliance. Task compliance describes the core safety activities that need to be carried out by all employees and main goal is to maintain safety at the workplace. Such behavior includes, to lockout for the safety procedures and wearing personal protection equipment. Second is the contextual performance or safety participation. Safety participation describes behaviors such as participating in voluntary activities, concerning safety at the workplace or attending all safety meeting, led by the supervisors. In addition, these behaviors may not directly contribute to safety, but they will help to develop an environment that supports safety. The company provided a report which consist information about their safety performance. In this report they were taking notes about the described behaviors of all employees in the production department.
In addition, company provided their report for all work accidents and injuries during the past six months. This report contains information about how many workers get injured and from exactly what they have suffered.
12
With this information a needs analysis was conducted. First, regarding safety performance, I analyzed the information from the company’s report on this issue. As a conclusion, all workers wear personal protection equipment, which is mandatory for the work. But, in the report is stated that not all of the employees participate in the safety meetings which are every month. Reason for that is that they are carried out during work time. Even if the management provides this safety meeting to their employees, the workers cannot decide what to do – to do their job, or to go to these meetings. Managers and the production supervisor in the department stated that the employees want to be part of safety activities, but for some reasons they do not participate on a 100 percent. This is evidence that there is a lack of motivation and communication. Employees are not motivated to be part of the safety process and did not make sense for them to be part. This is a result from not very good communication and indicates that the link “supervisor – employee” is not productive.
If follow the factors which can influence safety performance, it could be said that some of them have stronger impact and others less. Report showed that sometimes the support from supervisors about safety communication and safety orientation is weak. This leads to weak management commitment. It makes employees to think more for the work and with this they are vulnerable to work accidents. Of course, for safety performance main role has management, because from them start the safety chain. On the next figure is visible that each factor affect safety performance differently, but in some point each of the factors is dependent from others. For example, if supervisors do not provide clear safety policy and do not have incident investigation, when is needed, this is a signal that their safety values do not match with employees vision for safety environment, etc.
13 Figure 6. Safety performance factors
In the next table, the company provided information about six work accidents which occurred most often in the production department, from the beginning of the year until now, or for the last 8 months. They are: slip; cramps; burns on the face and body; dazzle with welding equipment; body injuries, including fracture on the hand, foot, knee, etc.; and poisoning with chemicals. All accidents are directly related with the specific work in the department.
In the table are showed six of the most common work accidents and injuries. Some of them causing minor injuries, but others might risk their life. Nevertheless, some of these minor injuries are possible reason for bigger injuries, e.g. slip can lead to fracture of the foot or hand. In addition, the table provides the number of employees who suffered from the listed work accidents and injuries, for six months. To understand the frequency of work accidents per day, per week and per month, there were some additional calculations. The number of people injured for six months is divided into 6 (period of six months). The result shows the frequency per month. Then, this result is divided into 4 (four weeks in one month), so it can be seen the weekly frequency of accidents. After this, the result is divided into 5 (five working days in one week) – daily frequency. Frequency is showing the average number for work accidents, since these accidents do not happen every day and do not repeat on a certain period of time. The calculations are showed below.
Slipping 28 / 6= 4.66 / 4= 1.16 / 5= 0.23 Cramps 24 / 6= 4 / 4= 1 / 5= 0.2
14 Burn 8 / 6= 1.33 / 4= 0.33 / 5= 0.06 Dazzle 16 / 6= 2.66 / 4= 0.66 / 5= 0.13 Body injuries 2 / 6= 0.33 / 4= 0.08 / 5= 0.02 Poisoning 4 / 6= 0.66 / 4= 0.16 / 5= 0.30 Table 1.
Statistics for work accidents and injuries
Slipping Cramps Burns Dazzle Body
injuries Poisoning
People injured (for six
months) 28 24 8 16 2 4 Frequency of accidents Daily(average) 0.23 0.2 0.06 0.13 0.02 0.03 Weekly(average) 1.16 1 0.33 0.66 0.08 0.16 Monthly(average) 4.66 4 1.33 2.66 0.33 0.66 Half yearly 28 24 8 16 2 4
This statistics is showing that the company should think about to improve the safety because many people do think about the minor accidents, but they can be prerequisite for bigger work accident which can lead to permanent disability. Of course, the safety policy which the company establishes is good, but is not perfect. Yes, there is no death incidents, but there are registered a lot of minor accidents and injuries which could lead to a fatal end. To conclude, managers should think to talk more with their employees about how important is to work safely and in accordance with the safety policy. Awareness about how risky can be their work will increase their ability to work safely and at the same time always to take precautions, not only for them but for their co-workers as well.
This analysis is showing that organizational climate is significant and from this depends what will be the outcomes. Moreover, the safety-related outcomes depend on how well the employees perceived the existing safety policy. That is why, safety climate has a very strong impact on the safety-related outcomes, e.g. if the employees think only to do the job on time, and as a result they think less for the risks which may occur.
15
3. Study methodology
To test whether the conclusions derived from the existing documents about the safety status in the company were correct, I decided to conduct an empirical study. This section describes the sample, instruments, data analysis strategy and results.
3.1. Procedure
This study followed a cross-sectional design with questionnaires. Each questionnaire consist a series of statements on which all workers in the production department of “MLPS” were asked to give their opinion according to a given scale. The majority of the statements were used a Likert scale. Before starting to fill out questionnaires all of the participants were assured that the data provided by them shall be used only for developing this project. Each employee received a set of questionnaires from his supervisor. After filling out the questionnaires, participants returned them in a closed envelope, and put them into a box which was on a visible place at the office. All of the participants were assured that filling the questionnaires is completely anonymous and neither of their answers will be seen from their supervisor. After collecting all questionnaires, the information was processed and analyzed.
3.2. Sample
In particular, this research was conducted in the production department of company “MLPS”, which comprises 40. Participants are between 22 and 46 years old. The average age for the participants is 30 years old (Table 2). With “0” is marked female and with “1” – male. The majority is between 25 and 27 years old (Table 3). More than half are men (67%) which indicate that the job in this department requires manpower, specifically for the job, training and working always in accordance with the established safety policy (Table 4). 87,5% of the participants are regular workers, which mean that only 5 participants have a managerial position in the production department (Table 5). All that information could be seen in the tables below.
16 Table 2 Statistics Age Sex N Valid 40 40 Missing 0 0 Mean 30.10 .68 Std. Deviation 6.197 .474 Minimum 22 0 Maximum 46 1 Table 3 Age
Frequency Percent Valid Percent Cumulative Percent
Valid 22 1 2.5 2.5 2.5 23 1 2.5 2.5 5.0 24 2 5.0 5.0 10.0 25 6 15.0 15.0 25.0 26 5 12.5 12.5 37.5 27 4 10.0 10.0 47.5 28 3 7.5 7.5 55.0 29 1 2.5 2.5 57.5 30 2 5.0 5.0 62.5 31 2 5.0 5.0 67.5 32 3 7.5 7.5 75.0 33 1 2.5 2.5 77.5 35 1 2.5 2.5 80.0 36 2 5.0 5.0 85.0 38 1 2.5 2.5 87.5 40 2 5.0 5.0 92.5 43 1 2.5 2.5 95.0 45 1 2.5 2.5 97.5 46 1 2.5 2.5 100.0 Total 40 100.0 100.0
17
Table 4
Sex
Frequency Percent Valid Percent Cumulative Percent
Valid Female 13 32.5 32.5 32.5
Male 27 67.5 67.5 100.0
Total 40 100.0 100.0
Table 5
Position in the department
Frequency Percent Valid Percent Cumulative Percent
Valid Regular worker 35 87.5 87.5 87.5
Manager 5 12.5 12.5 100.0
Total 40 100.0 100.0
3.3. Instruments
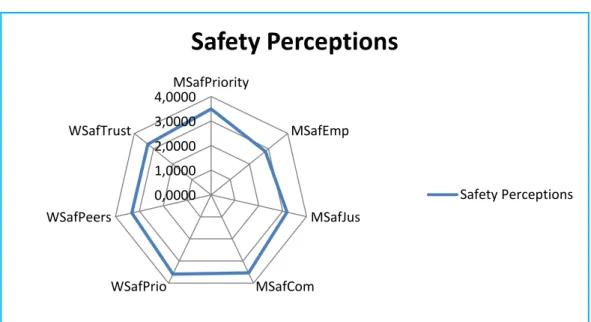
Safety climate. To analyze the safety climate in the company will be used the Nordic Safety Climate questionnaire (Kines, 2012). Aim of NOSACQ is to measure safety climate,
based on theory and empirical research. In the questionnaire, there are 7 safety climate dimensions, comprising 50 items, with 22 evaluating management level and 28 evaluating workgroup level conditions. The included safety climate dimensions are: Management safety priority and ability (9 items); Management safety justice (6 items); Management safety empowerment (7 items); Workers`safety commitment (6 items); Workers`safety priority and risk non-acceptance (7 items); Peer safety communication, learning and trust in efficacy of safety systems (7 items).
As it was already mentioned, NOSACQ is a tool for diagnosing occupational safety climate and evaluating safety interventions. So, the results from the survey will be seen as a tool for dialogue and development – not as a “grade book”. The results reflect the participants` perceptions of the safety climate, and not necessarily the actual conditions. With other words, the survey provides a “snapshot” of conditions that can easily change, and therefore they will be interpreted carefully.
Psychological well-being was measured using the General Health questionnaire (GHQ-12) (Goldberg, 1988). The GHQ-12 is a self-administered screening instrument for
18
psychiatric disorders in nonclinical populations that provides a more general measure of psychological wellbeing. The scale of this questionnaire asks whether the respondent has experienced a particular symptom or behavior recently. Each item is rated on a four-point scale (much less than usual, same as usual, more than usual, or much more than usual). For this study will be used Likert scale method (0-1-2-3) (Goldberg D. P., 1972).
Affective commitment. The dimension affective commitment of the Organizational Commitment Scale developed by Allen and Mayer (1990) with 8 questions was used. Items follow a Likert scale from 1 – strongly disagree to 7 – strongly agree. Using this dimension is aimed to see how much one employee is committed to his organization, does he feel a strong sense of belonging and does he feel “part of the family” (Allen, 1990).
Overall job satisfaction. I used only one question with a Likert scale from 1-completely unsatisfied to 10-1-completely satisfied. In this way will be analyzed how much the employees like their work, e.g. how satisfied they are with the work. The results from this analysis allow us to link with the intention to leave. If they are not satisfied with their work the probability to leave this organization is increasing, and reversed.
Productivity. It was used a 4-items scale to ask employees about what was their productivity for the last week (König, 2010). Again, will be used a Likert scale from 1-strongly disagree to 7-1-strongly agree. The productivity could be also linked with the intention to leave, because if one employee was not productive for the past week or if he had the impression that he is wasting his time – then his place is not in this organization.
Intention to leave (Mobley, 1977) (Mobley, Horner, & Hollingsworth, An evaluation of precursors of hospital employee turnover, 1978) is probably one of the important areas, because the questions are direct and they need a direct answer. The questions are 3, again Likert scale from 1-strongly disagree to 5-strongly agree. Here, the minimum score is three and the maximum is 15. Higher score indicates higher intention to quit/leave this job/organization. All items in the questionnaires are answered in the same way (Likert scale 1 to 4 or 1 to 7), but have to be scored dependent of the formulating of the questions. With other words, these questions are reversed as it showed in the table below:
19 Table 6
Scoring the items in the questionnaires with a Likert scale
Strongly disagree
Disagree Agree Strongly agree
Score for
positive items 1 2 3 4
Score for
reversed items 4 3 2 1
Safety performance and workplace accidents were measured by the organizational indicators available in the company, such as incidence rate. Then, this information will be linked to the responses of the questionnaires.
3.4. Data analysis strategy
To empirically validate the information gathered from the company, I analyzed the main variables of this study (questionnaires) using SPSS. Analyzing these variables separately will help to understand easily what the “condition” of the safety climate is. Also, will show in more details if there is a problem – where exactly is the problem, and after this will be easily to know what to do, to fix it.
The analysis begins with basic statistical information about the participants, including age, sex and position in the company. This is important because from their age and position in the company depends their satisfaction with the company and their future work. Also, this is important and for understanding how they perceive the safety.
After this basic information a reliability test will be conducted to see which items are related to each other and what is their reliable variance. For this will be used a Cronbach`s alpha. This test calculates the number of commonly used measures of scale, and also provides information on the relationship between various elements. With the use of reliability analysis, it can be determine the extent to which all elements in the questionnaires are related to each other. Cronbach`s alpha is an indicator of consistency and estimates the reliability. It can range from 0.00 to 1.0, where:
20
- 1.0 – perfect consistency, 0.70 – means that 70 % of the variance in the scores is reliable variance.
Common statistical ways for describing or estimating a population characteristic includes central tendencies (mean, medians and modes), variation of observation around the central tendency (standard deviation, variance and range) and association between two or more characteristics (Pearson correlation). All of this is important for understanding how two or more variables are related. To understand the relationship between two variables, first, is important to answer three main questions:
- Are the two variables related?
- If they are related, what is the type of relationship?
- And, what is the direction and how strong is the relationship?
There for, the association between two or more variables will be measured by using the correlation coefficient. It represents the strength of the linear association between variables. More specifically will be used Pearson correlation.
With other words, the Pearson correlation is a measure of how are related the variables in the data, which we have. As a guideline for “magnitude” the correlation will be used as follows:
r = .10 to .29 or r = -.10 to -.29 small or weak correlation r = .30 to .49 or r = -.30 to -.49 medium or moderate r = .50 to 1.0 or r = -.50 to -1.0 large or strong
It is important to note that when Pearson`s is close to 1, this mean that there is a strong relation between the variables. This means that changes in one variable are strongly correlated with changes in the second variable. When Pearson`s is close to 0 then the relationship between two variables is weak. This means that changes in one variable are not correlated with the changes in the second variable. Further, when Pearson`s is positive this means that as one variable increases in value, the second variable also increases in value. Similarly, as one variable decreases in value, the second variable also decreases in value. This is called a positive correlation. But, when Pearson`s is negative then this means that as one variable increases in value, the second variable decreases in value. This is called a negative correlation.
When we see what the correlations between all variables in this research are, we will do a regression analysis. Since, the focus in this project is on more than 2 variables, the regression is multiple. The general purpose of multiple regressions is to learn more about the relationship between several independent variables, also known as a predictor, and
21
dependent variables. With other words, when one or more variables can explain and predict values of another variable, changes in the first, cause the second variable to change.
22
4. Results
4.1. Reliability
First, it is necessary to mention that the reliability of the measures was inadequate in some cases (Cronbach`s alpha). However, all of the variables and items will be used in further analyzes because the small number of the sample compare to the number of items (few cases per item) may make reliability very low without seriously attenuate validity of the variables (Schmitt, 1996). In that sense, the NOSACQ-50, the GHQ-12, the organizational commitment and productivity questionnaires presented scores below the suggested .70, whereas Cronbach`s alpha for intention to leave company was 0.741.
4.2. Correlation
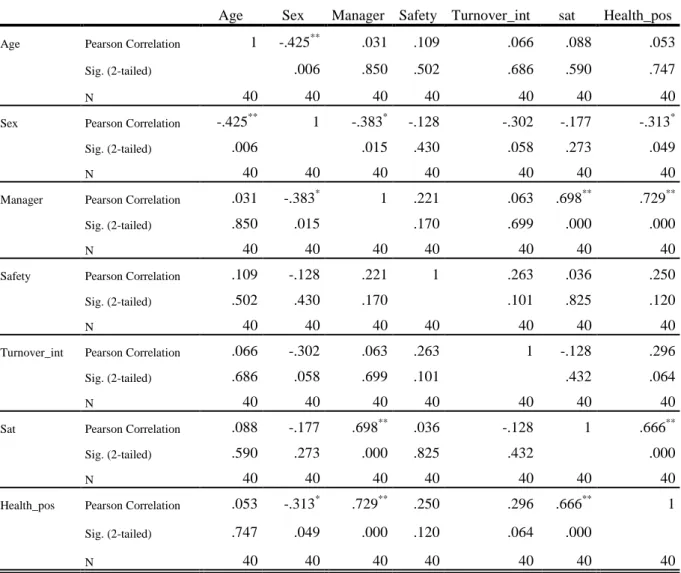
In the table below is viewed the correlations between variables: Age, Sex, Manager, Safety, Turnover, Satisfaction and Health. Looking at the table what makes impression is that the correlation between some variables is significant, but for others the correlation is very weak. First, impression makes the Pearson`s value for variables “Health” and “Satisfaction” 0.666. This correlation is significant and is positive. What we can state is that there is a positive significant correlation between health of the employees and their satisfaction. If their health decrease as a result from their work, then and their satisfaction will decrease. Another strong correlation is between variables “Manager” and “Satisfaction” 0.698. This number is close to 1 and is positive. This means that employees who have a managerial position are more satisfied with the work, or the higher position you have in the company, the higher satisfaction you will get from the work.
The other very strong correlation is between “Manager” and “Health”. Pearson`s statistic r is 0.729 which is very close to 1, and is positive. This means that employee who has managerial position in the company has better health, or the higher position you have in the company the better health you will have.
On the other side are the median or the small correlation. If we look at the Pearson`s value for “Satisfaction” and “Turnover” we will see a negative value -0.128. Simply, that means that when your satisfaction with the work is very low, then your intention to leave will be very high, and reversed. Also, this value is in the range -0.1 to -0.3 which indicate a low correlation between the two variables.
23
Except Pearson correlation, it is important to look at Sig (2-tailed) values which show us is there a statistically significant correlation between the variables. If the Sig (2-tailed) value is greater than 0.05 it can be concluded that there is no statistically significant correlation between these variables. If the Sig (2-tailed) value is less than or equal to 0.05, then it can conclude that there is a statistically significant correlation. Again, looking at the table could be seen that the statistically significant correlations exist between variables “Manager” – “Health”, “Manager” – “Satisfaction” and “Health” – “Satisfaction”.
Table 7
Correlations
Age Sex Manager Safety Turnover_int sat Health_pos
Age Pearson Correlation 1 -.425** .031 .109 .066 .088 .053
Sig. (2-tailed) .006 .850 .502 .686 .590 .747
N 40 40 40 40 40 40 40
Sex Pearson Correlation -.425** 1 -.383* -.128 -.302 -.177 -.313*
Sig. (2-tailed) .006 .015 .430 .058 .273 .049
N 40 40 40 40 40 40 40
Manager Pearson Correlation .031 -.383* 1 .221 .063 .698** .729**
Sig. (2-tailed) .850 .015 .170 .699 .000 .000
N 40 40 40 40 40 40 40
Safety Pearson Correlation .109 -.128 .221 1 .263 .036 .250
Sig. (2-tailed) .502 .430 .170 .101 .825 .120
N 40 40 40 40 40 40 40
Turnover_int Pearson Correlation .066 -.302 .063 .263 1 -.128 .296
Sig. (2-tailed) .686 .058 .699 .101 .432 .064
N 40 40 40 40 40 40 40
Sat Pearson Correlation .088 -.177 .698** .036 -.128 1 .666**
Sig. (2-tailed) .590 .273 .000 .825 .432 .000
N 40 40 40 40 40 40 40
Health_pos Pearson Correlation .053 -.313* .729** .250 .296 .666** 1
Sig. (2-tailed) .747 .049 .000 .120 .064 .000
N 40 40 40 40 40 40 40
**. Correlation is significant at the 0.01 level (2-tailed). *. Correlation is significant at the 0.05 level (2-tailed).
Surprisingly, safety was not correlated to the main variables of this study. Therefore, a bivariate correlation between the main variables and the specific dimensions of safety was conducted in order to obtain more information. Safety dimensions were then introduced in the analysis: Management Safety Priority; Management Safety Empowerment; Management Safety Justice; Management Safety Commitment; Workers` Safety Priority; Workers` Safety
24
Peers and Workers` Safety Trust (These dimensions correspond to the original dimensions of the Safety questionnaire). This table could be seen in Appendecis, Table 1 Correlation for Management Safety Priority; Management Safety Empowerment; Management Safety Justice; Management Safety Commitment; Workers` Safety Priority; Workers` Safety Peers and Workers` Safety Trust.
First, let`s look at the Pearson correlation which indicates a significant correlation between variables. One of the strongest relationships is between variable “MSafJustice” and “Health” 0.660. This value is close to 1, so changes in the first value is strong correlated with the changes in the second, in this case “Health”. With other words, all employees in this company says that they are agree how the management collects information in accidents investigation, more, they are strongly agree how the management do their job if there occur an accident. Employee`s ability to report risk and their willingness to do so is one the primary sources of information that the company has about hazards. When employees are unwilling to report risk, near misses, or minor injuries is a signal that something is wrong with the safety policy. Further, if they are unwilling to report because of fear to be blamed or being punished, they are less engaged in workplace safety. This will leads to lower overall safety climate and negative impact on all other aspects such as production, quality of work, intention to leave, etc. Essentially, blaming an employee for working unsafely, without examining the systems of the workplace for the upstream causal factors that led to the unsafe act, ensures that no elements of the workplace will change to reducing risk or fix the true drivers of the hazards. To be concluded, when all managers apply good justice, then the health of all employees will increase, and reversed.
A medium or moderate correlation is between “WSafPeers” and “Turnover”. Here, the Pearson`s value is 0.434. Shortly, when employees have trust in their peers about the safety at the work place, and most important when they talk about it, is correlated with the changes in their intention to leave. This is evidence that is very important to build one very strong safety policy which will control situation like this. Group cohesiveness is related not only to share similar ideas, but is positively related to performance, communication and to work injuries as well. The analysis showed that the team climate allows to all group members to participate actively in the safety process, including to suggest alternative ways of working safely; to admit mistakes and problems without hesitation and fear of sanction and even to report accidents, when it occurs. As a conclusion to this correlation, all group process could influence individual safety behavior.
25
In addition, from this table for all safety dimensions which are related with the management of the company shows that the correlations between them are significant and changes in one variable, increase or decrease, is strongly correlated with changes in the second variable.
Sig 2-tailed for some variables are less than 0.05. In this case, the correlations between few of the variables are 0.000, which means that there is a statistically significant correlation. For example, between “MSafJus” and “Health”, “WSafCom” and “Health”; the Sig 2-tailed value for “MSafJus” and “Satisfaction” is 0.001.
4.3. Multiple regressions
A multiple regression was conducted to see if the safety climate influences the safety – related outcomes, through three variables “Satisfaction”, “Satisfaction” and “Health”.
First of all, the analysis starts with analyzing the model, to see if it fits. First table of interests is Model Summary. In this model the dependent variable is “Satisfaction”.
Table 8
Model Summary
Model R R Square Adjusted R Square
Std. Error of the Estimate
Change Statistics
R Square Change F Change df1 df2 Sig. F Change
1 .178a .032 -.021 .900 .032 .605 2 37 .551
2 .723b .523 .380 .701 .492 4.422 7 30 .002
a. Predictors: (Constant), Sex, Age
b. Predictors: (Constant), Sex, Age, WSafPrio, MSafEmp, WSafTrust, WSafPeers, MSafPriority, MSafCom, MSafJus
This table provides the R and R Square. R is the square root of R-Squared and is the correlation between the observed and predicted values of dependent variable. R Square is the proportion of variance in the dependent variable which can be explained by the independent variables.
Model 1 shows that R = 0.178. This number indicates that the correlation between the observed and predicted values of our dependent variable “Satisfaction” has a low level of prediction. For Model 2, R is 0.723 which indicate a good level of prediction. The R Squared column represents what is the proportion of variance in the dependent variable that can be explained by the independent variables. From the table above it could be seen that the R Square value for Model 1 is 0.032, which mean that the independent variables explain barely 3% of the variability of the dependent variable “Satisfaction”. For Model 2, R Square value is 0.523. This means that the independent variables explain 52,3% of the variability of the dependent variable.
26
From the next table, we are seeing that the Sig. value for Model 1 is 0.551, which is greater than 0.05. Conclusion – the model is not valid. For Model 2, the Sig. value is 0.003, which is less than 0.05, so the decision is that the regression model is valid and is a good fit of the data. The regression degrees of freedom correspond to the number of coefficient estimated minus 1. Including the intercept, there are 10, so the model has 10-1=9 degrees of freedom. The error degree of freedom is the “df” Total minus “df” model, or 39-9=30. The F-statistics is associated with p-value and represents the Mean Square (Regression) divided by the Mean Square (Residual). For Model 2 is 1.801 / 0.492= 3.6605. The p-value and t-value help to decide that the model is valid.
Table 9
ANOVAc
Model Sum of Squares df Mean Square F Sig.
1 Regression .981 2 .490 .605 .551a Residual 29.994 37 .811 Total 30.975 39 2 Regression 16.213 9 1.801 3.661 .003b Residual 14.762 30 .492 Total 30.975 39
a. Predictors: (Constant), Sex, Age
b. Predictors: (Constant), Sex, Age, WSafPrio, MSafEmp, WSafTrust, WSafPeers, MSafPriority, MSafCom, MSafJus
c. Dependent Variable: sat
From the next table will be used only the unstandardized coefficients, more specifically column “B”. Unstandardized coefficients indicate how much the dependent variable, in this case “Satisfaction”, varies with an independent variable when all other independent variables are held constant, consider the effect of Age in this research. The unstandardized coefficient for Age in Model 1 is 0.002. This means that for each one year increase in age, there is increase with the satisfaction with the work. In the Model 2 the situation is more interesting. The unstandardized coefficient for “Management Safety Priority” is -1.017, which means that if the management constantly looks the other way when someone is careless with safety, or when they keep accepting employees to take risks when the work schedule is tight, then the satisfaction with the work will drastically reduce. When safety is viewed as an inhibition or a hindrance to productive work, the company faces greatly elevated risk and a much higher chance for work accident. Therefore is needed a “healthy” balance between production and safety, and this should be done from the managers. Another is the situation for “Management Safety Justice” 1.591. This means that
27
when management collects accurate information in accident investigation and when they have clear procedures when someone is involved in accident and threat him fairly, this will increase the satisfaction of the employees with the work. They will be sure that their managers do not look for guilty persons, but for the causes, when an accident occurs. Other thing that the company has to consider is that all employees should have freedom to talk about safety, to discuss safety while they are working, with more simple words, to encourage all employees to speak between each other for safety at the work place. This will increase their satisfaction with the company. For now, coefficient “B” indicates very low level of satisfaction between peers and the level of their communication -1.740. As a conclusion, the satisfaction of all employees is related with all other variables, and is very important to understand that having a strong safety policy will satisfy all. Nevertheless, when managers are speaking about safety and working in accordance with their safety policy will build one very strong environment. Looking at Sig. value statistically significant coefficient is “WSafPeers” which is less than 0.05. In this case 0.033.
Table 10 Coefficientsa Model Unstandardized Coefficients Standardized Coefficients t Sig. B Std. Error Beta 1 (Constant) 4.926 .905 5.444 .000 Age .002 .026 .015 .085 .933 Sex -.321 .336 -.171 -.957 .345 2 (Constant) 13.366 6.490 2.060 .048 Age .031 .022 .218 1.417 .167 Sex .109 .305 .058 .356 .724 MSafPriority -1.017 .920 -.193 -1.106 .278 MSafEmp .965 .651 .240 1.482 .149 MSafJus 1.591 .653 .436 2.436 .021 MSafCom -.817 .757 -.179 -1.080 .289 WSafPrio -.679 .801 -.137 -.847 .404 WSafPeers -1.740 .777 -.358 -2.240 .033 WSafTrust -.829 .685 -.184 -1.209 .236
a. Dependent Variable: sat