RESEARCH ON THE FERTILITY OF
BULGARIAN WOMEN*
- Analysis of the statistical distribution of fertility rates by age group
T. KALOYANOV
University of National and World Economy Department of Statistics and Econometry
Abstract
The research on the dynamics of fertility for women in Bulgaria has been carried out through analyzing the distributions of the age-specifi c fertility rates. For this purpose we have used all four parameters of the statistical distribution - the arithmetic mean, the standard deviation, the coeffi cient of asymmetry and the coeffi cient of excess. The experimental research has been carried out as an aggregate for all children and separately for the fi rst, the second and the third birth-order.
Key words: Fertility, Age specifi c fertility rate, Distribution, Parameters of statistical distribution
***
According to the demographic transition theory, at the end of this process the fertility will stay at the level necessary for minimal population reproduction - approximately 2100 children per 1000 women. In fact, over the last decades the total fertility rate in many countries has fallen below 1.5 children.
Bulgaria is among the countries in which fertility has reached extremely low levels. This is especially true during the initial years of transition to market economy. The crisis in which the country found itself upset the natural course of the demographic transition and intensifi ed the negative consequences. To predict the population’s rate of reproduction has become a really diffi cult task. One of the major reasons for this is the fact that 1990 marked the beginning of a radical change of the social, economic, political and cultural structure of the country. After the critical years, the country is not going back to something old, familiar and well-known, but takes a totally new direction. Deep, radical changes have been taking place in our society and new types of relationship are taking over in all areas of life; these are bound to affect the reproductive
behaviour of women. Furthermore, the group of women in reproductive age has a new intake of women born at the beginning of the 1990ies whose value system is thought to be quite different from that of the previous generations. The new situation necessitates research approaches that will be able to better reveal the changes happening in the reproductive behaviour of women.
***
The total fertility rate is one of the indicators favoured by researchers Frejka and Sardon (2004, 2005, 2006, 2007). The information this measure provides is valuable, but, like all general methods of measuring, it does not reveal how its value has been formed (Hajnal (1947); Ni Bhrolchain (1992). In some cases this mechanism is of no interest and some of the researchers typically restrict their analyses to interpreting only the total fertility rate. When the purpose is to determine what changes occur in the reproductive behaviour of women from different generations, other instruments of analysis are needed. One of the possible approaches for performing such a task is to study the distributions of the age-specifi c fertility rates. Most often this is carried out by analyzing the differences and the dynamics of the average age of giving birth to a child - fi rst, second or third. The arithmetic mean is an important characteristic of the distribution, but it is insuffi cient for revealing the differences between the statistical distributions. We need to use the other parameters as well - the standard deviation and the asymmetry and excess coeffi cients, since they are essential characteristics of the statistical distribution. This, in the language of demography, means that they reveal important aspects of the reproductive behaviour of women. Penetrating into the mechanism of shaping women’s behaviour will help to fi nd suitable activities by which to reach specifi c purposes - to increase or decrease the levels of fertility.
DYNAMICS OF THE OVERALL DISTRIBUTIONS OF ALL LIVE BIRTHS
The distributions shown in Fig.1. can be divided into two parts. The
year the difference changes and grows steadily until 2008 by more than one (year). It is clear that the factor (factors) which had been dominant during the years before 1980 is decreasing its infl uence. Other factors may have appeared or conditions for their increased infl uence may be available. What has been said about the prospect of the average age is also valid for the variance. The differentiation among women old enough to give birth is increasing, which means that groups of women with different behaviour, and different value systems, have started to appear. It is obvious that the various groups of women are under the infl uence of different factors and they require specifi c treatment and measures for their reproductive behaviour.
Age-specifi c fertility rates for the women in Bulgaria - total, for all live-births during the period 1961 - 2008
Fig. 1
0,0 50,0 100,0 150,0 200,0 250,0
10-14 15-19 20-24 25-29 30-34 35-39 40-44 45-49
1961 1965 1970 1975 1980 1985 1990 1995 1997 2000 2005 2006 2007 2008
‰
between women as regards the method of their reproduction. The value of the fourth parameter - the excess coeffi cient - also supports the growing differences. The fl uctuation in the value of the changes is evident for this measurе, too. It is typical for the distributions that, despite the course towards change, 1980 marks the peak in the excess coeffi cient - 1.18. This means that, on the whole, the women follow the same model of behaviour - giving birth at a relatively younger age as a result of the stronger impact of one or several different factors. With positive excess there should be greater concentration of women around the centre of distribution, which, in this case, is the particular average age. A relatively smaller part of the women gives birth younger or older. 1980 marks a turning point. On the one hand the distributions come close to the symmetrical; on the other - the excess goes through a zero value and becomes negative, showing a tendency toward greater “over-spreading. What does this mean? The symmetry, combined with a greater degree of spreading and a negative excess, is an indication for greater disparity in the behaviour of women, the infl uence of more and diverse factors, different models of reproduction in the set which is being studied. As can be seen in Fig.1, these changes are due to the decrease of the fertility for women in the younger age groups -15-19 and 20-24 and the increase in fertility for women in the older age groups of 25-29 and 30-34. When speaking of increase in the level of fertility, the following should be taken into consideration: for both groups the increase is against the very low level reached in 1997. For the fi rst group, i.e. for ages 25-29 the level in 2008 is higher than that over the years after 1990 and is lower than the corresponding levels during all other years of the period under research. The fertility level for the second group, the one for ages 30-34, is the highest level reached during the whole period. The value of the fertility rate is 60.8‰, which is one of the reasons for the decrease of the asymmetry and the negative excess. The closest value for this age-range - 56.1‰,- reached in 2007 is followed by 52.2‰ for 2006 , and 52.1‰ reached in 1961.
Parameters of the distribution of the age-specifi c fertility rates for the women in Bulgaria - total, for all live-born children between 1961 and 2008
Table 1 Year Parameters Average age in years Stand. Deviation In years Asymmetry coeffi cient
Excess coeffi cient
1961 24,62 5,61 0,82 0,69
1965 24,38 5,51 0,86 0,83
1970 24,16 5,24 0,79 0,72
1975 23,96 5,09 0,80 0,85
1980 23,39 4,95 0,90 1,18
1985 23,48 4,99 0,78 0,76
1990 23,44 5,05 0,82 0,84
1995 23,62 5,30 0,70 0,51
1997 23,91 5,43 0,65 0,38
2000 24,47 5,53 0,50 0,07
2005 25,51 5,78 0,26 -0,32
2006 25,65 5,84 0,23 -0,38
2007 25,84 5,97 0,20 -0,41
2008 25,94 6,06 0,18 -0,45
Parameters of the distributions of the age-specifi c fertility rates for women in Bulgaria - overall for all live-births in 1961 and 2008
Fig. 2
10 100%
50 0
0
30 100 %
-2,4 2,4%
2,4
-2,4 10
20 40
0,6 -0,6 1,2 -1,2
V
P 3,0%50 60 70 80 90 20 30 40 60 0 70 90 1,8 0,6 -0,6 -1,8 -3,0 E
-1,8 -1,2 1,2 1,8 -3,0%
Ⱥ
80 2008
A general idea about the changes of the parameters of the distributions can be obtained from the diagram in Figure 2. It is drawn on the basis of the values of all four parameters, where these values are converted into percentages so that comparative analyses can be carried out. The diagram shows the rectangles of the fi rst and the last years of the study period. The lengths of two of the sides are growing, and these of the other two are diminishing. The
fi rst side, whose value is increasing, is the one connecting the average age and the standard deviation. This is the result of the increasing values of the two parameters. In each particular case this increase can have positive or negative consequences for the birthrate. They will be positive if the average age goes up as a result of more births of children in a higher order - second, third, fourth. On the contrary, they will be negative if the reason for the higher average age is a tendency of giving birth to a fi rst and second child respectively at an older age. As a rule, this leads to a decrease in the family size, which is the case in our country. A more precise answer could be given if the analysis is performed by orders. The same should be said about the standard deviation. If the increase in its value is due to an increase in births of a higher order and at a later age, this will have a positive effect on the level of fertility as a whole. However, in reality this is not so. The higher level of dispersion combined with almost asymmetrical distributions and a negative excess is due to decreasing levels of fertility within the lower age ranges: increasing levels of fertility within the higher age ranges - 25 -29 and 30-34 over the last several years, i.e., 2006, 2007 and 2008. As shall be seen in the analysis later on, this increase is due to fi rst- and second-order births which, prior to 2000, occurred at a younger age.
The length of the side connecting the standard deviation and the coeffi cient of asymmetry in 2008 is smaller than the respective one for 1961. This is a result of a growing variance and its getting close to the normal distribution. As explained above, within the context of the phenomenon under study, i.e. fertility, this cannot be evaluated as positive because of the manner in which these changes happen - through reduction of the level of fertility as a whole, not through an increase of fertility in all age groups at once.
group needs a specifi c approach and policy of infl uence. Individual groups react differently to the same infl uences. All this requires taking into consideration the circumstances, personalities, value systems and attitudes of each respective group of women.
The length of the side connecting the coeffi cient of excess and the average age is getting smaller. This can be interpreted as a sign of worsening of the situation as far as fertility is concerned. The older age for giving birth to a child, especially a child of a lower order, combined with “over-spreading” for women with lower level of fertility can be taken as a sign of the formation of a new, un-homogenous society with new attitudes towards the family unit and the model of reproduction.
A broad picture of the aggregate changes in the values of the four parameters of the statistical distribution can be obtained from the areas of the rectangles. In 1961 they are 44.10% of the total area of the square (which is 100%), and in 2008 the respective area is 47.23%, i.e. there is an increase of 3.13%. As pointed above, each of the parameters participates differently in the modifi cation of the area of the rectangle. The contribution of each order for the shaping of the respective modifi cation will be argued further in the paper
DYNAMICS OF THE DISTRIBUTIONS FOR A FIRST LIVE-BORN CHILD
The diagramme shown in Fig. 3. reveals some peculiarities in the distributions of the age-specifi c fertility rates for women having a fi rst child. The fi rst peculiarity is related to the maximum value of the rate. It is recorded in 1970 for women in the 20-24 years age range. The year of the peak is not accidental. Only two years have elapsed since the introduction of the measures aimed to encourage birthrate and they are bearing fruit. The age range for which the peak is registered is most naturally 20-24. It turns out that prior to 1990 (including 1990) the fertility level within this age range is relatively high - around 90‰. The sharp fall is registered during the following years of transition to market economy.
The next peculiarity is related to the distributions in the years 1995 and 2000. These are transitional distributions within which two segments can be established. In the fi rst segment they are near each other for the younger age groups of 10-14, 15-19 and 20-24, and come close to the distributions than they do in the following years - from 1997 to 2000. For the older age groups the two distributions diverge: the one for 1995 follows the model of the distribution prior to 1990 and the fertility levels almost overlap. At the same time what can be said about the distribution of 2000 is that it prepares the transition towards a new behaviour model. The values of the age-specifi c rates are located between ‘the old” and “the new” reproduction model - in Fig. 3. The old model’s distinctive feature is lower fertility in the older age range, while exactly the opposite is true for the new model - higher birthrate at an older age.
The fourth peculiarity refers to the distributions in the period after 2000. For these what is characteristic is almost half the modal value and lower fertility at a younger age and higher fertility in the over 24 age groups.
Age-specifi c fertility rates for the women in Bulgaria for a fi rst live-birth in the period 1961-2008
Fig. 3
0,0 20,0 40,0 60,0 80,0 100,0 120,0
10-14 15-19 20-24 25-29 30-34 35-39 40-44 45-49
‰
1961
1965
1970
1975
1980
1985
1990
1995
1997
2000
2005
2006
2007
2008
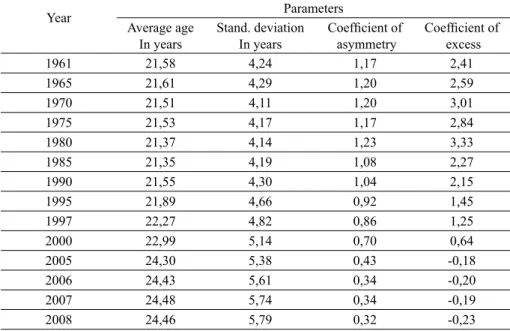
increase of the average age. The absolute growth of its value over the whole period under study from 1961 to 2008 is 2.8 years. As can be seen in table 2, the changes in the values of this parameter vary - there are both periods of rising and periods of falling. The lowest level is registered in 1985 - it is 21.35. This fact can hardly be explained by the infl uence of the Decree from 1968. It is more likely that the birth of a fi rst child at a relatively early age is determined by the existing conditions in the country. For instance, to be able to buy a home the family had to have a child; the size/area of the home also depended on the size of the family. At that time there were other material and non-material conditions which, to a different extent, stimulated the birth of a child. The “contribution” of the transition period after 1990 to the average age of having a fi rst child should, on the whole, be considered generally negative. Data shows that for merely 18 years the average age has increased from 21.55 in 1990 to 24.46 in 2008, which is a 2.91 growth. The scale of this growth is bigger than that commented above concerning the whole period (1961-2008) under study. Clearly, the trend has changed its direction as a result of the change in the model of reproduction as regards the size of the family and the age for giving birth to a fi rst child. The increase in the average age is the result of a doulble-sided process. On the one hand, there is a fall in the level of fertility for the younger age ranges, especially that from 20-24; on the other, there is a rise for the older age-ranges. The increase of the age at which women have a fi rst child leads to giving birth to a second child later in life at an older age and often to not having a second child at all. While the increase of the age for a fi rst birth prior to 2002-2003 can be explained by births delayed and deferred from the end of the twentieth century. The persistence of this tendency over the last years of the research period supports the hypothesis that serious changes in the reproductive behaviour of women in our country are under way. Naturally, these tendencies are defi ned by the impact of a number of factors on the value system of the contemporary family.
child-bearing age according to how they build their families is still ongoing, i.e. it has not ended yet.
What does the dynamics of the values and of the coeffi cients of excess and of asymmetry in Table 2. reveal? The distributions prior to 1990 have a characteristic moderate right-slanted positive asymmetry. This results from a clustering of the births around the centre of the distribution, a very acute left shoulder and a relatively little number of fi rst-child births at an older age. There is an over-concentration of births within one age interval, evidence for which are the rather high values of the coeffi cients of excess - 3.01 in 1970 and the maximum of 3.33 in 1980. In the years after that the trend is reversed, very pronounced after 1990. The distributions become almost symmetrical due to the change in both shoulders - the left already shows a less signifi cant tilt, and the right shoulder is more heavy and shows a more gradual decrease of the fertility in the age-ranges 25-29 and 30-34.
As a result of the changes at the apex - a substantial fall, becoming more gradual, and the changes at the tails of the distributions- we observe a change in the value of the coeffi cient of excess. During the last four years of the research - 2005, 2006, 2007, and 2008 - this coeffi cient is already negative; this fact means “over-spreading’ of women in relation to the respective normal distribution. When analyzing the standard deviation we have expressed the opinion that the differentiation in the set is still continuing and there are no signs for its completion.
The values of the last two measures - the coeffi cients of asymmetry and of excess for 2006, 2007 and 2008 are beginning to fl uctuate around one value - 0.34 for the former and around 0.19 for the latter. There are good reasons to believe that because of their construction these measures are more sensitive, so they detect the advancing changes. In this case their stability can be seen as a signal that the process of differentiation of the set under research has almost concluded. Most probably the various groups of women have already been established, each with its own model of reproduction. What can be expected is to have various corrections to the direction, which will result in some fl uctuation. It seems that, in general, the distribution of the age-specifi c fertility rates for a fi rst birth has most probably come to its fi nal stage. If it stays like this for a longer term, the prospects for the reproduction of our population will not be optimistic. The reasons for this conclusion are the following:
-the birth of a fi rst child at an older age restricts the likelihood of giving birth to a second child;
-the presence of considerable differentiation in the set of women means it will be more diffi cult to return to a higher level of fertility and more diffi cult for the government to carry out its pro-natal policy.
Parameters of the distribution of the age-specifi c fertility rates for women in the Republic of Bulgaria for a fi rst live-birth between 1961 and 2008
Table 2
Year Parameters
Average age In years
Stand. deviation In years
Coeffi cient of asymmetry
Coeffi cient of excess
1961 21,58 4,24 1,17 2,41
1965 21,61 4,29 1,20 2,59
1970 21,51 4,11 1,20 3,01
1975 21,53 4,17 1,17 2,84
1980 21,37 4,14 1,23 3,33
1985 21,35 4,19 1,08 2,27
1990 21,55 4,30 1,04 2,15
1995 21,89 4,66 0,92 1,45
1997 22,27 4,82 0,86 1,25
2000 22,99 5,14 0,70 0,64
2005 24,30 5,38 0,43 -0,18
2006 24,43 5,61 0,34 -0,20
2007 24,48 5,74 0,34 -0,19
2008 24,46 5,79 0,32 -0,23
born child should be viewed as rather unfavourable for the reproduction of the population. The excess coeffi cient proves to be the most sensitive measure of the undergoing changes. The reason for this high sensitivity is its construction which hugely intensifi es the changes in the differences and in the behaviour of women respectively. The absolute magnitude of the difference between its maximum and minimal value is 3.15 and is close to the one for the average age – 3.13 years. In this case it should be noted that the excess coeffi cient is expressed in units of standard deviation while the average age is expressed in years and they cannot be compared directly.
Parameters of the distributions of the age-specifi c fertility rates for women in the Republic of Bulgaria for a fi rst live-birth in 1961 and 2008
Fig.4
10 100%
50 0
0
30 100%
-2,4 2,4%
2,4
-2,4 10
20 40
0,6 -0,6
1,2
-1,2
V
P
3,0%
50 60 70 80 90
20 30 40 60
0 70 90
1,8
0,6
-0,6
-1,8
-3,0
E
-1,8 -1,2 1,2 1,8
-3,0%
Ⱥ
80 2008
1961
age but also a decrease in the general level of fertility. This is refl ected in the diagram by a signifi cant elongation of the side connecting the values of the two coeffi cients.
The shortening of the side connecting the excess coeffi cient and the average age is the result of two negative changes – a decline in fertility level and an increase in the age of giving birth to a fi rst child. The increase in the areas at the shoulders fi ts perfectly in the defi nition of excess given by Balanda and MacGillivray (1988; 111) as “free from its place and scale movement of the probability mass from the shoulders of the distributions”. But the levelling of the peak in this particular case results in a sharp decline in the general level of fertility and shows the existence of a process of differentiations of the units of the total set under research.
The area of the fi rst rectangle is 33.92%, of the second 47.70%, which is an increase of 13.82%. The difference established in the previous analysis about all live births amounts to 3.13%. The comparative analysis also shows that while the area of the rectangles in 1961 differs signifi cantly – for all live births it is 44.1%, and for the fi rst child – 33.92%, in 2008 the areas are very close in size. For all these children the area is 47.23%, and for the fi rst child – 47.70%. The conclusion that can be drawn is that the model of giving birth to a fi rst child determines to a signifi cant extent the general model of fertility in the country. This fact can be explained with the tendency of establishing an only child family model in our country in recent years which is confi rmed by the changes in the relative share of life births in a sequence of births. During the last year of the period studied, 2008, the relative share of live births of the fi rst order among all live births is 56.38%, and those of the second order 31.40%, and of the third only 6.03%. In comparison, in 1961 these shares are as follows: for a fi rst child 42.50%, for a second child 36.56% and for a third child – 10.11%. As can be seen the proportion of fi rst children signifi cantly increases while the proportions of the other two decrease, for a second child by 5.16 points, and for a third chid by 4,08 points.
DYNAMICS OF THE DISTRIBUTIONS OF SECOND LIVE-BIRTHS
order was reached in 1975 which is perfectly reasonable. The measures for encouraging birth rate, adopted in 1968, had their initial effect on the birth of a
fi rst child. With a certain lag women who have a fi rst child also give birth to a second child and a period of 3 to 5 years is necessary for this.
Very interesting is the behaviour of women at the age of 25-29. As can be seen in Fig.5 the interval within which the values of the fertility rate for the period 1961-1990 are very broad – from 42.6 to 66.8‰. This once again confi rms the hypothesis of the greater sensitivity of women when deciding to have their second child.
In the analysis of Diagrams 2, 3 and 4, which can be seen in Fig. 6 as well, a very important characteristic is established. As was mentioned previously, the lowest level of fertility in our country was reached in 1997. The biggest decrease in size and signifi cance regarding the reproduction of the population was registered in the period 1990-1997. Its signifi cance is determined by the fact that this decrease concerns predominantly the age groups 20-24 and 25-29. In fact, this period sets the stage for the transition to another model of reproductive behaviour whose formation starts in the following 2-3 years. There comes the question „Will at least a small portion of the gap between the values for 1990 and 1997 be fi lled?” The answer is “probably yes”, but expectations should not be too high. It can be said that if the conditions in the country had not deteriorated so rapidly in 1996 and 1997 fertility would have settled at the level reached during the period 1990-1995. This is confi rmed by the fact that for the age group 20-24 years the decrease continues until 2006 when it bounces back to the level reached in 2005 and in the following years it fl uctuates within very narrow margins. Similar is the situation with the age group of 25-29 year-olds where the decrease continues until 2005. In the following three years the value of the coeffi cient increases.
Somewhat different are the changes for women in the age group 30-34 years. After reaching the minimum in 1995 and maintaining this level in 1997, the value of the fertility rate begins to grow – Fig.5. Why do these women have a different behaviour? Are they not affected by the changes in the conditions in the country? Obviously, they are also affected by the changes and this is refl ected in the measure applied, but these women have no time to postpone the birth of a second child. The part of these women who seriously want to have two children ignore the living conditions, because in a few years’ time they would not be able to give birth to a second child. Or at least they are fully aware of the greater the risks that such late pregnancy and birth entail.
interval is 20-24 years. For the past years it is in the age range of 25-29, followed by the age range of 30-34 years, which is extremely important. This importance comes from the fact that the likelihood of deciding not to have a second child after reaching a relatively advanced age such as 34-35 years is growing.
Age-specifi c fertility rates for women in the Republic of Bulgaria for a second live birth in the period 1961-2008
Fig. 5
0,0 10,0 20,0 30,0 40,0 50,0 60,0 70,0 80,0 90,0
10-14 15-19 20-24 25-29 30-34 35-39 40-44 45-49
‰
1961
1965
1970
1975
1980
1985
1990
1995
1997
2000
2005
2006
2007
2008
question the following two circumstances should be taken into account: - the increased average age is partly due to the fact that delayed births of a second child are taking place , and should come to an end soon. It can be expected that this factor will soon stop to contribute to the increase of the average age;
- the increase of the average age of giving birth to a second child should have its biological limit, which, when reached, will stop the increase.
It is logical to expect the increase of the average age for the birth of a second child to come to an end, but mentioning any value is too risky.
Unlike the values of the mean, those of the standard deviation increase almost constantly. Everything else being equal, this can be viewed as positive if it wasn’t for the fact that the growing disparities between women as regards their reproductive behaviour is registered in a highly decreasing fertility, which is a negative phenomenon. While in terms of the average age the measures adopted for encouraging the birth-rate have led to a fall in the mean, such a change is not observed in the standard deviation. The most probable reason is the slight increase of fertility in 1970 and 1975 among women at the age groups 25-29 and 30-34. The subsequent growth in the differences refl ects the reaction of women to the changing living conditions in our country.
react to giving birth to a fi rst child they react to the changing conditions and to giving birth to a second child. Distributions become not only symmetrical, but their peak becomes lower, there are re-distributions along the shoulders and the result is a negative excess. The left shoulder is a little more acute and the right one more oblique. This process of re-distributions develops in a more varied manner than the one for the fi rst child. In fact the process of re-distribution is an expression of the ongoing differentiation of women, the formation of various groups with their own behaviour and attitude to having a second child. The negative excess is a sign that the role of the dominating factor(s), which presumes a well defi ned modal interval, has already been lost, thus manifesting the unifi ed behaviour of women. At the same time it shows that there are reserves for increasing the level of fertility up to the present „leader” – the age range 20-24 years. The reasons for such assumptions are the extremely low values of the age-specifi c fertility rate during the last years – around 19‰. This reserve might be utilized only if these women have their fi rst child at a younger age – around their 20s. The distributions for 2008 give reasons for some optimism, albeit slight. These reasons can be found in the slight rise in the left shoulder for the age group 34-39, which shows the existence of a tendency in Bulgarian for women to give birth to their second child later in life after certain conditions are met.
Parameters of distributions of the age-specifi c fertility rates of women in the Republic of Bulgaria for a second live birth in the period 1961-2008
Table 3
Years Parameters
Average age In years
Standard deviation In years
Asymmetry coeffi cient
Excess coeffi cient
1961 25,37 4,39 0,61 0,61
1965 25,26 4,48 0,68 0,65
1970 25,20 4,48 0,57 0,42
1975 25,05 4,47 0,61 0,59
1980 24,52 4,44 0,72 0,84
1985 24,62 4,49 0,63 0,56
1990 24,62 4,64 0,65 0,57
1995 24,95 4,90 0,46 0,25
1997 25,40 5,00 0,34 0,01
2000 25,90 5,13 0,23 -0,16
2005 27,05 5,49 0,04 -0,42
2006 27,16 5,62 -0,02 -0,53
2007 27,43 5,66 -0,05 -0,53
The diagram in Fig. 6 clearly shows the changes which took place in the distributions of the age-specifi c fertility rates of women giving birth to a second child in the period from 1961 to 2008. Compared with the diagram for a fi rst child, the scope of the changes here is smaller. The difference in the area of the two rectangles is 4.52%, whereas for the fi rst child it is 13.82%, i.e. it is three times as big. The explanation for the greater difference is probably in the women’s reaction to the changing conditions, especially of the younger women – to postpone, wait for improvement of the conditions to give birth. One more factor should be taken into consideration. At the time of crisis and serious transformations which are taking place in our society, stating a family is also delayed, which leads to the delay of the birth of the fi rst child. The family already exists when the second child comes, the fi rst child is already born, and the choice is whether to have another child or not.
Parameters of distributions of the age-specifi c fertility rates for women in the Republic of Bulgaria for a second live birth in 1961 and 2008.
Fig.6
10 100%
50 0
0
30 100%
-2,4 2,4%
2,4
-2,4 10
20 40
0,6 -0,6
1,2
-1,2
P
3,0%
50 60 70 80 90
20 30 40 60
0 70 90
1,8
0,6
-0,6
-1,8
-3,0
E
-1,8 -1,2 1,2 1,8
-3,0%
Ⱥ
80 2008
1961
The combination of increasing dispersion with the decreasing asymmetry leads to the contrary, shortening of the side connecting them. Especially interesting is the decreasing asymmetry and the transition from an acute to obtuse excess. This is so due to the fact that , everything else being equal, a symmetrical distribution shall mean more comprehensive use of the existing resource. But the negative excess means that this resource is used at a much lower level and a great part of its potential remains unutilised. Having in mind the nature of the phenomenon under research, the question of its comprehensive use becomes especially „painful” in all its aspects – economic, social, cultural, etc. The negative excess is the sign which clearly shows the change in the model of child birth. This has been established for the fi rst and the second child.
DYNAMICS OF THE DISTRIBUTIONS OF A THIRTH LIVE BIRTH
Low and extremely low fertility as regards a third child - thus can be described the situation at the beginning and the end of the period studied – 1961 and 2008. The fertility rate in the modal interval 25-29 is 18.2‰ and 4.7‰. This level has been reached after the “correction” resulting from the Decree of 1968 was accomplished, which interrupted the tendency for decline in the level of fertility – Fig.7. Analogous are the changes in all other age ranges, but the possible variations are smaller because of the very low values of the fertility rates.
One of the most important changes is related to the change of the modal interval. Prior to 1975 this is the group of women at the age of 25 - 29, but after this year the modal interval becomes 20-24 years and this is preserved until 2008. The most probable reason for this shift is that primarily women from some minority groups are inclined to have a third child, especially in recent years. As a rule, they start to have children at an early age – around 16-17 and have the possibility to give birth to a third child before they reach the age of 20-24 years. Supporting this assumption is the fact that in the period from 2005 to 2008 only a slight increase is registered compared to the level for 2000 for women aged 30-34 and 35-39. This can be due to the decision of a small proportion of Bulgarian women to have a third child. But it should also be noted that the observed changes are extremely small.
Age-specifi c fertility rates for women in the Republic of Bulgaria for a third live birth from 1961-2008
Fig.7
0,0 5,0 10,0 15,0 20,0 25,0
10-14 15-19 20-24 25-29 30-34 35-39 40-44 45-49
‰
1961
1965 1970 1975
1980 1985 1990 1995
1997 2000 2005
2006 2007 2008
slightly positively asymmetrical becomes almost symmetrical. This change is due to the changes of the slant of both shoulders. They are already very acute with a slight dip defi ned by the extremely low values of the age-related fertility rate in all age ranges. Women in the age ranges 20-24, 25-29 and 30-34 years contribute primarily to this asymmetry. These are the intervals whose changes defi ne the transition from acute to negative excess. The negative excess means that while at the beginning of the period under research there is one factor or more factors which infl uence a certain concentration and relatively unifi ed behaviour of women regarding the birth of a third child, over time the impact of these factors rapidly decreases. As can be seen in Fig. 7 the differences in the values of the age-related fertility rates in 2008 for the age ranges from 20 to 34 years fl uctuate from 3.9 to 5.0‰. This means that in this case the “age” factor does not play any role.
Parameters of distributions of the age-specifi c fertility rates for women in the Republic of Bulgaria for a third live birth in the period 1961-2008
Table 4
Years Parameters
Average age In years
Standard deviation In years
Asymmetry coeffi cient.
Excess coeffi cient
1961 27,31 4,92 0,60 0,30
1965 26,98 4,82 0,63 0,35
1970 27,07 4,86 0,52 0,25
1975 26,61 4,93 0,57 0,27
1980 26,11 4,97 0,63 0,34
1985 26,22 5,09 0,58 0,20
1990 26,25 5,42 0,58 -0,02
1995 26,46 5,64 0,57 0,03
1997 27,05 5,86 0,46 -0,32
2000 26,96 5,69 0,49 -0,20
2005 27,34 5,96 0,32 -0,56
2006 27,31 5,98 0,36 -0,50
2007 27,44 6,20 0,33 -0,55
Parameters of distributions of the age-specifi c fertility rates for women in the Republic of Bulgaria for a third live birth in 1961 and 2008
Fig.8
10 100%
50 0
0
30 100%
-2,4 2,4%
2,4
-2,4 10
20 40
0,6 -0,6
1,2
-1,2
V
P
3,0%
50 60 70 80 90
20 30 40 60
0 70 90
1,8
0,6
-0,6
-1,8
-3,0
E
-1,8 -1,2 1,2 1,8
-3,0%
Ⱥ
80
2008
1961
confi rmed. In practice, there is not only a delay in giving birth to a second and a third child, but they are, in effect, never born. This applies to a much greater extent to the third child.
The changes in distributions and the values of their parameters respectively show that having a third child is not very popular with the Bulgarian family. There are almost no factors which can motivate women to give birth to a third chid. This can be the objective of Bulgarian society for the distant future. Now efforts should be made to encourage the birth of a fi rst and second child where there have been signifi cant “foregone benefi ts”. These have already had their impact and it will be felt even more signifi cantly in the coming decades in all possible aspects of our social and economic life.
REFERENCES
- CAMBELL R. HARVEY, JOHN C. LIECHTY, MERRILL W. LIECHTY and PETER MULLER. (2004): ”Portfolio Selection With Higher Moments”, SSRN, Electronic Paper Collection, December 13, p.5.
- FREJKA, T. and JEAN-PAUL SARDON. ( 2004): Childbearing Trends and Prospects in Low-Fertility countries: A cohort analysis, Dorbrecht: Kluwer Academic Publishers, 2004.
- FREJKA, T. and JEAN-PAUL SARDON. (2005): “The direction of contemporary fertility trends in the developed countries: Further decline, plateau or upswing?” Proceedings of the XXV IUSSP International Conference, Tours, France.
- FREJKA, T. and JEAN-PAUL SARDON. (2006): “First birth trends in developed countries: A cohort analysis,” Max Planck Institute for Demographic Research Working Paper, WP-2006-14.
- FREJKA, T. and JEAN-PAUL SARDON. (2007): Cohort birth order, parity ratio and parity distribution in developed countries. Demographic Research, Max Planck Institute for Demographic Research, Vol. 16, Article 11, Pages 315-374, 27 April 2007.
- WILLIAMS, J. and IOANIDIS, C. (2002):Higher Moments, Utility Functions and Asset Allocation, University of Bath.
- NI BHROLCHAIN, M. (1992): “Period paramount? A critique of the cohort approach to fertility”, Population and Development Review 18: 599-629.
- KALOYANOV, T. (2008): A possibility for a graphic representation of the inter-relations among the parameters of statistical distributions. Economic Thought. Bulgarian Academy of Sciences, 99-118.