ORIGINAL ARTICLE
Associations among milk production traits
and glycosylated haemoglobin in dairy cattle; importance
of lactose synthesis potential
Homayon Reza Shahbazkia&Mahmoud Aminlari&
Atoosa Tavasoli&Ahmad Reza Mohamadnia&
Alfredo Cravador
Accepted: 2 October 2009 / Published online: 23 October 2009
# Springer Science + Business Media B.V. 2009
Abstract Glucose is the major precursor of lactose synthesis in the mammary gland. Lactose the major carbohydrate and osmolyte of milk, controls milk volume and its concentration. Glycosylated haemoglobin (HbG) is a retrospective measure of mean blood glucose level and it is largely unaffected by recent physiological conditions and environmental events. The purposes of this study were to determine the correlations between lactose traits and other milk production traits in dairy cattle and to investigate whether HbG level can be correlated with milk and lactose production traits. Here, HbG percentage, milk and lactose production traits including milk yield, lactose, protein, SNF, total solid and fat percentages and yields were measured in 485 second calved Iranian Holstein cattle. Statistically significant negative correlations were established between HbG
and milk yield (r=−0.88), lactose yield (r=−0.83), SNF yield (r=−0.81), protein yield
(r=−0.79) and total solid yield (r=−0.74). Positive correlations were established between
lactose yield and milk (r=0.96), protein (r=0.81), SNF (r=0.92) and total solid (r=0.79) yields. The negative correlation between HbG and milk and total lactose production is
DOI 10.1007/s11259-009-9324-2
H. R. Shahbazkia
:
A. Tavasoli:
A. CravadorFaculdade de Ciencias e Tecnologia (FCT), Universidade do Algarve, Campus de Gambelas, 8005-139 Faro, Portugal
H. R. Shahbazkia (*)
Department of Biochemistry, Faculty of Veterinary Medicine, Shahrekord University, Shahrekord 115, Iran
e-mail: shahbazkia-hr@vet.sku.ac.ir e-mail: shahbazkia@yahoo.com M. Aminlari
Department of Biochemistry, School of Veterinary Medicine, Shiraz University, 71345 Shiraz, Iran A. R. Mohamadnia
Department of Clinical Sciences, School of Veterinary Medicine, Shahrekord University, 115 Shahrekord, Iran
A. Cravador
IBB/CGB-UTAD Apartado 10103, Vila Real 5001, Portugal
Mohamadnia, Ahmad Reza; Cravador, Alfredo. Associations among milk
production traits and glycosylated haemoglobin in dairy cattle: importance of
lactose synthesis potential. Veterinary Research Communications, 34, 1,
1-9, 2010.
probably related to the higher glucose demands in the lactating mammary gland of more productive cows. The positive correlation between lactose yield and milk, protein, SNF and total solid yield indicates that the level of lactose synthesis influences milk production traits in ways other than merely via its osmolytic action.
Keywords Glycosylated haemoglobin . Milk production traits . Lactose synthesis . Dairy cattle
Introduction
Lactose, the major carbohydrate of milk, controls milk volume by maintaining its osmolarity. Therefore, the rate of lactose synthesis in the epithelial cells of the mammary
gland serves as a major factor influencing milk volume (Cant et al. 2002; Neville et al.
1983; Zhao and Keating 2007). Glucose is the main precursor of lactose synthesis in
mammary gland epithelial cells (Neville et al.1983). However; a lactating mammary gland
cannot synthesize glucose from other precursors due to the absence of
glucose-6-phosphatase (Threadgold and Kuhn 1979) and so is dependent on the blood supply for
its glucose requirement. Mammary glucose uptake, which is performed by both active and
passive transport processes (Zhao et al.1999,2005), is independent of the concentration of
glucose and insulin in the arterial blood during lactation. It has also been suggested that the blood glucose concentration affects the rate of synthesis of milk lactose, hence milk volume
by osmotic association (Kronfeld 1982). A negative correlation has been demonstrated
between milk production and plasma glucose concentration (Jenny et al. 1974) and
genetically superior cows which have high milk yields maintain a relatively low plasma
glucose level (Snijders et al. 2001). The general consensus at present is that lactose acts
primarily as an osmolyte in milk, so that the effect of increasing lactose synthesis is to draw more water into the milk. Thus, the higher the synthesis of lactose, the greater the volume of milk produced. The effect of this process is to leave the total amount of other milk constituents such as proteins and solids unchanged. Therefore, although milk yield is increased, concentration of its constituents is decreased. A negative correlation has been also reported between milk yield and milk composition in sheep (Flamant and Morand-Fehr
1982; Barillet et al.1986; Casu and Sanna1990). This relationship applies not only to the
more productive breeds when compared with the less productive breeds (Flamant and
Morand-Fehr1982; Casu and Sanna1990), but also within a flock, to those animals that
produce more milk (Barillet et al.1986), and even to an animal producing at different levels
throughout its lactation period (Casoli et al.1989; Pulina1990). This relationship has been
generally attributed to the fact that milk volume is determined by lactose secretion and in highly productive dairy animals the synthesis of fat and protein (and therefore total solids) does not keep up with that of lactose when high rates of milk secretion are achieved
(Bencini and Pulina1997; Holmes and Wilson1984).
The level of glycosylated haemoglobin (HbG) has been used in humans and some
domestic animals as a stable indicator of glucose status (Gabbay et al.1977; Jovanovic and
Peterson 1981; Shahbazkia and Nazifi 2008a,b). The HbG level represents a measure of
mean blood glucose level over the previous several weeks and is largely unaffected by recent stress events, or the nutritional or physiological condition experienced by the animal
(Latimer et al.2003). As such, it offers a better indicator of glucose status than other tests.
al.1990; Alayash and Wilson1987; Alayash et al.1988; Ardia2006; Elliott et al.1997;
Jenks et al. 1991; Loste and Marca 2001; Richter 1986; Shahbazkia and Nazifi 2005;
Shahbazkia and Nazifi2008a,b), the relationship of HbG to milk production traits in dairy
cattle has not been explored to date.
The aims of this study were to determine the correlations between lactose traits and the other milk production traits in dairy cattle to study the importance of lactose synthesis potential and to investigate whether HbG level can be correlated with milk and lactose production traits.
Materials and methods
Animal selection, milk production records and milk analysis
A sample of 485 second-calved Holsteins cows was randomly selected from a herd of 4500 cows on a major Iranian dairy farm. All selected cattle were raised under the same nutritional, environmental and management conditions. The animals were kept in free-stall housing, and the calving season was from February to March. Prepartum cows in the
transition period (3–4 weeks before parturition) were housed in a separated dry lot. All diets
were based on alfalfa, corn silage, and a combination of concentrates including corn, soya meal, and bone meal. Health, fertility and production records were maintained on all animals. The mean productive values of first calved cattle of the farm were as follows: milk yield 10195.9±1809.7 l; fat yield 220.1±79.6 kg; protein yield 300.2±52.2 kg; lactose yield 460.95±83.6 kg; Total solid yield 1188.7±229.5 kg; fat% 2.19±0.76; protein% 2.96± 0.24; lactose% 4.52±0.23; total solid% 11.72±1.09.
Official milking records taken between 2006 and 2007, covering 485 lactations were used to supply the monthly production of each cow until the end of its lactation period, and these were converted to an equivalent 305 day milk production. After parturition and the initiation of the lactation period, a milk sample was obtained from each animal every month until the end of its lactation period. The first sample was obtained at least 15 days after parturition to exclude any bias related to the presence of colostrum. As the animals were milked three times daily, errors related to the influence of milking time on milk composition were avoided by bulking a 10 ml sample from each of the three milking sessions.
Milk composition (milk fat, protein, lactose, urea, SNF (solid not fat) and TS (total solid)) was determined by a Milko Scan 4000 (Foss, USA) automatic milk analyser. The total production of each milk constituent was calculated by extrapolating its mean relative content over the 305 day milk production period.
Blood sampling and HbG determination
Peripheral whole blood samples (5 ml) were collected at the peak of the lactations from the jugular vein into a vacuum plastic tube containing citrate as an anticoagulant. The samples were immediately placed on ice water and transferred to the laboratory. Sample processing last less than 1 h until analysis was performed without interruption. HbG was measured by the same cation exchange chromatography method used in previous investigations
(Shahbazkia and Nazifi 2005; Shahbazkia and Nazifi 2008a,b). To validate the method,
human HbG level was determined and this delivered results within the expected range
The samples were centrifuged at 2,000×g for 15 min. Erythrocytes were incubated for 30 min at 37°C in a volume of normal saline (0.9% w/v NaCl in distilled water) equal to that of the removed plasma to dissolve any labile glucose adducts (pre-glycosylated Hbs), and then the sample was re-centrifuged at 2,000×g for 10 min. Two volumes of cold water were added to lyse the erythrocytes, and the cell debris was removed by centrifugation (15 min at 2,000×g). The haemolysate was removed and processed
according to Peterson et al. (1998). For the determination of HbG, a volume of prepared
haemolysate was mixed with an equal volume of phosphate buffer (10 mM, pH 6.2), of
which 100 μl was loaded onto a chromatography column (1×5 cm) packed with
CM-Sephadex cation exchange resin. The mobile phase was a 10–95 mM linear gradient of phosphate buffer (pH 6.2). The Hb concentration in the chromatography fractions and haemolysate was determined using light absorbance at 415 nm. For the in vitro glycosylation of Hb, haemolysate was incubated in 10 mmol D-glucose solution for 96 h at room temperature. The HbG level of the in vitro glycosylated sample was determined as described above. As HbG is less positively charged than Hb, it elutes earlier. To confirm that the faster running peak was indeed HbG, in vitro prepared glycosylated haemolysates were added to haemolysate samples, and the resulting mixture subjected to chromatography. Thus, weak cation exchange chromatography using a linear gradient of ionic strength can be used to determine HbG level in cattle blood haemolysate. For comparison, the HbG level of ten healthy humans was determined using the method described above.
Statistical analysis
Statistical analysis was performed by SPSS 9.05 software. The Pearson product-moment correlation coefficients were considered as indicators of the strength and direction of linear relationships between different variables.
Results
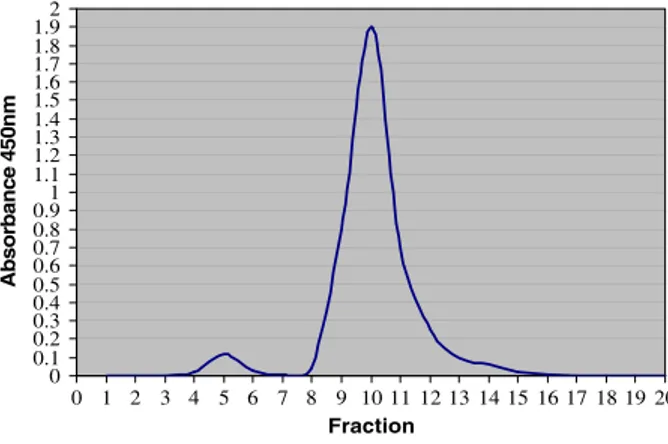
This is the first study relating HbG to milk production traits in cattle. As expected, two peaks corresponding to HbG and Hb were observed in the chromatogram of each
haemolysate sample (Fig. 1). The mean HbG content as a proportion of total Hb
across all the cows was 3.58 ± 0.47% compared to 5.45 ± 0.43% in human sample. In vitro glycosylation of haemolysate raised the level of HbG to 6.2 ± 0.91%. In these
samples the first peak of the chromatogram were spiked (Fig. 2) indicating that the
first peak is related to HbG. Negative correlations were established between HbG and milk yield (r =0.88), lactose yield (r = 0.83), protein yield (r = 0.79), total solid yield
(r = 0.74) and SNF yield (r = 0.81) (Table 1). No significant correlation was obtained
between HbG and the lactose percentage (r =0.007) or with any of the other milk constituents.
Strong positive correlations of lactose yield were established with milk, protein, SNF and total solid yields. Correlation with fat yield was also positive but not as
strong (Table 1). Although very weak negative correlations were found between milk
volume and protein, lactose, total solid, SNF and fat percentages, correlations between milk volume and protein, lactose, total solid and SNF yields were strongly positive indicating that with increasing milk volume, protein and total solids production also
Discussion
The mean Holstein cattle HbG appears different in this study from that (1.52±0.79% and
1.86±0.78%) reported by Ganaba et al. (1993); lower than that of human (3–6%: Burtis and
Ashwood1999), camel (5.5%: Alayash and Wilson1987) and goat (4.0%: Alayash et al.
1988); similar to that of sheep (3.2%: Alayash et al.1988), dog (3.3%: Elliott et al.1997)
and horse (3.2%: Shahbazkia and Nazifi2005); and higher than that of dog (1.4%: Loste
and Marca2001), ostrich (1.2%: Shahbazkia and Nazifi2008b) and kestrel (1.25%: Ardia
2006). As HbG percentage is dependent on long term blood glucose concentration,
erythrocyte life span (Burtis and Ashwood 1999), the permeability of the erythrocytes to
blood glucose (Higgins et al. 1982) and the potential of Hb to bind with glucose, the
interspecies variations in HbG may be related to one or a combination of all these factors. In addition, differences in the methods used to determine HbG in different studies may also be a potential source of variations in HbG values.
The negative correlation between HbG and milk production is consistent with the negative correlation established between blood glucose level and milk production (Jenny et
al.1974; Snijders et al.2001). As HbG concentration appears to be a good indicator of long
0 0.1 0.2 0.3 0.4 0.5 0.6 0.7 0.8 0.91 1.1 1.2 1.3 1.4 1.5 1.6 1.7 1.8 1.92 0 1 2 3 4 5 6 7 8 9 10 11 12 13 14 15 16 17 18 19 20 Fraction Absorbance 450nm
Fig. 2 Chromatogram of in vitro glycosylated haemolysate sample shown in Fig.1, The first peak was spiked; indicating that the first peak is related to the HbG
0 0.1 0.2 0.3 0.4 0.5 0.6 0.7 0.8 0.91 1.1 1.2 1.3 1.4 1.5 1.6 1.7 1.8 1.92 0 1 2 3 4 5 6 7 8 9 10 11 12 13 14 15 16 17 18 19 20 Fraction Absorbance 450nm
T able 1 Correlations betwe en dif ferent milk prod uction traits and glycosylated haemog lobin in Iranian Holsteins. Pe arson prod uct-mom ent cor relation co ef ficients hav e been shown Traits Milk V olum e Fat yield Protein yield Lactose yield T otal solid yield SNF yield Fat % P rotein % Lact ose % T otal solid % SNF % H BG% Milk V olum e – +0.06 7 +0.79 4 +0.95 8 +0.71 1 +0.85 1 − 0.05 3 − 0.08 61 − 0.00 1 − 0.02 89 − 0.03 30 − 0.882 Fat yield +0.067 – +0.01 7 +0.10 2 +0.02 2 +0.06 5 +0.74 5 − 0.10 1 +0.06 2 − 0.03 2 0.00 0 − 0.098 Protein yield +0.794 +0.01 7 – +0.80 6 +0.76 8 +0.85 7 − 0.10 2 +0.01 9 0.00 0 0.00 0 0.00 0 − 0.792 Lactose yield +0.958 +0.10 2 +0.80 6 – +0.78 8 +0.92 2 − 0.02 2 − 0.08 5 +0.06 3 − 0.00 5 − 0.00 1 − 0.834 T otal solid yield +0.71 1 +0.02 2 +0.76 8 +0.78 8 – +0.83 7 − 0.07 6 − 0.00 5 +0.01 8 +0.10 2 +0.00 6 − 0.737 SNF yield +0.851 +0.06 5 +0.85 7 +0.92 2 +0.83 7 – − 0.04 4 − 0.02 0 +0.01 9 0.00 0 +0.01 4 − 0.812 Fat % − 0.053 +0.74 5 − 0.10 2 − 0.02 2 − 0.07 6 − 0.04 4 – − 0.03 4 +0.07 5 − 0.00 7 +0.00 8 + 0.004 Protein % − 0.0861 − 0.10 1 +0.01 9 − 0.08 5 − 0.00 5 − 0.02 0 − 0.03 4 – − 0.00 2 +0.17 3 +0.21 1 − 0.007 Lactose % − 0.001 +0.06 2 0.00 0 +0.06 3 +0.01 8 +0.01 9 +0.07 5 − 0.00 2 – +0.1 10 +0.26 9 − 0.002 T otal solid % − 0.0289 − 0.03 2 0.00 0 − 0.00 5 +0.10 2 0.000 − 0.00 7 +0.17 3 +0.1 10 – +0.30 4 + 0.006 SNF % − 0.0330 0.00 0 0.00 0 − 0.00 1 +0.00 6 +0.01 4 +0.00 8 +0.21 1 +0.26 9 +0.30 4 – + 0.01 1 HBG% − 0.882 − 0.09 8 − 0.79 2 − 0.83 4 − 0.73 7 − 0.81 2 +0.00 4 − 0.00 7 − 0.00 2 +0.00 6 +0.01 1 –
term mean blood glucose level, the negative correlation between HbG percentage and milk production is no doubt related to lower blood glucose concentration in more productive cows. We suggest that cows having a higher potential for lactose synthesis maintain a lower HbG content. This hypothesis was tested by searching for a correlation between HbG and lactose percentages, but no such correlation existed. However, the percentage of milk lactose does not necessarily correlate with the potential for lactose synthesis in the mammary gland. For example, one cow with a 305 day milk yield of 12 litres, with a mean lactose percentage of 4% will produce approximately twice as much lactose as a second cow with a 305 day milk yield of 6 litres with the same lactose percentage. Milk lactose percentage was also uncorrelated with total lactose production (r=0.063). Thus the total 305 day lactose production was taken as an indicator of potential lactose synthesis and this was strongly correlated with HbG. Lactose synthesis and milk yield show a linear positive correlation with glucose uptake in the mammary
gland of goats and cows (Kronfeld1982; Nielsen and Jakobsen1993; Hurtaud et al.2000; Kim
et al.2001; Nielsen et al.2001; Cant et al.2002; Huhtanen et al.2002). Therefore higher lactose
synthesis potential is accompanied by greater glucose uptake by the lactating mammary gland; however, this demand may be insufficiently satisfied by the rate of liver gluconeogenic activity leading to a fall in blood glucose concentration followed by a fall in HbG.
Strong correlations between lactose yield and protein yield and milk volume (0.92 and
0.98 respectively) have been also reported in cattle by Miglior et al. (2007). Our results are
in agreement with this report and add more data on milk concentration and total solid content and yield.
Because lactose maintains the osmolarity of the milk, its rate of synthesis is the
major factor influencing milk volume (Neville et al. 1983; Cant et al. 2002). This
mechanism can explain the strong positive correlation between lactose yield and milk production. Very weak correlation between lactose percentage and milk production could be related to the osmotic regulator role of lactose. Higher or lower lactose production leaves the lactose percent of the milk almost unchanged but it can strongly affect milk volume.
In genetically modified mice, it has been reported that deficiency of lactose synthase
complex in the mammary gland induced by diminution of α-lactalbumin or
β1-4-galactosyltransferase (two parts of the lactose synthase complex) can lead to decreases in
milk volume caused by decreased biosynthesis of lactose (Vilotte 2002). Although the
strong correlation between lactose yield and milk volume in the studied cattle can be explained by the mechanism mentioned above, the effect of this process would be to leave the total amount of other constituents such as protein and solids unchanged and therefore,
milk concentration is decreased as it has been reported in mice (Vilotte2002) and in dairy
animals (Bencini and Pulina1997; Holmes and Wilson1984).
However, we have shown in the present study that there are no strong negative correlations between lactose yield and milk concentration (total solid percentage), between lactose yield and the percentages of other constituents of milk and between milk volume
and total solid content of milk (Table 1). This suggests that higher lactose production is
accompanied by higher milk volume production, higher protein and other solids (except fat) secretion into the milk to leave protein and total solid content and milk concentration almost unchanged.
Considering correlations between percentages and yields of the different constituents of milk, the strongest correlation was found between fat percent and its yield indicating that fat percentage of milk and not milk volume is the most important factor influencing fat yield. In the case of protein and total solid yields, the correlations between percentages and yields were very weak but correlations between yields and milk volumes were very strong,
indicating that milk volume, which is determined by the level of lactose synthesis, is the most important factor affecting protein and total solid yields.
Our results suggest that lactose or mechanisms involved in its synthesis and secretion may also affect the synthesis and/or secretion of the other milk constituents.
Conclusion
The observed negative correlations between HbG and milk, lactose, SNF, protein and total solid yields, suggest that higher milk production accompanies lower mean blood glucose. Positive correlations were established between lactose yield and milk, protein, SNF and total solid yields. We concluded that the mechanism of lactose secretion and its controlling effects on milk volume, the lactose synthase enzyme and related genes can be considered as important factors that must be taken in account in milk production and animal breeding
strategies. Considering these findings, we are presently studying the
β1-4-galactosyltransferase I gene, which encodes the catalytic part of lactose synthase and its possible associations with different milk production traits.
Acknowledgements We acknowledge the Ghiam Dairy Co. and its management team for facilitating this study and for providing technical support for sampling, milk and herd history analysis. This research was jointly supported by grant number 87-GR-VT-11, Shiraz University Research Council and by FCT (Fundação para a Ciência e Tecnologia) and Shahrekord University.
References
Al-Ali AK, Rehaimi A, Saba R, Power DM (1990) A comparative study of glycosylated haemoglobin level in the Arabian camel (Camelus dromedarius) during different seasons. Comp Biochem Physiol B 96:821–823
Alayash AI, Wilson MT (1987) Levels of glycosylated haemoglobin in the Arabian camel (Camelus dromedarius). Comp Biochem Physiol 86:343–345
Alayash AI, El-Hassan AM, Omer R, Bonaventura J (1988) Glycosylated haemoglobin: an indicator of long-term blood glucose in domestic sheep and goats. Comp Biochem Physiol 90:229–231
Ardia DR (2006) Glycated hemoglobin and albumin reflect nestling growth and condition in American kestrels. Comp Biochem Physiol 143:62–66
Barillet F, Elsen JM, Roussely M (1986) Optimization of a selection scheme for milk composition and yield in milking ewes: example of the Lacaune breed. Proceedings of the 3rd World Congress on Genetics Applied to Livestock Production 6:658–664
Bencini R, Pulina G (1997) The quality of sheep milk: a review. Wool Technology and Sheep Breeding 45:182–220
Burtis CA, Ashwood ER (1999) Tietz textbook of clinical chemistry, 3 rd edn. Saunders, Philadelphia Cant JP, Trout DR, Qiao F, Purdie NG (2002) Milk synthetic response of the bovine mammary gland to an
increase in the local concentration of arterial glucose. J Dairy Sci 85:494–503
Casoli C, Duranti E, Morbidini L, Panella F, Vizioli V (1989) Quantitative and compositional variations of Massese sheep milk by parity and stage of lactation. Small Rum Res 2:47–62
Casu S, Sanna S (1990) Aspetti e problemi del miglioramento genético della omposizione del latte di pecora e di capra (Aspects and problems of genetic improvement of the composition of milk from sheep and goats). Proceedings of the Second International Symposium ' Nuove prospettive della ricerca sugli ovi-caprini' . Varese , Italy 171–195
Elliott DA, Nelson RW, Feldman EC, Neal LA (1997) Glycosylated hemoglobin concentrations in the blood of healthy dogs and dogs with naturally developing diabetes mellitus, pancreatic beta-cell neoplasia, hyperadrenocorticism, and anemia. J Am Vet Med Assoc 211:723–727
Flamant JC, Morand-Fehr PC (1982) Milk production in sheep and goats. In: Coop IE (ed) Sheep and Goat production. Elsevier 275–295
Gabbay KH, Hasty K, Breslow JL, Ellison RC, Bunn HF, Gallop M (1977) Glycosylated hemoglobins and long-term glucose control in diabetes mellitus. J Clin Endocrinol Metab 44:859–864
Ganaba R, Bigras-Poulin M, Vermette L, Lariviere N (1993) L'hémoglobine glycosylée chez la vache laitière en période péripartum. Canad Vet J 34:119–120
Higgins PJ, Garlick RL, Bunn HF (1982) Glycosylated hemoglobin in human and animal red cells. Role of glucose permeability. Diabetes 31:743–748
Holmes CW, Wilson GF (1984) Milk Production from Pasture. Butterworths, Wellington, NZ
Huhtanen P, Vanhatalo A, Varvikko T (2002) Effects of abomasal infusions of histidine, glucose, and leucine on milk production and plasma metabolites of dairy cows fed grass silage diets. J Dairy Sci 85:204–216 Hurtaud C, Lemosquet S, Rulquin H (2000) Effect of graded duodenal infusions of glucose on yield and
composition of milk from dairy cows. 2. Diets based on grass silage. J Dairy Sci 83:2952–2962 Jenks JA, Lochmiller RL, Leslie DM, Hellgren EC, Melchiors MA, Mathis GT (1991) Glycosylated
hemoglobin as a stable alternative to serum glucose in white-tailed deer. J Wildl Dis 27:502–505 Jenny BF, Polan CE, Thye FW (1974) Effects of High Grain Feeding and Stage of Lactation on Serum
Insulin, Glucose and Milk Fat Percentage in Lactating Cows. J Nutr 104:379–385
Jovanovic L, Peterson M (1981) Clinical utility of glycosylated hemoglobin. Am J Med 70:3310–3318 Kim CH, Kim TG, Choung JJ, Chamberlain DG (2001) Effects of intravenous infusion of amino acids and
glucose on the yield and concentration of milk protein in dairy cows. J Dairy Res 68:27–34
Kronfeld DS (1982) Major metabolic determinants of milk volume, mammary efficiency, and spontaneous ketosis in dairy cows. J Dairy Sci 65:2204–2212
Latimer KS, Mahaffey EA, Prasse KW (2003) Veterinary laboratory medicine. Clinical pathology, 4th edn. Iowa State Press, Ames, pp 181–186
Loste A, Marca MC (2001) Fructosamine and glycated hemoglobin in the assessment of glycaemic control in dogs. Vet Res 32:55–62
Miglior F, Sewalem A, Jamrozik J, Bohmanova J, Lefebvre DM, Moore RK (2007) Genetic Analysis of Milk Urea Nitrogen and Lactose and Their Relationships with Other Production Traits in Canadian Holstein Cattle. J Dairy Sci 90:2468–2479
Neville MC, Allen JC, Watters C (1983) The mechanisms of milk secretion. In: Neville MC, Neifert MR (ed) Lactation: Physiology, Nutrition, and Breast-Feeding. Plenum, New York, pp 49–99
Nielsen MO, Jakobsen K (1993) Changes in mammary glucose and protein uptake in relation to milk synthesis during lactation in high- and low-yielding goats. Comp Biochem Physiol 106:359–365 Nielsen MO, Madsen TG, Hedeboe AM (2001) Regulation of mammary glucose uptake in goats: Role of
mammary gland supply, insulin, IGF-1 and synthetic capacity. J Dairy Res 68:337–349
Peterson KP, Pavlovich JG, Goldstein D, Little R, England J, Peterson CM (1998) What is haemoglobin A1c? An analysis of glycated haemoglobin by electrospray ionization mass spectrometry. Trends in Endocrinology and Metabolism 44:1951–1958
Pulina G (1990) L'influenza dell'alimentazione sulla qualitit del latte ovino (The effect of nutrition on the quality of sheep milk). L 'informatore Agrario 37:31–39
Richter NA (1986) Percentage of glycosylated hemoglobin and serum concentration of glucose in the blood of Japanese macaques and in three exotic ruminant species. Am J Vet Res 47:1783–1784
Shahbazkia H, Nazifi S (2005) Determination of glycated haemoglobin in horses by cation exchange chromatography. Comp Clin Pathol 14:168–170
Shahbazkia HR, Nazifi S (2008a) Determination of glycated haemoglobin (HbG) and its correlation with plasma glucose in Iranian fat-tailed sheep and lamb. Online Journal of Vet Res 12:7–13
Shahbazkia HR, Nazifi S (2008b) Glycated haemoglobin (HbG) as a stable indicator of blood glucose status in ostrich. Comp Clin Pathol 17:9–12
Snijders SEM, Dillon PG, O’Farrell KJ, Diskin M, Wylie ARG, O’Callaghan D, Rath M, Boland MP (2001) Genetic merit for milk production and reproductive success in dairy cows. Animal Reproduction Science 65:17–31
Threadgold LC, Kuhn NK (1979) Glucose 6-phosphate hydrolysis by lactating rat mammary gland. Int J Biochem 10:683–685
Vilotte JL (2002) Lowering the milk lactose content in vivo: potential interests, strategies and physiological consequences. Reprod Nutr Dev 42:127–132
Zhao FQ, Keating AF (2007) Invited review: Expression and regulation of glucose transporters in bovine mammary gland. J Dairy Sci 90: E76–E86
Zhao FQ, Okine EK, Kennelly JJ (1999) Glucose transporter gene expression in bovine mammary gland. J Anim Sci 77:2517–2522
Zhao FQ, Zheng YC, Wall EH, McFadden TB (2005) Cloning and Expression of Bovine Sodium/Glucose Cotransporters. J Dairy Sci 88:182–194