© FECAP
DOI: http://dx.doi.org/10.7819/rbgn.v15i47.1409
Subject Area: Organizational Strategy and Behavior
Evaluation of a Collaborative Strategy: a case study in the Port
wine industry
Avaliação de uma Estratégia Colaborativa: um estudo de caso no setor do
vinho do Porto
Evaluación de una Estrategia Colaborativa: un estudio de caso en el sector
del vino de Oporto
António Carrizo Moreira1
Victor Ferreira Moutinho2
José da Costa Pereira3 Received on August 22, 2012 / Approved on June 12, 2013
Responsible Editor: João Maurício Gama Boaventura, Dr. Evaluation Process: Double Blind Review
1. PhD in Management by the University of Manchester, England. Professor at University of Aveiro, Portugal. [[email protected]] 2. Doctoral Student of Economy by Beira Interior University, Portugal. Professor at University of Aveiro, Portugal.
3. Master in Management by University of Aveiro, Portugal. [[email protected]]
Authors’ address: DEGEI, Santiago Campus, University of Aveiro, 3810-193 Aveiro, Portugal
ABSTRACT
The rapid and all-encompassing changes in regional and world wine markets have stimulated us to carry out this study. Accordingly, based on the competitiveness of an important Port wine producer in Portugal, this article analyzes a strategic alliance between this company and another important multinational one that is present in many different worldwide distribution markets. Basically, the article seeks to understand, on the one side, the impact of a strategic alliance on a small Port wine producer when becoming involved with a multinational company, and, on the other hand, to identify differences, before and after the alliance, to the markets where the
small company was made present. This work is centered on a case study and involves the use of econometrics methodologies that analyze panel data, in order to grasp differences of strategic pre- and post-alliance actions. The conclusions are important, since they allow one to compare, on one hand, difference between the company´s performance over two different time horizons. On the other hand, econometrics methods are robust, since they allow one to come to relational conclusions, keeping the case study in mind.
RESUMO
As rápidas e abrangentes mudanças nos mercados mundial e regional de vinhos estimularam a realização desta investigação. Assim, tendo por base a competitividade de uma importante empresa produtora de vinho do Porto, em Portugal, este artigo analisa uma aliança estratégica entre essa empresa e uma importante empresa multinacional, presente nos diversos mercados internacionais de distribuição. Em concreto, o artigo procura compreender, por um lado, qual o impacto de uma aliança estratégica para uma pequena empresa produtora de vinho do Porto ao envolver-se com uma empresa multinacional e, por outro, identificar as diferenças antes e depois da aliança para os mercados onde a pequena empresa esteve presente. Este trabalho está centrado em um estudo de caso e envolve a utilização de metodologias econométricas que analisam dados em painel, de forma a captarem as diferenças de atuação estratégicas pré e pós-aliança estratégica. As conclusões são importantes, dado que permitem comparar, por um lado, a diferença de desempenho da empresa em dois horizontes temporais diferentes. Por outro, os métodos econométricos são robustos, dado que permitem tirar conclusões relacionais tendo em conta o caso em estudo.
Palavras-chave: Alianças estratégicas. Estratégia cooperativa. Vinho do Porto. Modelos econo-métricos. Portugal.
RESUMEN
Los rápidos y grandes cambios del mercado mundial y regional del vino han estimulado la realización de esta investigación. Basándose en la competitividad de una empresa productora importante de vino de Oporto en Portugal, este artículo analiza una alianza estratégica entre esta empresa y otra multinacional, presente en los diversos mercados internacionales de distribución. En concreto, el artículo pretende explicar, por un lado, cuál es el impacto de una alianza estratégica para una pequeña empresa productora de vino de Oporto al asociarse con una empresa multinacional y, por otro, identificar las
diferencias anteriores y posteriores a la alianza de los mercados en los que ha participado la pequeña empresa. Este trabajo se centra en un estudio de caso y utiliza metodologías econométricas que analizan datos en panel, para captar las diferencias de actuación estratégicas antes y después de la alianza estratégica. Las conclusiones son importantes, dado que permiten comparar la diferencia de desempeño de la empresa en dos horizontes temporales diferentes, así como demostrar que los métodos econométricos son sólidos dado que permiten extraer conclusiones relacionales basadas en el estudio del caso.
Palabras clave: Alianzas estratégicas. Estrategia cooperativa. Vino de Oporto. Modelos econométricos. Portugal.
1
INTRODUCTIONIn the context of internationalization, the Port wine sector has focused almost exclusively on exports to foreign markets, in which distributing agents and subsidiaries of large multinational groups, owners of the most prestigious brands, have dominated distribution. However, changes dictated by market globalization implied, amongst other alterations, disinvestment in Portugal by some multinationals operating in the sector, which then led to the concentration of business in family economic groups with local decision-making centers and strong investment capacity and initiative, but lacking their own distribution. This situation has led companies to the need to find alternative solutions to maintain and/or develop the presence of Port wine brands in the global market.
is difficult, and this creates a constant need to reevaluate business strategies, either internally or externally. From an internal perspective, strategic options notably include launching new products and/or restructuring production, distribution and management processes. From an external perspective, the quickest way to react and adapt to the constant changes that occur over global markets, maintaining the lead over competitors, may be to establish collaborative strategies whose competitive advantages are based on the principle of cooperation between companies, through a mechanism of mutual exchange of technology, knowledge, competence, market contacts, products and/or financial resources (OLIVER, 2000).
The liberalization of world markets has opened new horizons for most companies, but also provided them with enormous new challenges. This phenomenon has led to strong growth in global business transactions and caused profound changes in business strategies and competitive processes. Accordingly, collaborative strategies currently assume significant relevance in the context of the internationalization of companies, allowing them to penetrate into new markets, acquire new technologies, obtain operational and financial synergies, increase competitiveness, achieve greater bargaining power with market sharing investment costs and risks, and gain access to business opportunities that they would not have the capacity to access individually (BALESTRIN; VERSCHOORE, 2008).
There are, however, marked discrepancies between the objectives of foreign and domestic companies when establishing alliances. Typically, domestic companies seek opportunities to increase their export capacity, whilst foreign companies seek greater access to the domestic markets of the allied company (BUCKLEY; CASSON, 2003; TODEVA; KNOKE, 2005). The tension created by this difference in goals and capabilities amongst international partners is a fundamental reason to seek equal control in order to safeguard the alliance and the company of any inherent
risks. The parties may have different reasons for the same goal, so these agreements should clearly describe the common goals and purposes of the partnership, which should be supplemented by a statement of values , objectives, intentions or
vision as a basis for obtaining specific results or as a measure of performance evaluation. On the other hand, the lack of an agreement with common, clear and reasonable objectives substantially increases the likelihood of the partnership failing (TODEVA; KNOKE, 2005).
Not all implemented alliances reach expected results for all parties involved. Some companies may use strategic alliances as a cautious way – that presents fewer risks – to explore opportunities for future mergers or acquisitions. On the other hand, as the business relationship develops, one of the companies may set goals that conflict with those of the other company, either in terms of internationalization, product development or decentralization of production or direction.
In this context, and taking into account that most of the research on strategic alliances has been based on large companies, the aim of
this study is to analyze and assess the case study of a collaborative strategy involving a Portuguese Port wine producer and a foreign multinational company, in order to answer the following general question: can strategic alliances within the process of enhancing the internationalization of Port wine producers be in any way beneficial to them?
Following this brief introduction on the topic of strategic alliances, and taking into account the Port wine sector, we decided to make the following general question: do long-term stability relationship of prices and quotas in different export markets justify strategic alliances between Port wine producers and distributors?
To complement this general question, we intend, with this article, to also help answer the following more specific questions:
and after the strategic alliance with the foreign distributor in its different export markets?
2. will there be impact differentiation on the brand’s market share in the various destination countries, caused by the volume of sales before and after the strategic alliance with the foreign distributor in its different markets? 3. will there impact be differentiation on
the brand’s market share in the various destination countries, caused by the monthly average price before and after the strategic alliance with the foreign distributor in its different markets?
Having no claim to provide a definitive and general solution, we intend to contribute with a small portion of knowledge that is capable of enabling some scientific progress in the focused area, especially in the assessment of internationalization and negotiation strategies amongst the agents who operate in these markets.
The article is divided into seven sections. The first includes the article’s introduction. The second section presents a brief characterization of the Port wine industry. The third section presents a literature review on strategic alliances; in the fourth section, the working hypotheses. Data and methodological issues are discussed in the fifth section; results, in the sixth section. Finally, overall conclusions are presented in the seventh section.
2
CHARACTERIZATION OF THE PORT WINE SECTORWine production in Portugal represents 13% of the total value generated by the national agricultural industry (VINE AND WINE INSTITUTE - IVV, 2009).
Port wine is one of its most representative products, and is an icon of the presence and image of Portugal in the world. Portugal has great tradition and relevance within international wine
exportation, and Port wine occupies a prominent place in this scenario. The emergence of new producing countries and changes in consumption patterns have, however, led to the stagnation of Portuguese wine exports, which now represent around 40% of total production (IVV, 2009); the European Union (EU) is the market that absorbs 70% of exports in value and 63% in volume (IVV, 2009).
Amongst the many different types of wines that are exported, Port wine represents around 60% of the total, whilst in volume it does not exceed 30%; thus, it is the Portuguese vinous product with highest generated value (IVV 2009). Indeed, the average price of Port wine exports is around € 4.2/l, whereas, for global exports, it is on average € 1.9/liter. Portuguese exports with higher volume expression are concentrated in table or regional wines (63%), with significant transactions in bulk, being traded on average at € 0.8/liter, which does not add value in the same proportion as exports (IVV, 2009).
Port wine occupies a prominent position in the Portuguese wine sector and is a globally recognized symbol of Portugal. In 2008, it represented 0.23% of the country's GDP and 0.58% of its total exports (IVV, 2009).
although they do have a long tradition referring to wine, are still focused on production, with serious gaps in the field of marketing, sales and distribution (PORTER, 1994).
In this context, companies exporting Port wine, in order to remain competitive facing market changes, have taken strategic decisions that led to an increasing industry concentration (LOPES, 1998).
The marketing of Port wine has expressed a trend, since 2000, towards breaking sales volume, and in 2008 registered its worst performance since 1994, falling 5% below the 2007 volume, corresponding to a drop of 7% in revenue.
FIGURE 1 – Evolution of commercialization in
the Port wine sector Source: IVV (2009)
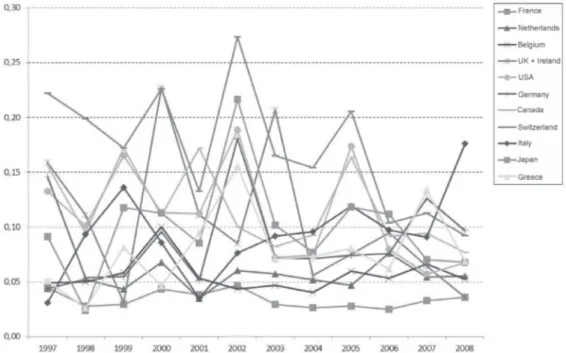
FIGURE 2 – Evolution of Port wine market shares (in %)
Source: IVV (2009)
Figure 1 presents maximum volumes traded and the amount of revenue. In Figure 2, which analyzes the sector market by market, one can observe that France remains the largest export market, and that the five main markets absorb around 80% of the traded volume, revealing a strong concentration of Port wine trade within the European market.
3
STRATEGIC ALLIANCESThe establishment of a strategic alliance requires two or more companies interested in working together, in sharing goals, objectives, responsibilities and knowledge. On the other hand, alliances do not have to be made only between companies of the same size and activity: business size and different fields of activity can also be a basis for a collaborative approach in pursuit of the same objectives (LORANGE; ROOS, 1996).
Alliances are based on partnerships between two or more companies, in order to achieve common strategic objectives, which translate into financial or operational gain (JOHANSON; MATTSSON, 1988). Strategic alliances involve (HARBISON; PEKAR, 1999) a long-term commitment, the sharing of commitments and resources, a relationship based on reciprocity, and the definition of common goals. Under these circumstances, alliances involve mutual needs and contributions, based on trust and mutual dependence, and may be made as a means to: i) implement internationalization strategies; ii) obtain synergies; iii) increase competitiveness; iv) achieve greater bargaining power within the market; v) share risks; and vi) obtain business opportunities which, individually, companies would be unable to.
• to have compatible strategies and cultures;
• to contribute in a comparable or equitable way;
• to internally present compatible forces;
• the inexistence of conflicts of interest;
• to have mutual trust and effective commitment;
• to have determination (and luck).
T h e m o s t c o m m o n p ro b l e m s i n collaborative strategies are, however, conflicts of interest, management structure that is inadequate to joint developments, lack of information concerning a partner’s operations, and problems that refer to responding to market pressure or that result from rapid internal organization changes (ELMUTI; KATHAWALA, 2001). Collaboration tends to be more important and even crucial to the survival of smaller companies. For these, however, fear of failing is more pressing due to frequent and excessive internal focus and consequent limited experience in collaborative contacts – whereas, for larger companies, with stronger financial support and organizational structures, alliances are often one amongst many, giving them thus a better understanding of the collaborative environment. Moreover, in case of disagreement, it is usually the smaller company that is at a disadvantage, since it normally has fewer financial resources that a larger company (BROUTHERS; BROUTHERS; WILKINSON, 1995).
The vast majority of studies that address the relationship between involvement in alliances and level of performance are based on measures such as managers’ experience, kinds of alliances, company age and size. Some of these studies demonstrated, however, that many alliances end before reaching outlined objectives, with a high failure rate (ROWLEY; BEHRENS; KRACKHARDT, 2000; MOCKLER, 2001; TODEVA; KNOKE, 2005; XIE; JOHNSTON, 2004).
The ability to manage alliances, since it is a relatively new concept, varies from
collaboration to collaboration, and is a critical competence, whose analysis contributes to a better understanding of why different company alliance performances exist; and their success depends on this capacity (DYER; SINGH, 1998; DAS; SEN; SENGUPTA, 2003; ANSLINGER; JENK, 2004).
According to Bae and Gargiulo (2004), companies make alliances to acquire resources which otherwise would not be easily available in the market, such as technological capabilities and access to markets that have high barriers against entry and legitimacy. Also according to the authors, companies that are allied with partners who hold a significant portion of a particular feature of the market, and get privileged access to these resources, achieve competitive advantages over other companies without any such access, or with less privileged access to these resources.
The process of globalization has given a big boost to international alliances, given that they help companies overcome national boundaries, reduce the risks of international involvement, reduce international competition and accelerate international expansion (VIDAL-SUÁREZ, 2000; GARCÍA-CANAL, 2004). Garcia-Canal (2004) proposes a typology that distinguishes three different types of international alliances: local ones, in which a company engages with international partners to explore the local market; global ones, in which a company engages with international partners to explore and coordinate international markets; and household ones, in which a company engages with international partners to explore the latter’s destination market.
explores the issue of strategic alliances to address five main aspects based on two perspectives, the dyadic perspective and the network perspective: the formation of alliances, alliances’ governance structures, the dynamic evolution of alliances, the performance of alliances, and the consequences to companies entering them.
Relational issues were once again at the basis of research concerning strategic alliances, and Gulati, Nohria and Zaheer (2000) highlighted the following areas of interest to alliances: the industry structure, the positioning of strategic groups within the industry itself, the inimitability of resources and capabilities of the alliance itself in achieving competitive advantages, and the alliance’s dynamic perspective. They conclude that companies that occupy a central place in the network, when compared with more peripheral partners, present superior performances, mainly because of easier access to information and opportunities. They recommend the use of the resource-based perspective to be able to assess and understand the dynamics of the alliance.
The importance of mutual dependence between partners is a topic that helps explain why some alliances fail and others are successful (XIA, 2011). Taking advantage of the resource-based perspective and from an international perspective, he concludes that, in addition to mutual dependence, mutual help amongst partners in the management of dependence facing external constraints is crucial in successful partnerships. Clearly, the complementarity of resources is a necessary condition, but not sufficient.
Partners’ experience of the partners was also the object of study (GULATI; LAVIE; SINGH, 2009). Indeed, previous experience in partnerships and experience with specific partners is important in both a general level and at the level of the dyad. They conclude that relational skills are important, since they allow for better tuning into both factors: the contingent and the strategic.
Finally, the relationship between a perspective based on resources and performance was evaluated and validated by a meta-analysis (CROOK et al., 2008); 125 articles and 29.000 businesses involving strategic alliances were analyzed. The authors confirm that directors’ main concern must be the adequate identification of companies’ strategic resources, since they enable the development and delivery of values to partner companies of the alliance.
Literature has been biased when assessing the alliance as a unit of analysis, and has sought to explore the perspective of resources and alliance’s performances. Xia (2011) uses a more pragmatic perspective when analyzing interdependence and the possibility of repeating or replacing partners, giving the alliance a new dual perspective: strategic and situational, in which the alliance has a long-term perspective but is analyzed continuously, emphasizing the resource dependency theory.
This relational perspective that examines the alliance and the performance of each partner was also used by Goerzen (2007) in the evaluation of the repetition of partners. The question is relevant in the study of business alliances, because it has been subject to very little scrutiny, especially when the units of analysis are made in terms of the dyad or relationship, and very rarely concerning the partners in this relationship.
4
CASE STUDY AND RESEARCH HYPOTHESESthe sixties on, it exports its products to various markets. Nowadays, its portfolio of products is present in over 80 countries.
The main explanations for its presence in international markets are the prestige of some of its brands, its weak growth in the Portuguese market, the emergence of a growing global market, and the presence of strong international Port wine competitors in South Africa, Australia and the USA.
In the process of its internationalization, it made agreements with agents/ representatives in various target markets. At the turn of the new millennium, it signed a partnership with a Canadian multinational company, present in various international markets, for commercialization of some of its products. The main reasons for this collaborative strategy are: creating rapid growth strategies for target markets, overcome government restrictions in destination markets, obtain synergies and provide greater overall product visibility in target markets.
Due to discrepancies with the multinational company, the partnership ended in June 2002, from when on ALFA established an alliance with a French company that has global presence in food distribution and retail. This alliance involved marketing the brands of Port wine in the various markets where the multinational is present, as well as the allocation of business resources and marketing in foreign markets, affording it not only a greater degree of control in the global distribution of its products/brands but also greater accountability in achieving goals to be reached in strategic definition. With involvement in this partnership, ALFA sought to complement its relationship with its partner, allowing it to take advantage of its global scope. The latter, in turn, sells Port wine as well as the Portuguese company’s portfolio of wines, and both companies take advantage of each other’s complementary resources.
ALFA’s great advantage is that, in its first collaborative strategy with the Canadian
multinational company, it sought to minimize risks and obtain synergies, as well as global brand positioning and visibility. In the alliance with the French company, as well as the abovementioned factors, it sought to be present in more international markets, at lower costs than if it had established subsidiaries abroad. Clearly ALFA, according to the typology of García-Canal (2004), moved from a collaborative multi-domestic strategy to a global alliance.
According to literature review, it is generally concluded that there is ample research on alliances in their social and relational perspective, taking into account the formation, structure and performance of the alliance. The resource perspective has been widely used as a theoretical basis to study the dynamics and performance of the alliance; the latter or the dyad is research’s unit of analysis. Reciprocity between partners, repetition and/or replacement of partners has, however, been little studied in this area, and in this case, partner(s) are the unit(s) of analysis.
Keeping this specific case in mind, we propose the following research hypotheses:
H1: The strategic alliance between producer and distributor is largely associated with the increase in market shares;
H2: The strategic alliance between producer and distributor causes the supplier’s commercial policy to adapt to that of the distributor:
a. in export volume; b. in market shares.
H3: The strategic alliance between producer and distributor is a source of resources that allow for the development of relational capital and a consequent increase in share earnings and expansion within shared markets.
5
DATA AND METHODOLOGYThis study uses a quantitative exploratory approach, making use of variables that reflect internationalization strategies taken on by the company.
In the analysis carried out, we used monthly observations of the prices and traded volumes, in value and quantity, of the ALFA brand Port wine, which is the case study, for the markets of France (Fr), Netherlands (Nl), Belgium (Be), UK + Ireland (Uk + Ie), USA (Us), Germany (De), Canada (Ca), Switzerland (Ch), Italy (It), Japan (Jp), Greece (El) and Rest of the World (Rm). The sample also includes data referring to volumes traded by the entire Port wine industry.
The database used is considerably vast and cover the sample period, from January 1997 to December 2008. We used the following variables in the market of the ALFA Port wine brand:
• dependents:
Y1 - sales volume of company ALFA Port wine compared to volume of sector
Port wine, i.e. market share relative to the sector.
Y2- sales volume of company ALFA Port
wine compared to volume of ALFA Port wine, i.e. ALFA market share.
• independents:
Volumes traded in the industry by market in thousands of liters
• explanatory:
X1- average monthly price of ALFA in €
X2 - volume of brand traded by market
in thousands of liters
The most relevant data resulting from the development of the proposed models are the price of the ALFA Port wine brand in international markets, their relative market shares, and volumes traded in the different markets.
Considering that sample data make up a panel, i.e. temporal and cross-sectional data, and assuming that the volumes of Port wine exported to different countries are not constant, we will examine the following aspects:
1. size effect is present and will influence the calculation of variance. Thus, the violation of the assumption of variance equality is present in the cross-sectional component of the sample;
2. assuming the presence of cross-sectional dependence in the sample, given that the alliance’s intermarket trade policies are not
independent conditions;
3. temporal evolution, both of international prices or of traded volumes, lead us to admit the possible existence of serial correlation of data variables.
study involved the following steps: analysis of the presence of heteroscedasticity and contemporary autocorrelation to panel data; the application of the PCSE estimation; and the use of random effects’ and fixed effects’ assessors of robustness.
To diagnose the presence of dependence in the sectional sample with panel data, we used Frees’ semiparametric test (1995; 2004) and the Pesaran parametric test (2007), whose evaluators are used in regressions, either in fixed effects or in random effects.
The Wooldridge test was used to test for the presence of autocorrelation in which, under
the null hypothesis, the absence of 1st-order autocorrelation is rejected. The modified Wald test followed by Baum (2001; 2004) was used to diagnose the presence of heteroscedasticity based on regression fixed effects’ residuals.
In this study, we use the Static Panel as a econometric model to estimate. The defined eco-nometric model comprises the following multiple linear regression, which aims at explaining the behavior of the producer’s shares with marketing of ALFA brand Port wine:
Y1 is the dependent variable, relative share of the mark, given by the expression 1
1 1
e
i
V i Y
Vti
= ; the numerator is given by (Ve1i) = monthly average in
thousands of traded liters of the brand for market i, and the denominator (V it1) = Total volume in
thousands of liters traded by the Port wine sector, exported to foreign market i. Regarding expla-natory variables, we consider the variable (X1i) = monthly average unit price, in euros, of Port wine, calculated by the ratio given by the monetary value of sales and the value of the volume traded in quantity for each foreign market, and also the variable (X2i), given by traded volume of the brand in thousands of liters for each market.
To complement the econometric analysis presented above, we used convergence coefficient calculation for the set of countries considered in the sample.
This measurement, called beta-convergen-ce, allows for the study of changes in the temporal effects of variables for the set of countries in the sample over time, whose index was calculated according to the following expression (BOYLE; MCCARTHY, 1997):
This index, in its graphic reading, allows for assessing the existence or not of convergence in the two different periods (before and after the alliance).
As a calculation tool, we used the econo-metric software STATA 11.
6
RESULTS6.1
Preliminary analysis of data and descriptive statistics of relevant variablesTables 1, 2 and 3 present the results of descriptive statistics, according to data used, for the ALFA company’s combined markets, as well
as for the pre- and post-alliance periods. Table 4 presents data for the different markets, covering the magnitude of differences in the behavior of market shares in the study of company ALFA, from January 1997 to December 2008.
TABLE 1 – Descriptive statistics for the set of markets over the analyzed period
Variables Average Standard deviation Minimum Maximum
Y1 0.2062 0.2631 0 1
Y2 0.0834 0.0930 0 0.55
X1 – Average price 6.218 2.373 2.78 25.95
X2 – Volume 41.727 51.920 0 446.4
Source: the authors.
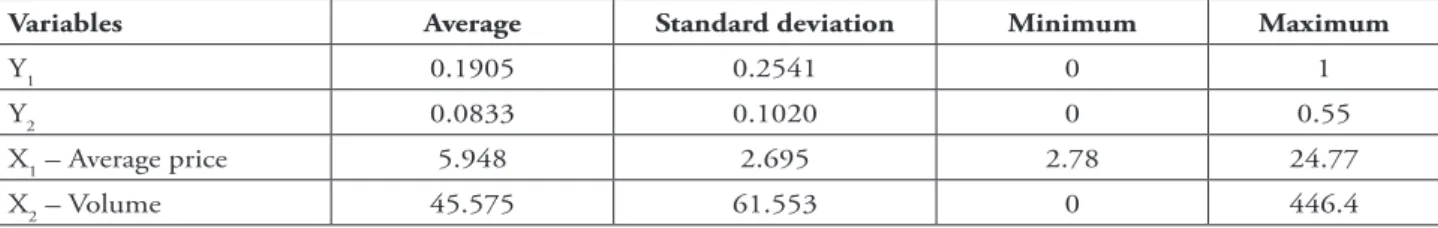
TABLE 2 – Descriptive statistics for the set of markets in the pre-alliance period
Variables Average Standard deviation Minimum Maximum
Y1 0.1905 0.2541 0 1
Y2 0.0833 0.1020 0 0.55
X1 – Average price 5.948 2.695 2.78 24.77
X2 – Volume 45.575 61.553 0 446.4
Source: the authors.
TABLE 3 – Descriptive statistics for the set of markets in the post-alliance period
Variables Average Standard deviation Minimum Maximum
Y1 0.2195 0.2697 0 1
Y2 0.0833 0.0848 0 0.47
X1 – Average price 6.438 2.025 3.96 25.95
X2 – Volume 38.657 42.262 0 202.27
Source: the authors.
On average, over the whole period, as shown in Table 1, there is a relative 8.34% ALFA brand Port wine share across the 12 major markets (including the Rest of the World), an average global market price unit of 6.22 euros, and an average volume of the product in all countries of the sample close to 41,727 thousands of traded liters.
To explicit the impacts of differentials on global effects over the analyzed period, attention should be paid to compensatory contributions,
following the strategic alliance, to market shares, although in this post-alliance period the volume of ALFA brand Port wine traded in the set of countries in the sample reveals a decrease in values
(38,657 thousands of gallons sold by the brand in the market after the alliance, against 45,575 thousand liters sold before the strategic alliance).
contribution of France and Belgium as destination markets with a strong exporting tendency of ALFA brand Port wine should be noted. On average, the share of Port wine (Y22) to the French, Belgian, Italian and Dutch markets represent
21.47%, 26.84%, 7.43% and 6.74%, respectively. This demonstrates the strong dependence of the brand on those countries, and a weak dependence on markets such as Canada, Japan and Germany.
TABLE 4 – Statistics for main markets over the entire analyzed period
Variables Average Standard deviation Minimum Maximum
F
rance
Y1 0.0477 0.0210 0 0.11
Y2 0.2147 0.0791 0 0.5
X1 – Average price 4.9255 0.2026 4.46 5.54
X2 – Volume 107.416 54.092 0 356.44
N
etherlands
Y1 0.0275 0.0229 0 0.14
Y2 0.0674 0.0506 0 0.34
X1 – Average price 4.9308 0.4294 3.74 5.95
X2 – Volume 30.995 21.952 0 132.05
Belgium
Y1 0.1506 0.0731 0 0.41
Y2 0.2684 0.1110 0 0.55
X1 – Average price 5.2632 0.4582 4.19 6.33
X2 – Volume 142.296 78.439 0 446.4
UK+I
rl Y1 0.0443 0.0326 0 0.21
Y2 0.0595 0.0418 0 0.24
X1 – Average price 6.4171 1.3334 3.68 10.73
X2 – Volume 31.610 29.271 0 154.67
USA
Y1 0.1649 0.0885 0 0.54
Y2 0.0922 0.0455 0 0.21
X1 – Average price 8.8154 1.6921 5.93 18.64
X2 – Volume 47.746 27.572 0 130.04
G
er
many
Y1 0.0496 0.0431 0 0.28
Y2 0.0261 0.0310 0 0.3
X1 – Average price 4.9953 0.0573 3.63 7.08
X2 – Volume 10.216 5.313 0 25.56
C
anada
Y1 0.0502 0.0455 0 0.32
Y2 0.0158 0.0134 0 0.08
X1 – Average price 5.8063 1.8935 3.21 13.47
X2 – Volume 8.146 8.2299 0 49.23
S
witz
erland
Y1 0.2546 0.2079 0 0.93
Y2 0.0276 0.0211 0 0.08
X1 – Average price 6.0797 1.4209 2.78 11.11
X2 – Volume 13.857 10.883 0 52.11
Italy
Y1 0.4460 0.2275 0 0.97
Y2 0.0743 0.0339 0 0.18
X1 – Average price 4.8553 0.7655 3.04 7.47
X2 – Volume 38.153 23.200 0 128.73
Japan
Y1 0.4536 0.3095 0 1
Y2 0.0202 0.0174 0 0.08
X1 – Average price 9.8465 5.0792 4.31 25.95
X2 – Volume 9.452 8.219 0 41.85
G
reece
Y1 0.6665 0.3786 0 1
Y2 0.0193 0.0344 0 0.39
X1 – Average price 6.7637 1.0701 4.91 10.69
X2 – Volume 7.916 7.657 0 56.7
O
thers
Y1 0.1185 0.0374 0.03 0.23
Y2 0.1146 0.4685 0.03 0.32
X1 – Average price 5.9130 1.0778 4 9.56
X2 – Volume 52.923 21.368 12.61 120.74
With regard to average sales prices, there is a great price variability within different markets, especially in the European market, with some exceptions in prices levels over the analyzed period in Germany, France, Netherlands and Belgium.
6.2
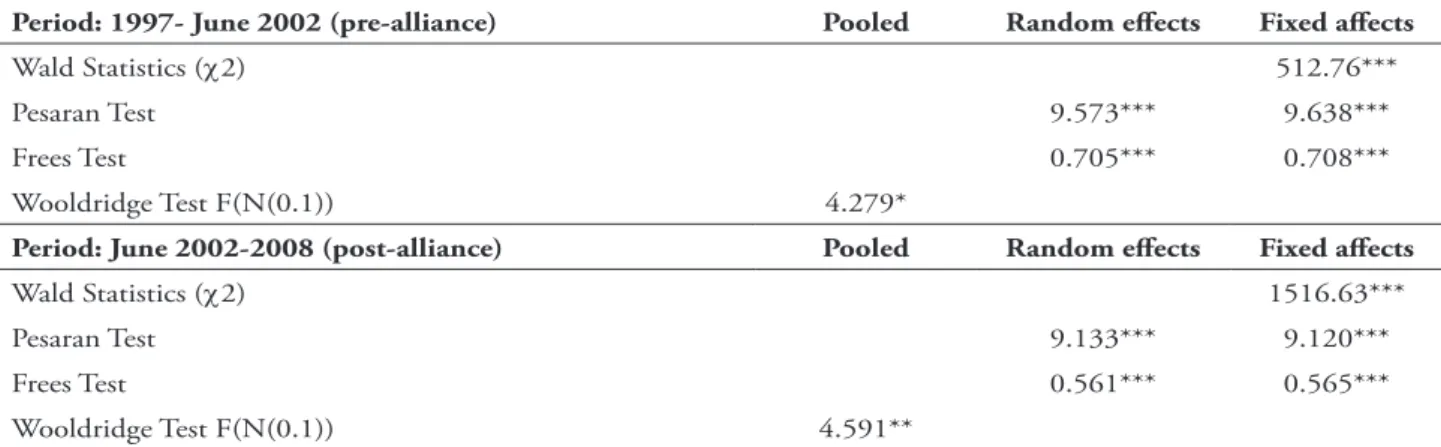
Estimated econometric models according to PCSEThe initial results of specified diagnosis tests for analysis of the presence of heteroscedasticity,
1st order autocorrelation and sectional dependence are described in Table 5. Values of Pesaran and
Frees tests and Wald statistics allow us to reject the null hypothesis of the respective tests, to the statistical significance level of 1%, for the two analyzed periods, so that there is enough statistical evidence to accept the existence of heteroscedasticity and dependence amongst the considered countries. We also found evidence of 1st order autocorrelation at a significance level of 5%, according to the evidential value of the Wooldridge test, which allows one to confirm this statistical inference.
TABLE 5 – Diagnosis tests
Period: 1997- June 2002 (pre-alliance) Pooled Random effects Fixed affects
Wald Statistics (χ2) 512.76***
Pesaran Test 9.573*** 9.638***
Frees Test 0.705*** 0.708***
Wooldridge Test F(N(0.1)) 4.279*
Period: June 2002-2008 (post-alliance) Pooled Random effects Fixed affects
Wald Statistics (χ2) 1516.63***
Pesaran Test 9.133*** 9.120***
Frees Test 0.561*** 0.565***
Wooldridge Test F(N(0.1)) 4.591**
Notes: The Wooldridge Test follows a normal reduced distribution N(0.1) and tests the null hypothesis of absence of serial 1st order autocorrelation in residues. Significance levels of 1, 5 and 10 % are marked with ***, ** and * respectively. The
Wald Test follows a Chi-Square distribution. Source: the authors.
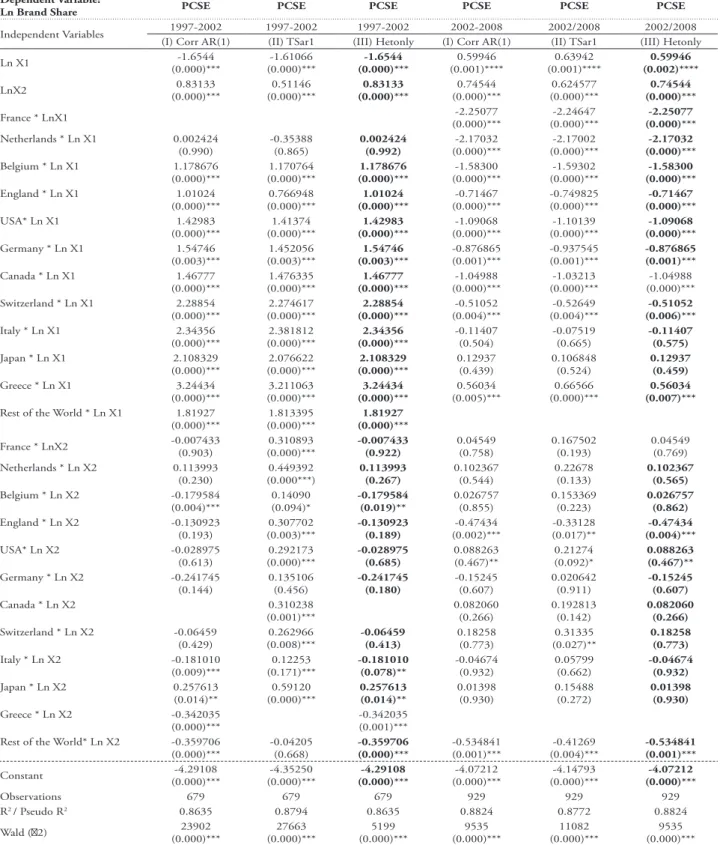
Results in Table 6 were based on an estimate using standard error correction models with panel data, because they ensure greater consistency and efficiency. In the specific case of the sample analyzed, the data make up an unbalanced panel with no heteroscedasticity and autocorrelation of residues.
From these same results, we observe that, in the pre-alliance period, the elasticity of the Port wine brand share, in comparison to the international price for the set of countries in the sample, is elastic, since, in absolute terms, its value is greater than the unit; this does not occur in the post-alliance period, which is inelastic. Such evidence is statistically significant and indicates that the brand’s market shares were much more
volatile and ranged in reverse direction and more than proportionally to the unit price increase of 1% in world markets over the period prior to the alliance, rather than after it.
This result confirms the importance of the alliance, since ALFA gains market shares through the alliance in global terms (set of countries) to the same levels of traded volumes of Port wine at different world prices.
TABLE 6 – PCSE Results Dependent Variable:
Ln Brand Share PCSE PCSE PCSE PCSE PCSE PCSE
Independent Variables 1997-2002 1997-2002 1997-2002 2002-2008 2002/2008 2002/2008
(I) Corr AR(1) (II) TSar1 (III) Hetonly (I) Corr AR(1) (II) TSar1 (III) Hetonly
Ln X1 (0.000)***-1.6544 (0.000)***-1.61066 -1.6544
(0.000)*** 0.59946 (0.001)**** 0.63942 (0.001)**** 0.59946 (0.002)****
LnX2 (0.000)***0.83133 (0.000)***0.51146 0.83133
(0.000)***
0.74544
(0.000)*** (0.000)***0.624577
0.74544 (0.000)***
France * LnX1 (0.000)***-2.25077 (0.000)***-2.24647 (0.000)***-2.25077
Netherlands * Ln X1 0.002424
(0.990) -0.35388 (0.865)
0.002424 (0.992)
-2.17032
(0.000)*** (0.000)***-2.17002
-2.17032 (0.000)***
Belgium * Ln X1 1.178676
(0.000)*** 1.170764 (0.000)*** 1.178676 (0.000)*** -1.58300 (0.000)*** -1.59302 (0.000)*** -1.58300 (0.000)***
England * Ln X1 1.01024
(0.000)*** (0.000)***0.766948
1.01024 (0.000)***
-0.71467
(0.000)*** -0.749825(0.000)***
-0.71467 (0.000)***
USA* Ln X1 1.42983
(0.000)*** 1.41374 (0.000)*** 1.42983 (0.000)*** -1.09068 (0.000)*** -1.10139 (0.000)*** -1.09068 (0.000)***
Germany * Ln X1 1.54746
(0.003)*** 1.452056 (0.003)*** 1.54746 (0.003)*** -0.876865 (0.001)*** -0.937545 (0.001)*** -0.876865 (0.001)***
Canada * Ln X1 1.46777
(0.000)*** 1.476335 (0.000)*** 1.46777 (0.000)*** -1.04988 (0.000)*** -1.03213 (0.000)*** -1.04988 (0.000)***
Switzerland * Ln X1 2.28854
(0.000)*** 2.274617 (0.000)*** 2.28854 (0.000)*** -0.51052 (0.004)*** -0.52649 (0.004)*** -0.51052 (0.006)***
Italy * Ln X1 2.34356
(0.000)*** (0.000)***2.381812
2.34356 (0.000)***
-0.11407
(0.504) -0.07519 (0.665)
-0.11407 (0.575)
Japan * Ln X1 2.108329
(0.000)*** 2.076622 (0.000)*** 2.108329 (0.000)*** 0.12937 (0.439) 0.106848 (0.524) 0.12937 (0.459)
Greece * Ln X1 3.24434
(0.000)*** (0.000)***3.211063
3.24434 (0.000)***
0.56034
(0.005)*** (0.000)***0.66566
0.56034 (0.007)***
Rest of the World * Ln X1 1.81927
(0.000)***
1.813395 (0.000)***
1.81927 (0.000)***
France * LnX2 -0.007433 (0.903) (0.000)***0.310893 -0.007433
(0.922)
0.04549
(0.758) 0.167502 (0.193) 0.04549 (0.769)
Netherlands * Ln X2 0.113993
(0.230) 0.449392 (0.000***) 0.113993 (0.267) 0.102367 (0.544) 0.22678 (0.133) 0.102367 (0.565)
Belgium * Ln X2 -0.179584
(0.004)*** 0.14090 (0.094)* -0.179584 (0.019)** 0.026757 (0.855) 0.153369 (0.223) 0.026757 (0.862)
England * Ln X2 -0.130923
(0.193) (0.003)***0.307702
-0.130923 (0.189)
-0.47434
(0.002)*** -0.33128 (0.017)**
-0.47434 (0.004)***
USA* Ln X2 -0.028975
(0.613) 0.292173 (0.000)*** -0.028975 (0.685) 0.088263 (0.467)** 0.21274 (0.092)* 0.088263 (0.467)**
Germany * Ln X2 -0.241745
(0.144) 0.135106 (0.456)
-0.241745 (0.180)
-0.15245
(0.607) 0.020642 (0.911)
-0.15245 (0.607)
Canada * Ln X2 0.310238
(0.001)*** 0.082060 (0.266) 0.192813 (0.142) 0.082060 (0.266)
Switzerland * Ln X2 -0.06459
(0.429) (0.008)***0.262966
-0.06459 (0.413)
0.18258
(0.773) (0.027)**0.31335
0.18258 (0.773)
Italy * Ln X2 -0.181010
(0.009)*** 0.12253 (0.171)*** -0.181010 (0.078)** -0.04674 (0.932) 0.05799 (0.662) -0.04674 (0.932)
Japan * Ln X2 0.257613
(0.014)** (0.000)***0.59120
0.257613 (0.014)**
0.01398
(0.930) 0.15488 (0.272)
0.01398 (0.930)
Greece * Ln X2 -0.342035
(0.000)***
-0.342035 (0.001)***
Rest of the World* Ln X2 -0.359706
(0.000)*** -0.04205 (0.668) -0.359706 (0.000)*** -0.534841 (0.001)*** -0.41269 (0.004)*** -0.534841 (0.001)***
Constant (0.000)***-4.29108 (0.000)***-4.35250 -4.29108
(0.000)***
-4.07212
(0.000)*** (0.000)***-4.14793
-4.07212 (0.000)***
Observations 679 679 679 929 929 929
R2 / Pseudo R2 0.8635 0.8794 0.8635 0.8824 0.8772 0.8824
Wald (2) 23902
(0.000)*** 27663 (0.000)*** 5199 (0.000)*** 9535 (0.000)*** 11082 (0.000)*** 9535 (0.000)***
Notes: The Wald Test follows a Chi-Square distribution and tests the null hypothesis of non-significance of explanatory variables; p-values are in parenthesis; asterisks ***, ** and * indicate levels of significance at 1, 5 and 10 %, respectively; models indicate that there was correction, assuming that residues (standard errors) presented in model (I) a common autocorrelation AR(1) and that panel residues (unbalanced) were correlated; in model (II), there was specific 1st order
autocorrelation and the unbalanced panel’s residues were correlated; in model (III), there was common autocorrelation AR(1) and the unbalanced panel presented heteroscedasticity.
The price effect alone justifies economic and financial efforts associated with the costs of the alliance (assuming, with some reason, that there is, in the price, in its component, a variable referring to the inclusion of the offsetting effect on the rate of return required by the shareholder of the company producing Port wine), so the same price effect associated with the size effect on the traded volume justify the success of the alliance, with clear gains in the world export market by the Portuguese producer. Thus, it was assumed that there would be a clear trade-off of competitive positions in some of the export markets, hence the inclusion, in the regression, of the cross effects via price and via traded volume, with the individual effect of one single country of export destination.
In this PCSE modeling, either before the alliance or after it, most estimates associated with the estimated parameters show statistical significance for a significance level of 1%. However, before the alliance there are significant individual differences in the elasticity of the ALFA Port wine brand’s joint share.
Before the alliance, there were significant differentials in the elasticity of the market share compared to prices charged in the different export markets; the markets of Switzerland, Italy, Japan, Greece and Rest of the World compared to prices charged in France (country of reference) show differences in increase in elasticity higher than the unit, so the unit price increases of 1% in ALFA brand Port wine induce a more than proportional and positive variation in the share’s increase.
Before and after the alliance there are less significant absolute differences in the elasticity of the share, compared to the volumes exported in different export markets (inelastic elasticity). Taking Canada as a reference exporting country, increases of 1% in volumes exported of the Port wine brand to Germany, Belgium, Italy, Japan, amongst others, led to a decrease in the share differential in the set of countries analyzed. After
the alliance, in these countries, compared to Greece, the share of the Port wine brand increased, which reveals the positive effect of the alliance to these export markets.
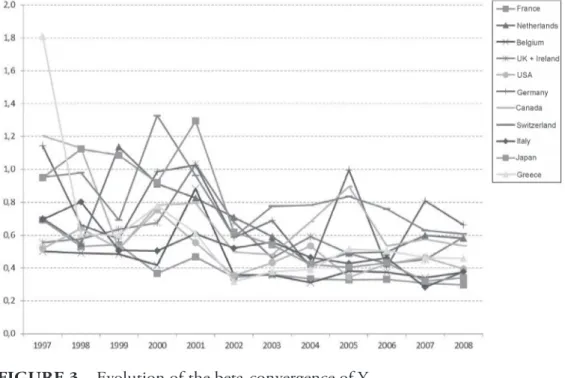
6.3
Levels of convergence of variables and researchFigures 3, 4, 5 and 6 present variations in the levels of inter-temporal convergence of variables. It appears that there was a clear dispersion reduction in all parameters following the alliance.
In the case of a relative market share facing the Port wine sector (Figure 3), it appears that there is greater convergence, generally, following implementation in the markets of Germany and Canada in 2005. In the case of a relative ALFA market share (Figure 4), it appears that there was a convergence after the alliance, which implies greater control of trade policy in the countries analyzed, which also holds for the volume of traded Port wine (Figure 6).
An analysis of Figure 5, referring to prices traded in international markets, shows that, although there is greater stability after the alliance, some important variations still persist, notably in Canada, the United States and Switzerland, mainly because of factors such as currency risk. However, an exception is Italy, which differs in relation to the others, implying there is an important price change in this market, when compared to prices charged in other markets.
FIGURE 3 – Evolution of the beta-convergence of Y1 Source: the authors.
FIGURE 5 – Evolution of the beta-convergence of average monthly prices of ALFA in international markets
Source: the authors.
FIGURE 6 – Evolution of the beta-convergence of traded volumes of ALFA in international markets
7
CONCLUSIONS AND FINAL CONSIDERATIONSIn sum, this empirical study allowed us to validate the theoretical framework presented and proposed, and can be a tool of analysis to validate the impact of strategic alliances.
The empirical results revealed and positively validated hypothesis 1, confirming that the strategic alliance can lead to increased market shares for the producer of ALFA brand Port wine brand, mainly in markets in France, Netherlands, Belgium, USA, Canada, Switzerland and Japan. They also confirmed that there is a differential impact on the ALFA brand market share before and after the strategic alliance.
Also, the pre-and post-alliance comparison in terms of export volume and market shares have differentiated performances, as corroborated by the analysis of beta-convergence, positively validating hypothesis 2.
The results demonstrate that company ALFA predominantly carried out two strategies: on the one hand, one of gains in competitiveness, through the establishment of network relations, with a view to distributing ALFA brand worldwide; and, on the other, one of the search for resources, notably for distribution along the value chain, as a way of extending its scope.
One conclusion is obvious: different strategies produce different results, clearly dismissing, for the studied case, any kind of opportunistic behavior by the multinational company with which ALFA made the strategic alliance. Furthermore: it is possible to generate dynamic complementarities within the alliance, in which the producer achieves an international scope it would not otherwise have, and the distributor increases the range of products offered at international level, taking advantage of its distribution capacity. Hypothesis 3 is thus confirmed.
From the results obtained, it appears that the creation of a strategic alliance with the French multinational proved to be a success for the ALFA company, measured by differential impacts, either in their entirety or by the export
markets. It seems clear that strategic alliances can strengthen the internationalization of Port wine producers, provided there is caution in selecting and managing the partner.
One limitation of this study refers to the fact that it was considered an alliance business without any technological foundation. Thus, the generalization of the findings to all kinds of alliances should be made with caution. To complement this study, it will be interesting to deepen the analysis of strategic alliances from the temporal point of view, considering the maintenance or replacement of partners, as well as include various sectors of activity, in order to enrich the knowledge within strategic alliances.
REFERENCES
ANSLINGER, P.; JENK, J. Creating successful alliances. Journal of Business Strategy, Bingley, v. 25, n. 2, p. 18-22, 2004.
BAE, J.; GARGIULO, M. Partner substitutability, alliance network structure, and firm profitability in the telecommunications industry. Academy of Management Journal, New York, v. 47, n. 6, p. 843-859, Dec. 2004.
BALESTRIN, A.; VERSCHOORE, J. R. Redes de cooperação empresarial: estratégias de gestão na nova economia. Porto Alegre: RS Bookman, 2008.
BAUM, C. F. Residual diagnostics for cross-section time series regression models. The Stata Journal, College Station, v. 1, n. 1, p. 101-104, 2001.
BROUTHERS, K. D.; BROUTHERS, L. E.; WILKINSON, T. J. Strategic alliances: choose your partners. Long Range Planning, Oxford, v. 28, n. 3, p. 18-25, June 1995.
BUCKLEY, P.; CASSON, M. The future of the multinational enterprise in retrospect and in prospect. Journal of International Business Studies, Basingstoke, v. 34, n. 2, p. 219-222, Mar. 2003.
CROOK, T. R. et al. Strategic resources and performance: a meta-analysis. Strategic Management Journal, Chicago, v. 29, n. 11, p. 1141-1154, Nov. 2008.
DAS, S.; SEN, P.; SENGUPTA, S. Strategic alliances: a valuable way to manage intellectual capital? Journal of Intellectual Capital, Bingley,
v. 4, n. 1, p. 10-19, 2003.
DICKEN, P. Global shift: mapping the changing contours of the world economy. Londres: Sage, 2011.
DYER, J. H.; SINGH, H. The relational view: cooperative strategy and sources of interorganizational competitive advantage.
Academy of Management Review, New York, v. 23, n. 4, p. 660-679, Oct. 1998.
ELMUTI, D; KATHAWALA, Y. An overview of strategic alliances. Management Decision, Bingley, v. 39, n. 3, p. 205-217, 2001.
FREES, E. W. Assessing cross-sectional correlation in panel data. Journal of Econometrics, Lausanne, v. 69, p. 393-414, Oct. 1995.
______. Longitudinal and panel data: analysis and applications in the social sciences. Cambridge: Cambridge University Press, 2004.
GARCÍA-CANAL, E. El papel da las alianzas estratégicas en la internacionalización de las empresas españolas. Universia Business Review, Madrid, n. 3, p. 70-83, 2004.
GOERZEN, A. Alliances networks and firm performance: the impact of repeated partnerships.
Strategic Management Journal, Chicago, v. 28, n. 5, p. 487-509, May 2007.
GULATI, R. Alliances and networks. Strategic Management Journal, Chicago, v. 19, n. 4, p. 293-317, 1998.
______; LAVIE, D.; SINGH, H. The nature of partnership experience and the gains from alliances. Strategic Management Journal, Chicago, v. 30, n. 11, p. 1213-1233, Nov. 2009.
______; NOHRIA, N.; ZAHEER, A. Strategic networks. Strategic Management Journal,
Chicago, v. 21, n. 3, p. 203-215, 1998.
HARBISON, J. R.; PEKAR P. P. Alianças estratégicas: quando a parceria é a alma do negócio.
São Paulo: Futura, 1999.
INSTITUTO DA VINHA E DO VINHO. A produção de vinho em Portugal. Factos e números, Lisboa, n. 1, p. 1-35, nov. 2009. Disponível em: < http://www.ivv.min-agricultura. pt/np4/?newsId=1363&fileName=F_N_n_1_Edi__ oRevista.pdf>. Acesso em: 02 dez. 2011.
J O H A N S O N , J . ; M AT TS S O N , L . G .
Internationalisation in industrial systems: a network approach. London: Croom Helm, 1988.
LORANGE, P.; ROOS, J. Alianças estratégicas:
formação, implementação e evolução. São Paulo: Atlas, 1996.
LOPES, T. S. Internacionalização e concentração no vinho do Porto, 1945- 1995. Porto: Grupo de Estudos de História da Viticultura Duriense e do Vinho do Porto, 1998.
MOCKLER, R. J. Making decisions on enterprise-wide strategic alignment in multinational alliances. Management Decision, Bingley, v. 39, n. 2, p. 90-98, 2001.
OLIVER, R. W. New rules for global markets.
ROWLEY, T.; BEHRENS, D.; KRACKHARDT, D. Redundant governance structures: an analysis of structural and relational embeddedness in the steel and semiconductors industries. Strategic Management Journal, Chicago, v. 21, n. 3, p. 369-386, 2000.
PESARAN, M. H. A simple panel unit root test in the presence of cross-sectional dependence.
Journal of Applied Econometrics, Hoboken, v. 27, p. 265-312, Mar. 2007.
PORTER, M. C o n s t r u i r a s va n t a g e n s competitivas de Portugal. Lisboa: Monitor Group Company, 1994.
TODEVA, E.; KNOKE, D. Strategic alliances & models of collaboration. Management Decision,
Bingley, v. 43, n. 1, p.123-148, 2005.
VARADARAJAN, P.; CUNNINGHAM, M. Strategic alliances: a synthesis of conceptual
foundations. Journal of the Academy of Marketing Science, New York, v. 23, n. 4, p. 282-296, fall 1995.
VIDAL-SUÁREZ, M. Las alianzas estratégicas globales para la internacionalización: su contribución para la creación de valor en la empresa. Economí_a Industrial, Madrid, n. 333,
p. 49-56, 2000.
X I A , J . Mu t u a l d e p e n d e n c e , p a r t n e r substitutability, and repeated partnership: the survival of cross-border alliances. Strategic Management Journal, Chicago, v. 32, n. 3,
p. 229-253, Mar. 2011.