73
www.fupress.com/pm ISSN (print): 0031-9465
DOI: 10.14601/Phytopathol_Mediterr-16378
Corresponding author: F. Fonseca E-mail: ffonseca@ualg.pt
RESEARCH PAPERS
Genetic variants of Grapevine leafroll-associated virus 2 infecting
Portuguese grapevine cultivars
Filomena FonSeCa1,Filipa eSTeVeS1, margarida TeiXeira SanToS2, João BraZão3 and JoSé eduardo eiraS-diaS3
1 Universidade do Algarve, CIMA. Campus de Gambelas, edifício 7, 8005-139 Faro Portugal
2 INIAV, Quinta do Marquês, 2780-159 Oeiras, Portugal
3 INIAV, Quinta da Almoínha, 2565-191 Dois Portos, Portugal
Summary. Genetic variability of 19 isolates of Grapevine leafroll-associated virus 2 (GLRaV-2) from Portuguese grape-vine cultivars was characterized by sequencing the entire capsid protein (CP) gene of the virus. Global phyloge-netic analysis of the CP gene, which included nucleotide sequences obtained in this study and complete homolo-gous sequences from GenBank, showed segregation of GLRaV-2 variants from Portuguese isolates into three major phylogroups (PN, 93/955 and H4). The novelty of these phylogenetic results is the evidence of well-supported subdivision within H4 as well as within PN, with subgroup PN3 composed exclusively of variants from a Por-tuguese isolate. These findings and the genetic analysis of global phylogroups indicate demographic expansion, mainly within PN and 93/955. Because the existence of a mixture of variants from different phylogroups was de-tected in some of the isolates, a typification assay based on reverse transcription reaction followed by polymerase chain reaction and restriction fragment length polymorphism analysis, was developed to complement molecular detection assay of the virus. This protocol discriminates variants from the phylogroups identified in this study, and is appropriate for routine testing for GLRaV-2.
Key words: Closterovirus, genetic variants, Grapevine leafroll disease, Vitis vinifera.
Introduction
Grapevine leafroll disease (GLRD) is probably the most economically important grapevine disease, responsible for accumulated yield losses of up to 30– 68% during the productive life of vineyards (Walter and Martelli, 1997). It is a widespread disease re-ported in all grape-growing countries (Martelli and Boudon-Padieu, 2006; Fuchs et al., 2009; Golino et al., 2009; Atallah et al., 2012). GLRD delays fruit ripen-ing and reduces soluble solids both in red and white grape varieties, which adversely affects the alcohol content of the resulting musts and results in penal-ties for the producers (Martelli and Boudon-Padieu, 2006; Martinson et al., 2008).
The phloem-limited filamentous viruses associ-ated with GLRD are named grapevine leafroll-as-sociated viruses (GLRaVs). The majority have been classified within the genus Ampelovirus of the Closte-roviridae family, while GLRaV-7 has been provision-ally assigned to genus Velarivirus and GLRaV-2 is placed in genus Closterovirus. Contrary to Beet Yel-low Virus (BYV), the type species of the genus, and the well-studied species, Citrus Tristeza Virus (CTV), GLRaV-2 has no known natural vectors. The ge-nome of GLRaV-2 encompasses nine open reading frames (ORFs) (Zhu et al., 1998). Putative products of ORF1a/1b are methyltransferase (MT), helicase (HEL) and RNA-dependent RNA polymerase. ORF2 encodes a 57 AA protein analogous to a small hy-drophobic protein found in other Closteroviridae, presumably forming transmembrane helices. ORF3 encodes a 65 kDa protein, which is homologous to the HSP70 cellular heat shock protein. The HSP70
homologue (HSP70h) is the defining character in Closteroviridae taxonomy, as it is specific for this fam-ily and is highly conserved. ORF4 encodes a 63 kDa protein homologous to the p64 of BYV and p61 of CTV. It has been shown for CTV that the heat shock protein homolog (HSP70h) and p61 are needed for efficient virion assembly, apparently working in concert (Satyanarayana et al., 2000, 2004). ORF5 en-codes the minor capsid protein (CPm), upstream of the ORF6, which encodes the capsid protein (CP). ORFs 7 and 8 respectively encode proteins P19 and P24, and are similar in size and location to those de-scribed in the genomes of other closteroviruses such as BYV (P20, P21). However, no conserved regions have been found between these two genes and the corresponding genes in other closteroviruses.
The taxonomic and genomic characteristics of GLRaV-2, and the fact that some of its isolates are mechanically transmissible to herbaceous hosts (Go-szczynski et al., 1996), a feature not described for the other viruses implicated in GLRD, distinguish GL-RaV-2 from the other GLRaVs. To date, six complete genomic sequences of GLRaV-2 have been deposited at GenBank. Phylogenetic studies have suggested that the virus occurs as divergent molecular variants, segregating either into five (Bertazzon et al., 2010) or six distinct lineages (Jarugula et al., 2010) based on the HSP70h and/or capsid protein genes. Divergent variants were reported to have different pathological properties in reference to the respective phylogenet-ic groupings, ranging from asymptomatphylogenet-ic (Poojari et al., 2013) to symptomatic by inducing leafroll, graft union-incompatibility on sensitive rootstocks, young vine decline and rootstock stem lesion disease (Greif et al., 1995; Bertazzon et al., 2010; Alkowni et al., 2011).
Routine detection of GLRaV-2 has mainly been performed by serological assays targeting the cap-sid protein (reviewed by Bertazzon and Angelini, 2004). For some of the phylogenetic groups, RT-PCR and real-time RT-PCR assays have been developed (Beuve et al., 2007), as well as molecular typification assays based on PCR-RFLP (Bertazzon and Angelini, 2004; Jarugula et al., 2010). Despite the various types of host damage associated with GLRaV-2, this virus is not part of the grapevine certification scheme im-plemented in European Union countries. Although GLRaV-2 is known to occur in grapevine growing European countries, little information is available on its incidence and variability in the vineyards. No
mandatory certification is implemented for this vi-rus with no known vector, and for which the main transmission route is likely to be through vegeta-tive propagation of infected material. Furthermore, epidemiological and evolutionary processes shaping GLRaV-2 genetic variability are poorly documented. This means that vital information on effective dis-eases management measures is lacking. Detailed as-sessment of the incidence and of the genetic struc-ture of field isolates is urgently required, to provide a foundation for evaluating the role of GLRaV-2 in the epidemiology of GLRD. For this purpose nu-cleotide sequences of the capsid protein gene of GL-RaV-2 were obtained from Portuguese field isolates of the virus. A phylogenetic analysis, including com-plete homologous sequences available from other grapevine growing regions, revealed the existence of co-infections by divergent variants in some of the isolates. This information was used to develop a reverse-transcription (RT) followed by polymer-ase chain reaction (PCR)-bpolymer-ased restriction fragment length polymorphism (RFLP) assay to allow routine typing of GLRaV-2 variants detected to date in Por-tugal.
Materials and methods
Plant material and virus sources
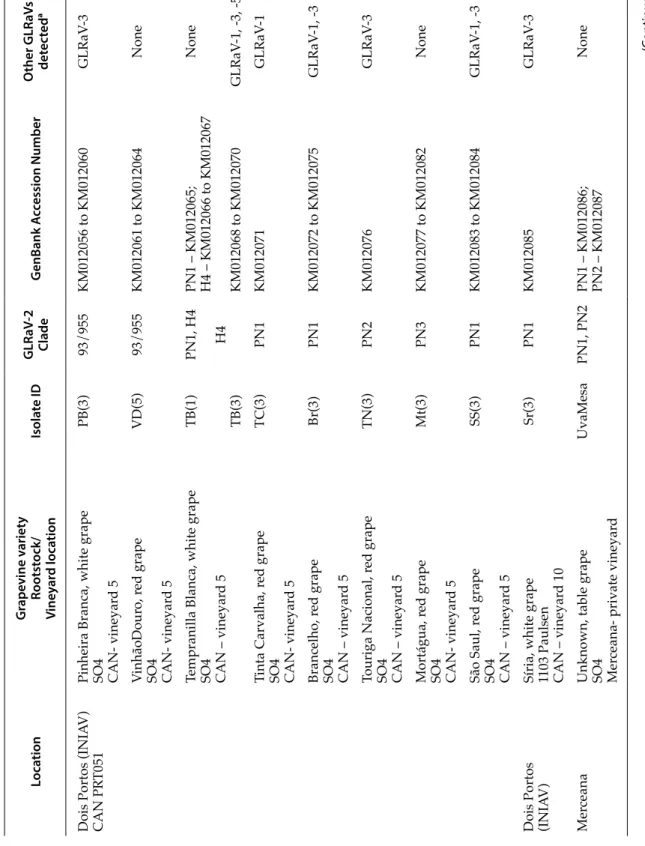
Each of the 19 GLRaV-2 isolates analysed in this study were obtained from different field-grown grapevines (Vitis vinifera; Table 1).
Nine of the isolates were obtained from the National Collection of Grapevine Varieties (CAN PRT051) at INIAV, Dois Portos, Portugal. This collec-tion consists of grafted vines on certified rootstock material (SO4, clone 73). It was established 30 years ago (Teixeira et al., 2009b) on nematode-free soil, and is routinely tested for several viruses, including GL-RaVs, either by DAS-ELISA or RT-PCR. The Collec-tion is also maintained free of mealybugs through insecticide applications. Several clonal plants rep-resent each variety accession at CAN. Virus isolates from each variety were usually obtained from the re-spective clonal plant number 3, with the exception of isolates VD (5) and TB (1), which were obtained from clonal plant number 5 and clonal plant number 1 of the respective variety. Isolate Sr3 was obtained from a grapevine in a production vineyard at INIAV, Dois Portos, planted with the Síria variety grafted on
cer-Table 1.
Details of
Grapevine leafr
oll-associated virus 2
isolates analysed in this study
. Loca tion G rape vine v ariet y Rootst ock/ Vine yar d loca tion Isola te ID GLR aV -2 Clade G enB ank A cc ession Number O ther GLR aV s det ec ted a
Dois Portos (INIA
V)
CAN PR
T051
Pinheira Branca, white grape SO4 CAN- vineyar
d 5 PB(3) 93/955 KM012056 to KM012060 GLRaV -3 VinhãoDour o, r ed grape
SO4 CAN- vineyar
d 5
VD(5)
93/955
KM012061 to KM012064
None
Tempranilla Blanca, white grape SO4 CAN – vineyar
d 5 TB(1) TB(3) PN1, H4 H4 PN1 – KM012065; H4 – KM012066 to KM012067 KM012068 to KM012070 None GLRaV -1, -3, -5 Tinta Carvalha, r ed grape
SO4 CAN- vineyar
d 5 TC(3) PN1 KM012071 GLRaV -1 Brancelho, r ed grape
SO4 CAN – vineyar
d 5 Br(3) PN1 KM012072 to KM012075 GLRaV -1, -3 Touriga Nacional, r ed grape
SO4 CAN – vineyar
d 5 TN(3) PN2 KM012076 GLRaV -3 Mortágua, r ed grape
SO4 CAN- vineyar
d 5 Mt(3) PN3 KM012077 to KM012082 None São Saul, r ed grape
SO4 CAN – vineyar
d 5 SS(3) PN1 KM012083 to KM012084 GLRaV -1, -3
Dois Portos (INIA
V)
Síria, white grape 1103 Paulsen CAN – vineyar
d 10 Sr(3) PN1 KM012085 GLRaV -3 Mer ceana
Unknown, table grape SO4 Mer
ceana- private vineyar
d UvaMesa PN1, PN2 PN1 – KM012086; PN2 – KM012087 None (C on tinued).
Loca tion G rape vine v ariet y Rootst ock/ Vine yar d loca tion Isola te ID GLR aV -2 Clade G enB ank A cc ession Number O ther GLR aV s det ec ted a Algarve
Unknown, white grape Unknown r
ootstock
Mata Lobos – private vineyar
d I MLI(2) PN2, H4 PN2 – KM012088 to KM012089; H4 – KM012090 GLRaV -5
Unknown, white grape Unknown r
ootstock
Mata Lobos – private vineyar
d II MLII(1) PN1 KM012091 to KM012092 GLRaV -3 Unknown, r ed grape Unknown r ootstock Cerr
o do Guilhim – private vineyar
d CG(3) PN1 KM012093 to KM012094 GLRaV -3
Unknown, white grape Unknown r
ootstock
Gambelas – private vineyar
d G(1) G(5) PN1 PN1 KM012095 to KM012100 KM012101 to KM012106 GLRaV -3 GLRaV -3 Unknown, r ed grape Unknown r ootstock
Moncarapacho– private vineyar
d MA(2) MA(3) PN1 93/955 KM012107 to KM012108 KM012109 to KM0121 10 None GLRaV -3 Unknown, r ed grape Unknown r ootstock Bor
deira – private vineyar
d Vv(1) PN1 KM0121 11 to KM0121 14 GLRaV -3 a Detection by first stand cDNA synthesis followed by PCR assays with vir us specific primers (Esteves et al . ,2009a, 2009b; Teixeira Santos et al ., 2009a; Esteves et al . 2012; Esteves et al . ,2013) Table 1. (Continued).
tified 1103 Paulsen rootstock. Isolate UvaMesa was obtained from a commercial vineyard at Merceana, 10 km from Dois Portos.
The remaining eight isolates were collected from field-grown grapevines at various locations in the Algarve (Portugal), in private small-scale vineyards. These sampling sites are located, on average, 350 km from the CAN site. Isolates collected at Gambelas (G1 and G5) and Moncarapacho (MA2 and MA3) were obtained from clonal plants of a different un-known grapevine variety at each site. The maximum distance between sampling sites in the Algarve was 17 km (Gambelas–Moncarapacho), and the mini-mum was 5 km (Cerro do Guilhim-Mata-Lobos).
The presence of GLRaV-1, -3 and GLRaV-4 strain-5 in mixed infections with GLRaV-2 was detected by PCR using virus-specific primers (Esteves et al., 2009a, 2009b; Teixeira et al., 2009a) with each cDNA. Further details of each isolate are provided in Table 1.
RNA extraction
Total plant RNA was extracted with an E.Z.N.A.TM Plant RNA Kit (Omega Bio-Tek, USA), with the al-terations to the manufacturer’s protocol as reported previously (MacKenzie et al., 1997). Based on routine testing of the CAN plants (Teixeira et al., 2009b), and to ensure that the procedures produced uniform and comparable samples, the starting material for each isolate was obtained by pooling leaf veins and petioles from at least six fully expanded leaves from different branches of each plant for RNA extraction. Sampling took place in 2012, from the grapevine growth stages of pea-sized-berry to the onset of the véraison. Sam-ples composed of 700 mg fresh leaf veins and petioles were ground in liquid nitrogen and extraction buffer (4 M guanidine thiocyanate, 0.2 M sodium acetate, pH 5.0, 25 mM EDTA, 2.5% PVP-40 [w/v] and 1% 2-mer-captoethanol [v/v]) was added at 1:3 (w/v). One mL of the homogenate was collected, and 100 μL of 20% sarcosyl was added. Samples were incubated at 70°C for 10 minutes with occasional shaking and then cen-trifuged at room temperature at 10 000 × g for 10 min. The kit manufacturer’s instructions were followed from this point on. RNA extraction was conducted in duplicate for each sample.
cDNA synthesis and PCR
Synthesis of cDNA using an iScript cDNA First Strand Synthesis Kit™ (Bio-Rad, USA) was achieved
according to the manufacturer’s protocol using 5 μL of total RNA.
PCR reactions were performed in a final volume of 50 μL with Pfu DNA polymerase (Thermo Fisher Scientific Inc., USA), using 3 μL of the first-strand reaction mixture. A primer pair was designed in this work (CP2-1: 5'-TCT AGG GAG GTA CTA AGC ACG-3' and CP2-2: 5'-GCT CAA CAC TAG CAT CA/T /CGA C/TT-3') based on GenBank accessions of complete genomes of previously reported vari-ants from different phylogenetic lineages: AF039204, FJ43623, JQ771955, JX669644 and Y14131 for PN, NC007448 for 93/955, DQ286725 for BD, AF314061, JX513891 and EF012720 for RG and EF012721 for PV20. A 779 bp fragment was amplified, between nucleotides 14493 and 15271 of sequence NC007448, comprising the 3' end of P25 (CPm, ORF 5) and inter-genic region (84 nt), the complete coding sequence of the CP (597 nt, ORF 6) and the 5' end of P19 (98 nt, ORF 7). PCR amplifications included an initial dena-turation at 95°C for 3 min followed by 30 cycles of 95°C for 30 s, 48°C for 30 s, 72°C for 1 min, and a final extension at 72°C for 10 min. Electrophoretic analy-sis of PCR products were done using 1.5% agarose gels stained with GreenSafe (NZYTech, Portugal). Fragments were visualized under UV light.
The above procedures were conducted separately for the two RNA extracts obtained for each sample. Amplicons of the CP gene obtained from the two ex-tractions were combined before cloning.
Cloning and sequencing
Amplicons of the CP gene obtained from each isolate were ligated using a CloneJETTM PCR Cloning Kit (Thermo Fisher Scientific Inc., USA) and used to transform E. coli XL1Blue (Agilent Technologies Inc., USA) competent cells. The PCR products of at least 16 positive clones per isolate were subsequently ana-lysed by SSCP (single-strand conformation polymor-phism) (Orita et al., 1989) to identify different DNA conformational patterns. For each SSCP pattern detected, at least two recombinant clones (purified plasmid with insert) were obtained using the NZY-Miniprep kit (NZYTech, Portugal), and the insert size was verified by PCR amplification with the re-spective primer pairs, prior to commercial sequenc-ing (STAB VIDA, Portugal).
The different sequence variants obtained per iso-late were deposited at the GenBank database, and their accession numbers are listed in Table 1.
Sequence data analysis
The sequences obtained for each isolate under study were initially aligned using BioEdit Sequence Alignment Editor (BioEdit) (Hall, 1999) and visu-ally screened in order to exclude repeated sequences within isolate. All homologous sequences were re-trieved from GenBank. Sequences were processed with BioEdit, aligned with ClustalW (Thompson et al., 1994), and the alignments corrected by hand. Incomplete sequences were trimmed from the align-ment except those that had been published previ-ously as reference for phylogenetic groups. A final dataset with 107 sequences was obtained, which in-cluded 59 new complete sequences from this work.
The graphic views of the nucleotide sequences alignment and of the corresponding deduced AA se-quences alignment, as well as the Hopp and Woods (Hopp and Woods, 1981) hydrophilicity profile for the CP, were obtained using BioEdit. Phylogenetic trees were constructed using MEGA5 (Tamura et al., 2011). Phylogeny was inferred using the Minimum Evolution method implemented in MEGA5. Boot-strap values were estimated with 1000 replicates, and the tree with the highest log likelihood is pre-sented.
RT-PCR based RFLP typing assay
The alignment of the nucleotide sequences was used to detect unique recognition sites of restriction enzymes for each phylogenetic group inferred, us-ing BioEdit. CP-specific amplicons from the differ-ent isolates analysed in this work, obtained previ-ously by RT followed by PCR, were then subjected to the typing assay using FastDigest (Thermo Fisher Scientific, Inc., USA) restriction enzymes PdmI and BamHI in double digestion reaction, MseI, EcoRI and SspI in single digestion reaction, according to the manufacturer’s instructions. Ten microliters of each amplicon were used per restriction reaction. The DNA fragments were resolved on 2% agarose gels stained with ethidium bromide and visualized under UV light.
Estimates of evolutionary divergence and selection pressure
Estimates of average evolutionary divergence were made using MEGA5 with specific substitution models. The rates of synonymous and
non-synon-ymous substitutions per site were estimated by the algorithms for single likelihood counting (SLAC), fixed-effects likelihood (FEL), internal fixed-effects likelihood (IFEL) and random-effects likelihood (REL), using the HKY85 nucleotide substitution bias model (Hasegawa et al., 1985) from the Datamonkey webserver (Kosakovsky Pond and Frost, 2005) of the HyPhy package (Kosakovsky et al., 2005). Mean dN/ dS values were calculated.
Evolutionary analyses included Tajima’s D test of neutrality (Tajima, 1989) and the test of natural selec-tion, G-test statistics, of the McDonald-Kreitman test (McDonald and Kreitman, 1991), both performed with DnaSP software v. 5.10.01 (Librado and Rozas, 2009). Tajima’s D test was used to estimate the cor-relation between the number of segregating sites and the average nucleotide diversity. The McDon-ald-Kreitman test was used to determine the ratio of the number of polymorphic non-synonymous to synonymous differences to the ratio of the number of fixed non-synonymous to synonymous differences between GLRaV-2 isolates.
Recombination analyses
Detection of evidence of putative recombination events in the CP gene sequences was performed with the genetic algorithms for recombination detection (GARD) available on the Datamonkey webserver (Kosakovsky Pond et al., 2006) and also using the RDP v.3 alpha44 software (Heath et al., 2006) and as-sociated programs package.
Results
Diversity of the capsid protein gene sequence variants within GLRaV-2 isolates
Primers CP2-1 and CP2-2 amplified a DNA frag-ment of approximately 779 bp, encompassing the entire sequence of the CP gene (597 nt) and includ-ing, respectively, 84 and 98 bp upstream and down-stream of the CP. These primers were degenerate at variable sites, based on the alignment of available se-quences, in order to allow amplification of all variant types known to date. The amplicons obtained were specific to GLRaV-2, based on cloning and sequenc-ing as described below.
A total of 19 GLRaV-2 isolates were analysed in this study. Co-infections with other
leafroll-associat-ed viruses were detectleafroll-associat-ed in the majority of the iso-lates, the most common of which was with GLRaV-3 (Table 1).
Assessment of the molecular variability of GL-RaV-2 present in each isolate was based on the CP gene. Cloning of the amplicons, followed by SSCP analysis and sequencing, revealed the presence of divergent sequence variants within the isolates, with the exception of isolates TC(3), TN(3), Mt(3) and Sr(3) from CAN (Table 1), for which only one sequence type was detected.
GLRaV-2 variants isolated from Portugal comprise five phylogroups
The phylogenetic relationships of GLRaV-2 iso-lates were assessed among themselves and with cor-responding sequences from other grapevine growing regions. This analysis, using the minimum evolution (ME) method, included 59 sequences from this work and 48 available at GenBank obtained from other ge-ographic regions. Global sequences of GLRaV-2 CP gene segregated into six major phylogenetic groups (Figure 1). At least one reference isolate from the phylogenetic lineages proposed previously (Meng et al., 2005; Fuchs et al., 2009; Bertazzon et al., 2010; Jarugula et al., 2010) could be found in each of the six lineages, and hence the standardized nomenclature was maintained. However, two of the major phy-logroups were each composed of three subgroups: PN1, PN2 and PN3 in the case of the PN lineage and San, CS and CNP for the H4 lineage. Stability of the phylogenetic tree topology was supported by bootstrap values >75% at each node. In keeping with the nomenclature used for the PN lineage, we opted to name PN3 the new subgroup with the se-quences from the Portuguese isolate Mt (3), although this designation had been used previously for the 93/955 type variants, found clustering in the PN lin-eage. (Bertazzon et al., 2010). However, in view of the evidence presented, no confusion should subsist. In turn we suggest the designation of CNP for the H4 new subgroup, based on the initials of the variants reported previously (Can, Ner and Pol).
Sequences obtained from the Portuguese isolates were thus placed in subgroups PN1, PN2 and PN3 of the PN lineage, in group 93/955 and in subgroup CNP of the H4 lineage. A great number of sequences (35/59) were found in the PN1 group, followed by the 93/955 group. Three of the isolates harboured a
mixture of sequences: from groups PN1 and H4 [TB (1)], from groups PN1 and PN2 (UvaMesa), and from groups PN2 and H4 [ML1 (2)].
Genetic analysis of global phylogroups
Mean distance between the sequences retrieved from the Portuguese isolates was 0.056 ± 0.006 (data not shown on table), and a value of 0.101 ± 0.022 was estimated between sequences from global isolates. The population genetic parameters for each major phylo-group considered are listed in Table 2A. Haplotype diversity (Hd) values for CP sequences were close to 1.000. Values of within group evolutionary divergence over sequence pairs (d) ranged from 0.005 for PN1 to 0.052 for H4. Nucleotide polymorphisms in GLRaV-2 CP groups were evaluated using Tajima’s D (Tajima, 1989) statistical test to assess the influence of demo-graphic forces on each population. A negative D sta-tistic can indicate a selective sweep and allelic fixation driven by natural selection. The significantly negative values of Tajima’s D found for lineages PN (subgroups PN1 and PN2) and 93/955 discount the neutral hy-pothesis but suggest the occurrence of demographic expansion of GLRaV-2 populations in those groups. A positive D statistic, although not significant (P>0.1), was found in the case of the H4 and subgroup San. A positive D statistic is usually interpreted as indicat-ing balancindicat-ing selection but can also be obtained when variants from more than one population are sampled. The latter is probably the case here, as sequences in phylogroup San carry evidence of further population subdivision (Figure 1) and sequence H4 (AY697863) was retrieved from V. rupestris St. George.
Intergroup sequence divergence (Table 2B) be-tween PN, 93/955 and H4 lineages were 0.081 to 0.122, and between BD, RG and PV20 were 0.221 to 0.286. High levels of divergence were also found when comparing PN, 93/955 and H4 with BD, RG and PV20 (0.232 to 0.274).
To assess if natural selection acting on the protein coding sequences could be responsible for the diver-gence between isolates, a McDonald-Kreitman (MK) test (McDonald and Kreitman, 1991) was performed. The MK test compares the levels of diversity at neu-tral sites and potentially functional sites with the respective levels of divergence, to evaluate whether neutral evolution can be rejected at the functional sites. Because only synonymous substitutions could be found between groups PN1, PN2 and PN3, the G
G(5)-18 MLII(1)-4 Br(3)-12 G(1)-22 TC(3)-3 G(1)-19 TB(1)-4 MLII(1)-3 UvaMesa-4 G(1)-23 G(5)-20 G(5)-4 Br(3)-1 G(5)-3 G(1)-14 Br(3)-16 FJ436234 OR1 USA CG Br(3)-5 Br(3)-8 G(5)-16 Sr(3)-5
AF039204 Pinot Noir CG JX559644 3138-07 Canada CG MA(2)-14 G(1)-17 Vv(1)-2 MA(2)-26 CG(3)-5 JQ771955 OR2 USA CG Vv(1)-9 Vv(1)-7 CG(3)-4 Vv(1)-10 SS(3)-3 SS(3)-6 G(1)-13 G(5)-23 PN1 UvaMesa-3 HQ162291 by China KC477191 HB-2 Carmenere China DQ314609 Tuc Italy
KC477190 BJ Yatomi Rosa China DQ314591 IsP USA MLI(2)-2 MLI(2)-4 KC477192 GS Takatsuma China HQ162297 tr China DQ911147 SL10 China HQ162294 jsz China JN865254 G25 Poland TN(3)-3 DQ314603 Red2 Italy HQ162296 sml China HQ162295 lcla China AY842932 China PN2 Mt(3)-1 Mt(3)-12 Mt(3)-2 Mt(3)-5 Mt(3)-8 Mt(3)-22 PN3 PN AY881628 93/955 SouthAfrica CG MA(3)-9 MA(3)-8 VD(5)-8 DQ314588 Arv1 Italy VD(5)-4 VD(5)-6 VD(5)-10 PB(3)-7 PB(3)-13 PB(3)-9 PB(3)-8 PB(3)-6 93/955 AY697863 H4 FJ195744 Cf USA EU760839 WA-MCU1 Sg USA EU760842 WA-MCU5 Sg USA
San EU760837 WA-ARV4CSauvignon USA EU760844 WA-HHA7CSauvignon USA EU053125 M/C Concord Brazil EU204911 MH MuscatHamb Brazil EU204912 RI Riesling Brazil
CS TB(3)-2 MLI(2)-1 TB(1)-2 TB(3)-1 TB(3)-8 TB(1)-6 DQ314600 Pol2 Italy DQ314597 NerC Italy DQ314589 Can Italy CNP H4 BD RG PV20 99 99 99 99 95 93 91 89 87 99 99 95 99 93 99 99 99 99 99 99 91 88 97
Figure 1. Evolutionary relationships among
glob-al sequence variants of the capsid protein gene of Grapevine leafroll-associated virus 2 (GLRaV-2). The evolutionary history was inferred using the Minimum Evolution method, and the optimal tree with the sum of branch length = 1.30850251 is shown. The percentages of replicate trees in which the associated taxa clustered together in the bootstrap test (1000 replicates) are shown. The evolutionary distances were computed using the Kimura 2-parameter method and are in the units of the number of base substitutions per site. The analysis involved 107 nucleotide sequences. Capsid gene sequences retrieved from complete genome sequences are indicated with the suffix CG. Groups BD, RG and PV20 were collapsed for clarity. Matching black symbols indicate divergent sequence variants obtained from the same isolate.
statistics associated with the MK test could not be determined. However, the Fisher’s exact test (data not shown) revealed significant values between PN1 and PN3 (0.0016) and between PN2 and PN3 (0.0152). The G-test statistics obtained for all the other possible comparisons between phylogroups showed significant differences between the ratios of synonymous to replacement substitutions with good statistical support between PN and lineages BD and RG, and also between BD, RG or H4 and PV20 (G-test statistics and respective significance levels are shown in Table 2(B) upper diagonal). The three subgroups in PN and also phylogroup 93/955 all showed sig-nificant differences in relation to subgroups CS and
CNP in lineage H4. These and the other significant comparisons found in Table 2(B) suggest that natural selection, instead of random processes like isolation or drift, are likely to be driving the evolutionary di-vergence between the groups concerned. However, the majority of the comparisons gave no significant G-test statistics. These results indicate that the ratio of fixed differences to polymorphisms is not signifi-cantly different between synonymous and non-syn-onymous changes, and, consequently, that random processes together with natural selection are likely to be driving the evolutionary divergence of those phy-logroups. Such would be the cases of comparisons involving subgroup San, except with PV20.
Table 2. (A) Genetic distance within phylogroups and (B) differentiation between phylogroups of Grapevine
leafroll-associat-ed virus 2, and summary of test statistics examinleafroll-associat-ed for demographic trends.
(A) Genetic distance and test of neutrality within groupsa
Phylogroupb # variants dc Sc Hdc Tajima’s Dd P value
PN 61 0.014±0.002 59 0.912 -1.86639 P<0.05 PN1 37 0.005±0.001 35 0.858 -2.62468 P<0.001 PN2 18 0.008±0.001 19 0.848 -2.07886 P<0.01 PN3 6 0.006±0.001 11 1.000 -1.44477 0.1>P>0.05 93/955 13 0.007±0.002 20 0.990 -1.87631 P<0.05 H4 18 0.052±0.005 56 0.971 0.15168 P>0.1 San 4 0.048±0.008 27 0.833 1.94266 P>0.1 CS 5 0.002±0.001 1 1.000 ND CNP 9 0.008±0.002 14 1.000 -1.60365 0.1>P>0.05 BD 2 0.008±0.004 5 1.000 ND RG 11 0.037±0.004 68 1.000 -1.77595 P<0.05 PV20 2 0.051±0.008 30 1.000 ND All 107 0.099±0.005 202 0.957 -1.03801 P>0.1
a (A) Average evolutionary divergence analysis was conducted in MEGA5 using gene-specific substitution models (Tamura et al., 2011),
and codon positions included were 1st-2nd-3rd noncoding. Positions containing gaps and missing data were treated as a complete dele-tion.
b Phylogroups are as defined in Figure 2.
c d: Average evolutionary divergence; S: number of segregating sites; Hd: Haplotype diversity.
Results are based on the pairwise alignment of 107 CP gene sequences. Standard error estimates were obtained by a bootstrap proce-dure (1000 replicates).
d Tajima’s D statistic as a measure of the departure from neutrality for all mutations in the genomic region (Tajima, 1989) was performed
using the DnaSP software version 5.10.11 (Librado and Rozas, 2009). The D test is based on the differences between the number of segregating sites and the average number of nucleotide differences. The DnaSP software provides a measure of significance of the D value. Values for neutrality tests were not significant for phylogroups H4 and RG and when all sequences were considered. ND = not determined due to lack of sufficient data.
Table 2. (A) Genetic distance within phylogr oups and (B) differ entiation between phylogr oups of Grapevine leafr oll-associated virus
2, and summary of test
statistics examined for demographic tr
ends.
(B) Differ
entiation between GLRaV
-2 phylogr
oups and test of natural selection
a Ph ylog roup b PN 93/955 H4 BD RG PN1 PN2 PN3 San CS CNP PN ... ... ... ... 3.092ns 2.816ns 2.261ns 6.575* 8.536** 3.855* 4.363* PN1 ... ... NP NP 6.544* 3.564ns 2.871ns 9.644** 12.330*** 5.539* 4.453* PN2 ... 0.023±0.005 ... NP 4.703* 1.258ns 0.389ns 2.550ns 10.230** 3.908* 1.197ns PN3 ... 0.035±0.007 0.032±0.006 ... 7.485** 1.528ns 0.678ns 8.497** 11.857*** 7.735** 1.026ns 93/955 0.081±0.010 0.081± 0.010 0.081±0.010 0.078±0.010 ... 1.277ns 0.019ns 4.984* 9.499** 3.704ns 0.230ns H4 0.1 17±0.01 1 0.1 17±0.01 1 0.1 14±0.01 1 0.123±0.01 1 0.122±0.010 ... ... ... ... 0.271ns 0.390ns San 0.123±0.012 0.124±0.012 0.120±0.012 0.133±0.012 0.129±0.013 ... ... 1.135ns 0.145ns 0.522ns 0.01 1ns CS 0.1 12±0.012 0.1 13±0.012 0.106±0.012 0.1 16±0.012 0.109±0.012 ... 0.067±0.009 ... 6.741** 0.371ns 0.238ns CNP 0.1 12±0.012 0.1 12±0.012 0.1 15±0.012 0.122±0.012 0.121±0.012 ... 0.087±0.010 0.043±0.009 ... 2.763ns 0.850ns BD 0.251±0.016 0.252±0.016 0.249±0.016 0.245±0.016 0.232±0.016 0.241±0.015 0.238±0.015 0.231±0.016 0.244±0.016 ... 3.989* RG 0.240±0.016 0.241±0.017 0.235±0.017 0.226±0.016 0.237±0.016 0.233±0.016 0.236±0.017 0.232±0.017 0.233±0.016 0.221±0.016 ... PV20 0.274±0.017 0.273±0.018 0.273±0.017 0.280±0.017 0.271±0.017 0.265±0.017 0.278±0.017 0.260±0.017 0.260±0.017 0.286±0.017 0.282±0.017 a
(B) Lower diagonal: values of comparisons
between gr
oups; upper diagonal: G-value of G statistics of the McDonald-Kr
eitman test. The G statistics
of the McDonald-Kr eitman test (MKT) was used to test for evidence that diver gence in GLRaV -2 lineages is driven by natural selection: *** P<0.001; **0.001< P<0.01; * 0.01< P<0.05; NP: G test could not be performed because non-synonymous substitutions between gr oups =0; ns: not significant. MKT was performed using DnaSP softwar e version 5.10.01
(Librado and Rozas, 2009).
b
Phylogr
oups ar
e as defined in Figur
Selection constraints on the CP gene
The CP gene sequence dataset was analysed with the aid of the RDP v.3 alpha44 software and Data-monkey web interface (Kosakovsy Pond and Frost, 2005; Kosakovsy Pond et al., 2005; Kosakovsy Pond et al., 2006). No evidence of recombination was detect-ed and the tree constructdetect-ed by the web interface was used to compute mean dN/dS values in order to ana-lyse the types of evolutionary forces at play. Overall values obtained (Table 3) considering all sequences in the alignment were less than for the sequences ob-tained in this work. The greater value was obob-tained for phylogroup 93/955. Nevertheless, the values found indicated that the CP gene is under purifying selection in each of the phylogroups considered.
Examination of the alignments of nucleotide and deduced amino acid sequences of the CP (data not shown) revealed that variants in each major phylo-group share a characteristic pattern of nucleotides or residues substitutions. However, these are mainly silent substitutions between phylogroups PN1, PN2 and PN3. For groups 93/955 and H4, non-synony-mous substitutions accumulate mainly in the N-ter-minal half of the protein, whereas for the remaining groups those are concentrated between AA70 and AA130. The hidrophylicity profiles of GLRaV-2 CP variants (Figure 2) were not altered by the AA sub-stitutions.
RT-PCR-based RFLP protocol for isolate typing
Following an in silico analysis of overall GL-RaV-2 CP gene sequences alignment with the aid of BioEdit, five restriction enzymes were used to obtain RFLP profiles of the 19 isolates analysed in this study. A molecular typing assay based on RT followed by PCR-based RFLP was implemented for discrimination of variants from phylogroups PN1, PN2, PN3, 93/955 and H4, documented in the Portuguese isolates. Although the variants found in lineage H4 were all in subgroup CNP, it was not possible to set up an assay suitable to discriminate between these and variants in the other two sub-groups.
The DNA fragments amplified with the primer pair designed in this work were each submitted to double digestion with PdmI and BamHI and to single digestions with MseI, EcoRI and SspI, and resolved by agarose gel electrophoresis. The re-striction profiles observed confirmed the expected phylogroup-specific pattern of the fragments ob-tained, as shown in Figure 3. This figure also shows the typification results for isolates TB (1), UvaMesa and MLI (2), harbouring sequence variants from more than one phylogroup. For TB (1) the complete digestion using PdmI and BamHI reveals the 504 and 587 bp fragments identifying the presence re-spectively of PN1 and PN2. For UvaMesa and MLI
Table 3. Estimates of selection pressures acting on the CP gene of Grapevine leafroll-associated virus 2.
Population
Mean dN/dS Selection pressurec
Log(L) Mean PositiveN (%) NegativeN (%) NeutralN (%)
Alla -4184.26 0.133 1 0.2 120 20.2 473 79.6 Allb -1888.43 0.206 1 0.2 38 6.4 555 93.4 PN -1587.74 0.328 1 0.2 23 3.9 570 95.9 93/955 -971.4 0.354 0 0 3 0.5 591 99.5 H4 -1276.78 0.104 0 0 29 5.6 565 94.4 RG -1225.4 0.169 4 0.7 10 1.7 580 97.6
Mean dN/dS values <1 indicate negative or purifying selection, dn/dS values = 1 suggest neutral selection, and dN/dS values >1 indicate positive selection for each gene-specific dataset.
a Dataset represented by 107 sequences with 198 codons.
b Dataset represented by 59 sequences from this work with 198 codons.
c Positively or negatively selected sites are identified by at least one of the three selection pressure detection methods: single likelihood
ancestor counting (SLAC), fixed effects likelihood (FEL) and internal fixed effects likelihood (IFEL). SLAC is a counting method, while the other two are likelihood methods (Kosakovsky Pond and Frost, 2005).
(2), the presence of PN1 in the first and PN2 in the second is indicated by the 587 and the 504 bp frag-ments in the double digestion assays, whereas H4 is identified by the 306 and 473 bp fragments obtained by digesting with SspI. For both of these isolates the restriction is complete in the assay with MseI, pro-ducing the expected fragments, demonstrating that the presence of variants from another group was not being masked in the other incomplete restriction as-says. In any case, these situations could be further confirmed by setting up double restrictions assays, respectively with PdmI + SspI and BamHI + SspI (data not shown).
Although we did not test this assay with isolates known to harbour variants from the BD, RG or PV20 groups, it is foreseeable that these will remain uncut since the available sequences lack any of the restric-tion sites at the posirestric-tions indicated, exclusive to the restriction enzymes chosen. Considering that the typification results were congruent with the cloning and sequencing results, and that the primers used to obtain the amplicons were designed to cover variant diversity in the annealing regions, no variants from groups BD, RG and PV20 were detected in the Por-tuguese isolates.
Discussion
The molecular diversity of field isolates of GL-RaV-2 in grapevine cultivars grown in Portugal were assessed relative to virus isolates from other grape growing regions. The comparative results show that the genetic diversity of this virus is great in Portugal, with the sequences we retrieved clustering in three of the major phylogroups, and also mixed infec-tions from different lineages can occur in individual plants. These were found both in the CAN acces-sions and in plants from private vineyards. This is neither common nor expected for this virus, given the lack of evidence for a natural vector. It is com-monly accepted that a bias toward purifying selec-tion, i.e. selection that results in reduced frequency of new variants, purging deleterious variations that arise, should be detected in the CP region of insect-vectored viruses (Chare and Holmes, 2004; Rubio et al., 2001), through a low dN/dS value and abun-dance of negatively selected codon sites. Our analy-sis showed differences in the dN/dS values between the major phylogroups. However, a moderate to low percentage of negatively selected codon sites was generally detected, hence not revealing signs of se-lection constraints related to a biological vector. In
Hopp & Woods Scale Mean Hydrophilicity Profile Scan-window size = 15 Position100 110 120 130 140 150 160 170 180 190 90 80 70 60 50 40 30 20 10 0 M ean H ydr ophi lic ity 1.2 0.9 0.6 0.3 0 -0.3 -0.6 -0.9 -1.2 -1.5
Figure 2. Hydrophilicity profile for the capsid protein of Grapevine leafroll-associated virus 2 (GLRaV-2). Sequences from
phy-logroups in Figure 1 are shown. The average antigenicity values are plotted versus position along the amino acid sequence. The x-axis contains 198 increments, each representing an amino acid. The y-axis represents the range of hydrophilicity values (from 3 to -3.4) (Hopp and Woods, 1981).
1000bp 500 bp
M
PN
1
PN
2
PN
3
93/
955
H4 M PN
1+
PN
2
PN
1+
H4
PN
2+
H4
M
Figure 3. Reverse-transcription followed by polymerase chain reaction and restriction length polymorphism
(RT-PCR-RFLP) analysis of capsid protein gene fragments obtained from isolates of Grapevine leafroll-associated virus 2 (GLRaV-2), composed of variants from phylogroups PN1, PN2, PN3, 93/933 H4, and mixed infections with PN1+PN2, PN1+H4 and PN2+H4. DNA fragments were digested with enzymes A – PdmI and BamHI, B- MseI, C-EcoRI and D – SspI, and resolved on 2% agarose gel. Lane M shows GeneRuler 100 bp Plus DNA Ladder 100 to 3000 bp (Thermo Scientific Inc., USA) for estimating the size of the DNA fragments obtained – the size of the bands corresponding to 500 and 1000 bp fragments of the markers are indicated to the left. The typification fragments for each phylogroup are indicated by arrows on the gel and also in bold in the table on the right.
this scenario, a possible explanation for the existence of GLRaV-2 as quasi-species may relate to the sani-tary status of the initial source of scions and root-stocks. Other genes need to be analysed to provide complete understanding of the evolutionary pres-sures underlying the variability of GLRaV-2.
The number of major phylogroups and respec-tive compositions suggested in our work does not agree with that found previously by Bertazzon et al. (2010). They described the phylogeny of GLRaV-2 based on 388 bp fragments of the CP, as composed of five phylogroups, positioning the 93/955 type vari-ants as one of the three subgroups in PN lineage, de-signed as PN3. The phylogenetic analysis conducted by Jarugula et al. (2010), based on the HSP70h and CP genes, suggested the existence of six major lin-eages, recognizing the 93/955 type as a separate group and the H4 lineage, for which new sequences were available, as composed of the subgroups San and CS. However, these authors did not consider the seventeen CP gene sequences they analysed for the PN lineage, being segregated into subgroups.
In our study, phylogenetic inference was based solely on the CP gene, but the six major phylogroups obtained agree with the findings of Jarugula et al. (2010). However, we have considered the subdivi-sion of PN into three groups, one of which (PN3) composed entirely of new sequence variants ob-tained from a single Portuguese isolate, and also the inclusion of a third subgroup (CNP) in lineage H4, based on existing evidence and sequences obtained in this study. This topology is supported by high bootstrap values (>75%). Examination of the genetic distance between groups revealed that these values are considerably greater than those within each phy-logroup (Table 2), which further supports our phylo-genetic inference.
As observed with GLRaV-2 previously (Jarugula et al., 2010), and usually reported for other grapevine GLRaVs (Alabi et al., 2011; Esteves et al., 2012; Esteves et al., 2013) and for Grapevine fanleaf virus (GFLV) (Vigne et al., 2004), clustering patterns of global vari-ants do not seem to be related to geographical origin. This scenario, in which apparently geographically unrelated variants group together, is not strange for a long-lived crop such as grapevine. Worldwide exchange of propagating material between wine-producing countries has occurred repeatedly to the point of overcoming any natural dispersion bounda-ries, even when geographically distant regions are
compared. In the present case, the PN lineage is the one for which more evidence is available and which is more diverse in terms of geographical attribution (Asia, Europe, North and South America). Bertazzon et al. (2010) attempted a description of the different pathological properties according to phylogenetic grouping. Based on the data they collected, it could be argued that the absence or attenuation of visual GLD symptoms may have contributed to the world-wide distribution of PN variants, whereas the more conspicuous effects produced by the other types (strong leafroll symptoms produced by 93/955 and H4 variants; graft incompatibility syndrome associ-ated with RG variants) have caused a sustained se-lection against their distribution.
Given the knowledge that all recognized vari-ant types are capable of inducing different degrees of damage and crop loss, the need for reliable vi-rus detection and robust variant typification assays becomes evident. Bertazon and Angelini (2004) re-viewed the efficiency of commercial DAS-ELISA kits available from different sources, and found conflict-ing results. Other detection assays have included RT-PCR, with a wide array of different primer pairs tested by different authors, and one-step real-time RT-PCR (Beuve et al., 2007). Typification based on phylogenetic inference, has relied on PCR-RFLP as-says. These have targeted the PN, BD and RG line-ages (Angelini et al., 2004; Jarugula et al., 2010) and also the H4-San and H4-CS subgroups (Angelini et al., 2004). Given the variability found in the Portu-guese isolates, a RT followed by PCR-RFLP assay was set up to identify the presence of variants from lineages 93/955 and H4 and from subgroups PN1, PN2, PN3 of the PN lineage. Our results showed that even in the mixtures containing divergent variants it was possible to obtain a clear typification of the line-ages present. This is also the first RFLP-based assay including the 93/955 lineage. Regarding subgroup PN3, only sequences from the Portuguese isolate Mt (3) are currently available. Our contribution comple-ments the existing typification assays, in agreement with the updated phylogenetic inference of GLRaV-2 variants, and is suitable to be implemented in future certification programmes.
In conclusion, our study has shown that geneti-cally distinct isolates of GLRaV-2 are present in Por-tugal, both in the CAN cultivars established for more than 30 years, and in field grown grapevines. The in-formation gathered in this study extends the
knowl-edge on the diversity of this virus and provides a background for further analysis of the dynamics of evolution within the different lineages. The update of the global diversity and phylogeny of GLRaV-2 makes a contribution to advance molecular proto-cols for detection and typification of this virus, as shown by the proposed PCR-RFLP assay.
Acknowledgements
This research and Ms. Filipa Esteves (MSc.) were financed by research projects PTDC/AGR-AAM/65094/2006 and PTDC/AGR-ALI/109869/ 2009 from Fundação para a Ciência e Tecnologia, Portugal.
Literature cited
Abou Ghanem-Sabanadzovic N., S. Sabanadzovic, M.A. Cas-tellano, D. Boscia and G.P. Martelli, 2000. Properties of a new isolate of grapevine leafroll-associated virus 2. Vitis 39, 119–121.
Alabi O.J., M.A. Rwahnih, G. Karthikeyan, S. Poojari, M. Fuchs, A. Rowhani, and R.A. Naidu, 2011. Grapevine leaf-roll-associated virus 1 occurs as genetically diverse popu-lations. Phytopathology 101, 1446–1456.
Alkowni R., Y.P Zhang, A. Rowhani, J.K. Uyemoto, and A. Mi-nafra, 2011. Biological, molecular, and serological studies of a novel strain of Grapevine leafroll-associated virus 2.
Virus Genes 43, 102–110.
Angelini E, N. Bertazzon and M. Borgo, 2004. Diversity among Grapevine leafroll-associated virus 2 isolates detected by heteroduplex mobility assay. Journal of Phytopathology 152, 416–422.
Atallah S.S., M.I. Gómez, M.F. Fuchs and T.E. Martinson, 2012. Economic impact of grapevine leafroll disease on Vitis
vin-ifera cv. Cabernet franc in Finger Lakes Vineyards of New
York. American Journal of Enology and Viticulture 63, 73–79. Bertazzon N. and E. Angelini, 2004. Advances in the detection
of Grapevine leafroll-associated virus 2 variants. Journal of
Plant Pathology 86, 283–290.
Bertazzon N., M. Borgo, S. Vanin and E. Angelini, 2010. Ge-netic variability and pathological properties of Grapevine Leafroll-associated Virus 2 isolates. European Journal of
Plant Pathology 127, 185–197.
Beuve M., L. Sempé and O. Lemaire, 2007. A sensitive one-step real-time RT-PCR method for detecting Grapevine leafroll-associated virus 2 variants in grapevine. Journal of
Virological Methods 141, 117–124.
Chare E.R. and E.C. Holmes, 2004. Selection pressures in the capsid genes of plant RNA viruses reflect mode of trans-mission. Journal of General Virology 85, 3149–3157.
Esteves F., M. Teixeira Santos, M.L. Rocha, J.E. Eiras-Dias and F. Fonseca, 2009a. Genetic diversity of Portuguese isolates of Grapevine Leafroll-associated Virus 1 (GLRaV-1) based
on the capsid protein. In: Extended abstracts 16th meeting of ICVG, Dijon, France, pp. 310–311.
Esteves F., M. Teixeira Santos, M.L. Rocha, J.E. Eiras-Dias and F. Fonseca, 2009b. Genetic variability of Grapevine Leaf-roll-associated Virus 2 (GLRaV-2) in a Portuguese vine-yard based on the HSP70h and capsid protein genes. In: Extended abstracts 16th meeting of ICVG, Dijon, France, pp. 312–313.
Esteves F., M. Teixeira Santos, J.E. Eiras-Dias and F. Fonseca, 2012. Occurrence of grapevine leafroll-associated virus 5 in Portugal: genetic variability and population structure in field-grown grapevines. Archives of Virology 157, 1747– 1765.
Esteves F., M. Teixeira Santos, J.E. Eiras-Dias and F. Fonseca, 2013. Molecular data mining to improve antibody-based detection of Grapevine leafroll-associated virus 1 (GL-RaV-1). Journal of Virological Methods 194, 258–270. Fuchs M., T.E. Martinson, G.M. Loeb and H.C. Hoch, 2009.
Survey for the three major leafroll disease-associated vi-ruses in Finger Lakes vineyards in New York. Plant Disease 93, 395–401.
Golino D.A., J. Wolpert, S.T. Sim, J. Benz, M. Anderson and A. Rowhani, 2009. Virus effects on vine growth and fruit components of three California ‘heritage’ clones of cab-ernet sauvignon. In: Extended abstracts 16th meeting of ICVG, Dijon, France, p. 243.
Goszczynski D.E., G.G.F. Kasdorf, G. Pietersen and H. van Tonder, 1996. Detection of two strains of grapevine leaf-roll-associated virus 2. Vitis 35, 133–135.
Greif C., R. Garau, D. Boscia, V.A. Prota, M. Fiori, P. Bass, B. Walter and U. Prota, 1995. The relationship of grapevine leafroll-associated closterovirus 2 with a graft incompat-ibility condition of grapevine. Phytopathologia Mediterranea 34, 167–173.
Hall T.A., 1999. BioEdit: a user-friendly biological sequence alignment editor and analysis program for Windows 95/98/NT. Nucleic Acids Symposium Series 41, 95–98. Hasegawa M., H. Kinshino and T.A. Yano, 1985. Dating of the
human-ape splitting by a molecule clock of a mitochon-drial DNA. Journal of Molecular Evolution 22, 160–174. Heath L., E. van der Walt, A. Varsani and D.P. Martin, 2006.
Re-combination patterns in aphthoviruses mirror those found in other picornaviruses. Journal of Virology 80, 11827–11832. Hopp T.P. and K.R. Woods, 1981. Prediction of protein anti-genic determinants from amino acid sequences.
Proceed-ings of the National Academy of Sciences USA 78, 3824–3828.
Jarugula S., O.J. Alabi, R.R. Martin and R.A. Naidu, 2010. Genetic variability of natural populations of Grapevine leafroll-associated virus 2 in Pacific Northwest vineyards.
Phytopathology 100, 698–707.
Kosakovsky Pond S.L. and S.D.W Frost, 2005. Datamonkey: rapid detection of selective pressure on individual sites of codon alignments. Bioinformatics 21, 2531–2533.
Kosakovsky Pond S.L., S.D.W. Frost SDW and S.V. Muse, 2005. HyPhy: hypothesis testing using phylogenies.
Bioinformat-ics 21, 676–679.
Kosakovsky Pond S.L., D. Posada, M.B. Gravenor, C.H. Woelk and S.D. Frost, 2006. GARD: a genetic algorithm for re-combination detection. Bioinformatics 22, 3096–3098.
Librado P. and J. Rozas, 2009. DnaSP v5: a software for com-prehensive analysis of DNA polymorphism data.
Bioinfor-matics 25, 1451–1452.
MacKenzie D.J., M.A. McLean, S. Mukerji and M. Green, 1997. Improved RNA extraction for woody plants for the detec-tion of viral pathogens by reverse transcripdetec-tion-polymer- transcription-polymer-ase chain reaction. Plant Disetranscription-polymer-ase 81, 222–226.
Martelli G.P. and E. Boudon-Padieu, 2006. Directory of infec-tious diseases of grapevines and viroses and virus-like diseases of the grapevine: bibliographic report 1998–2004.
Options Méditerranéennes: Série B. Etudes et Recherches 55,
61–63.
Martinson T.E., M. Fuchs, G. Loeb, and H.C. Hoch. 2008. Grape-vine leafroll: an increasing problem in the Finger Lakes, the US and the world. Finger Lakes Vineyard Notes 6, 6–11. McDonald J.L. and M. Kreitman, 1991. Adaptive protein
evo-lution at the Adh locus in Drosophila. Nature 351, 652–654. Meng B.Z., C.H. Li, D.E. Goszczynski and D. Gonsalves, 2005.
Genome sequences and structures of two biologically dis-tinct strains of Grapevine leafroll-associated virus 2 and sequence analysis. Virus Genes 31, 31–41.
Orita M., H. Iwahana, K. Kanazawa and T. Sekiya, 1989. De-tection of polymorphisms of human DNA by gel electro-phoresis as single stranded conformation polymorphisms.
Proceedings of the National Academy of Sciences USA 86,
2766–2770.
Poojari S., O.J. Alabi and R.A Naidu, 2013. Molecular char-acterization and impacts of a strain of Grapevine
leafroll-associated virus 2 causing asymptomatic infection in a wine
grape cultivar. Virology Journal 10, 324–328.
Rubio L., M.A. Ayllón, P. Kong, A. Fernández, M. Polek, J. Guerri, P. Moreno and B.W. Falk, 2001. Genetic variation of Citrus tristeza virus isolates from California and Spain: evidence for mixed infections and recombination. Journal
of Virology 75, 8054–8062.
Satyanarayana T., S. Gowda , M. Mawassi , M.R. Albiach-Martí , M.A. Ayllón, C. Robertson, S.M. Garnsey and W.O. Dawson, 2000. Closterovirus encoded HSP70 homolog and p61 in addition to both coat proteins function in ef-ficient virion assembly. Virology 278, 253–265.
Satyanarayana, T., S. Gowda, M.A. Ayllón and W.O. Dawson, 2004. Closterovirus bipolar virion: evidence for initiation
of assembly by minor coat protein and its restriction to the genomic RNA 5′ region. Proceedings of the National Academy
of Sciences USA 101, 799–804.
Tajima F., 1989. Statistical method for testing the neutral mu-tation hypothesis by DNA polymorphism. Genetics 123, 585–595.
Tamura K., D. Peterson, N. Peterson, G. Stecher, M. Nei and S. Kumar, 2011. MEGA5: molecular evolutionary genet-ics analysis using maximum likelihood, evolutionary dis-tance, and maximum parsimony methods. Molecular
Biol-ogy and Evolution 28, 2731–2739.
Teixeira Santos M., F. Esteves, M.L. Rocha, J.E. Eiras-Dias and F. Fonseca, 2009a. Comparison of phylogenetic inference based on HSP70, HSP90 and CP genes of GLRaV-3: implications for detection and taxonomy. In: Extended abstracts 16th meeting of ICVG, Dijon, Francem, pp. 276–277.
Teixeira Santos M., M.L. Rocha, A. Guedes da Silva, F. Este-ves, F. Fonseca and J.E. Eiras-Dias, 2009b. Old grapevine varieties vineyards: a window over a pre sanitary selec-tion era and a source of viruses. In: Extended abstracts 16th meeting of ICVG, Dijon, France, pp. 62-63.
Thompson J.D., D.G. Higgins and T.J. Gibson, 1994. ClustalW: improving the sensitivity of progressive multiple se-quence alignment through sese-quence weighting, position-specific gap penalties and weight matrix choice. Nucleic
Acids Research 22, 4673–4680.
Vigne E., M. Bergdoll, S. Guyader, M. Fuchs, 2004. Population structure and genetic variability within isolates of Grape-vine fanleaf virus from a naturally infected Grape-vineyard in France: Evidence for mixed infection and recombination.
Journal of General Virology 85, 2435–2445.
Walter B. and G.P. Martelli, 1997. Clonal and sanitary selection of the grapevine. In: (Walter B., ed.), Sanitary selection of the grapevine: protocols for detection of viruses and vi-rus-like diseases. Paris: Institut National de la Recherche Agronomique, pp. 43–95.
Zhu H.Y., K.S. Ling KS, D.E. Goszczynski DE, J.R. McFerson and D. Gonsalves, 1998. Nucleotide sequence and genome organization of grapevine leafroll-associated virus-2 are similar to beet yellows virus, the closterovirus type mem-ber. Journal of General Virology 79, 1289–1298.
Accepted for publication: December 1, 2015 Published online: May 14, 2016