EXPERIMENTAL QUANTITATIVE EVALUATION OF THERMAL
PERFORMANCE IN REFRIGERATED DISPLAY CABINETS WITH
VARIATION OF AIR CURTAIN THICKNESS AND POROSITY OF THE
BACK PANEL
S. M. NASCIMENTO
(a), G. G. HEIDINGER
(b), P. D. GASPAR
(c), P. D. SILVA
(d)(a)
EletrofrioRefrigeração Ltda, r João Chede, 1599, Cidade Industrial, Curitiba - PR, 81170-220, Brazil
+55 (41) 2105-6097, (a)[email protected]; (b)[email protected]
(b)
University of Beira Interior, Engineering Faculty, Dept. of Electromechanical Engineering, Covilhã, 6201-001, Portugal
+351 275 329 972, (c)[email protected]; (d)[email protected]
ABSTRACT
Open multideck display cabinets are widely used to expose perishable products in supermarkets and convenience stores. This paper reports the results of experimental tests performed according to ISO23953 in a open multideck refrigerated display cabinet to assess the impact on the thermal performance by varying the width of the discharge air grille and the perforation density of the back panel. The experimental laboratory tests were conducted for climate class n.° 3 (25° C and 60%). The results evaluation shows that the perforation density of the back panel and the width of discharge air grille alter significantly the thermal entrainment factor and the energy consumption of the equipment. The best performance configuration showed a 10% reduction of the cooling load. The analysis of the results provides valuable information for the development of these equipments.
1. INTRODUCTION
Since ancient times, man has the need and the will of obtaining cooling ways that make the temperature of foods products to reach a value below the environmental temperature in order to preserve them for longer periods of time. The perishable food products, from production to the final consumer, are preserved and channelled through the system named as cold chain. According to Rigot (1991), the cold chain can be described by five main links: Cold in the production stage; Cold during storage, Refrigerated transportation; Cold in the distribution stage; Home cooling. The fourth link in the cold chain, which is the subject of this paper, is commonly referred as commercial refrigeration by being placed at the trade level. ASHRAE (2010) indicates that the percentage of energy consumed in a typical supermarket due to the refrigeration systems reaches 50%. This energy is consumed by compressors, refrigerated display cabinets, walk-ins and condensers. Among the refrigerated display cabinets installed in a supermarket, which consumes more energy are of the vertical and open type. According to Faramarzi (1999), ASHRAE (2010) and Gaspar et al. (2011), the thermal load due to ambient air infiltration to a vertical open refrigerated display cabinet (ORDC) corresponds respectively to 67% - 77%, 73.5% and 78% - 81% of the total thermal load. This condition results from the low efficiency of the curtain air which forms a physical barrier between the internal and external environments of the equipment.
The work developed by various researchers has focused, for this type of equipment, in qualifying and quantifying the perceptible thermo-physical properties of the jet that provides a cold air curtain. Hayes & Stoecker (1969) developed a correlation that describes the ability of the air curtain to provide a proper separation between environments. The correlation is given by a dimensionless parameter named as deflection modulus, Dm, which is the ratio between the air curtain momentum and the modulus of the transverse forces
caused by temperature difference between the contiguous environments. Faramarzi (1999) determined the relative weight of the total cooling load components for ORDC, composed by the loads from infiltration, radiation, conduction, product pull-down cooling, devices (lights and fans), defrost and anti-sweat heaters, and product respiration. According to EN-ISO 23953 (2005), the total thermal cooling load can be determined by eq. (1).
(1) Chen et al. (2005, 2009, 2011) developed studies using Computational Fluid Dynamics (CFD) codes to evaluate the thermo-physical parameters of the air curtain in ORDC. The performance of air curtain was evaluated by the following dimensionless numbers/parameters: Reynolds number, Grashof number, Richardson number and dimensionless temperature, given by eq. (2) to eq. (5) respectively, for different aspect ratios (height/width) of the air curtain.
(2) (3) (4) (5)
The results provided the following conclusions: There is a range of values of Reynolds number quantifying the flow that can be reduced by reducing the height/width ratio of the air jet for optimal thermal insulation developed by the cold air curtain jet; As the Grashof number provides the fluctuation proportion of the buoyancy force that acts on a viscous fluid in situations involving heat transfer by natural convection while the Richardson number provides the information on the influence of natural convection in relation to forced convection, it is possible to use them for describe the flow. Thus it can be stated that air curtains with small height/width ratio provide a good thermal performance. Navaz et al. (2005) developed further studies using Digital Particle Image Velocimetry (DPIV), focusing mainly in studying the effectiveness of the curtain and maintaining the temperature of food products to a predetermined value. The results evaluation indicates that the Reynolds number has direct effect on the ambient air entrainment into the refrigerated equipment due to its role in the turbulence development. According to Navaz et al. (2005), the best range of values for the Reynolds number in the discharge air grille (DAG) is about 3200-3400. In that study, the authors defined the Thermal Entrainment Factor, TEF, to quantify the thermal entrainment of the air curtain with the ambient air, varying 0 < TEF < 1.
The analysis to the correlation shows that as closer to 0 is TEF, lower is the thermal entrainment with the ambient air. The correlation described by Navaz et al. (2005) does not take into account the air flow through the perforated back panel (PBP). Yu et al. (2009) developed the TEF equation considering this air flow. The new correlation is given by eq. (6) to eq. (8) including the dimensionless temperature given by eq. (5).
(6)
(7)
(8)
The results obtained by Yu et al. (2009) show a good approximation for TEF and temperature value at the return air grille (RAG) with deviations of 0.9% and 0.1 °C respectively. These deviations indicate that the correlation has a good approximation at the engineering level and can be applied in the design of vertical ORDC. Gaspar et al. (2009, 2010, 2011) evaluated the stability of the air curtain for climatic classes n.º 1, n.º 2 and n.º 3 according to EN-ISO 23953 (2005) and other classes beyond the standard. The evaluation was made by experimental testing and numerically using CFD models. The results showed that the ORDC performance strongly depends on the ambient air conditions such as temperature, humidity, velocity and direction of ambient air flow in relation to the ORDC's frontal opening. These authors showed that (1) the cooling load increases with the air temperature and relative humidity of the external environment, (2) the increase of the ambient air velocity increases more significantly the power consumption of the ORDC than the airflow direction change from parallel to perpendicular in relation the frontal opening of the ORDC, (3)
the magnitude of deflection modulus Dm related with minimum momentum required to maintain a stable
curtain of air is between 0.12 and 0.25; (4) the cooling load due to air infiltration is 78% - 81%, which is range closer to the value obtained by Faramarzi (1999) which is of 73.5%, and (5) TEF is not constant along the equipment length for parallel air flow. Furthermore, the TEF value increases when the ambient air flow goes from parallel to perpendicular, being the worst case for θamb = 45°. In the case study,
TEF = 0.25, 0.32, 0.3 for θamb = 0°, 45°, 90° respectively.
Laguerre et al. (2012) developed a simplified analytical model based on heat transfer equations to determine the values of air and product temperatures at various locations of an ORDC. The heat gain by radiation is more significant for products located on the front (top and bottom) and the heat gain by air infiltration is more significant for the products located in the rear (front and rear). Cao et al. (2010, 2011) developed a new strategy for conception and optimization in the air curtains design for vertical ORDC. The strategy is based on the heat transfer model between two fluids (two-fluid of cooling loss - CLTF) developed based on a Support Vector Machine (SVM) algorithm.
This paper aims to contribute to studies on the thermal performance of ORDC, showing and evaluating the experimental results of the relation between the porosity of PBP and the GDA width on the overall performance of the ORDC.
2. EXPERIMENTAL STUDY
2.1. Experimental apparatus
The vertical ORDC provided by Eletrofrio Refrigeration LTDA - Brazil has 2.5x1.1x2.1 m3. It comprises (1) an insulating body (IB) surrounding all the equipment; (2) tube and fins heat exchanger (HX); (3) discharge air grille (DAG); (4) return air grille (RAG); (5) perforated back panel (PBP) and shelves (SH) as shown in Figure 1. The temperature of the refrigerated compartment is provided by the cold air mass flow that exits DAG and PBP and returns to RAG to be cooled again in the HX. The air flow exiting DAG forms an air curtain which protects the inner refrigerated compartment. Note that this equipment has a primary air curtain (PAC) and a secondary air curtain (SAC) in order to promote a more effective aerothermodynamics sealing.
Figure 1. Vertical open refrigerated display cabinet.
The device has four fans with 53 W each to supply a flow rate of 0.4 m3.s-1 to DAG and PBP. The air, before reaching the DAG, passes through an evaporator with dimensions 2.20x0,13x0,35 m3 constituted by 222 fins and three rows of tubes in the air flow direction and 8 rows of tubes perpendicular to it. The DAG has a total width, b, of 140 mm, which is equally distributed to form the PAC (bPAC = 70 mm) and SAC
(bSAC = 70 mm). This equipment is used to display products with temperature class M1 (-1 °C to +5 °C). It
measuring instruments were selected in order to obtain reliable measurements of the relevant physical properties variation collected every minute during the experimental test.
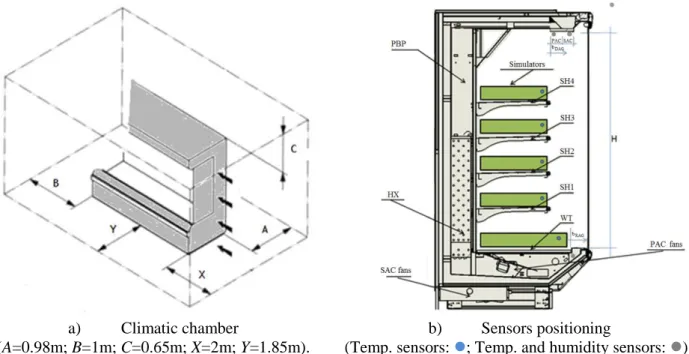
The experimental tests (ET) followed EN ISO 23953 (2005) and were performed in a climatic chamber designed in accordance as shown in Figure 2a. Figure 2b shows the middle section of the ORDC. In DAG, RAG and ambient were placed temperature and humidity sensors Super MT 530. Temperature sensors type PT1000 were placed in the test packages (product simulators). A Coriolis flowmeter MASSFLO 2100 DI 6 was installed at the liquid refrigerant line. Table 1 shows the experimental techniques and probes/experimental measuring devices used to collect the relevant physical properties.
a) Climatic chamber
(A=0.98m; B=1m; C=0.65m; X=2m; Y=1.85m).
b) Sensors positioning
(Temp. sensors: ; Temp. and humidity sensors: ) Figure 2. Climatic chamber and sensors location on the ORDC.
Table 1. Experimental techniques and probes/experimental measuring devices. Experimental technique Model Measuring range Accuracy
Thermometry PT 1000 -40°C to +80°C ± 0.3 °C
MT 530 Super -10°C to 70°C ± 1.5 °C
Hygrometry MT 530 Super 20% to 85% ± 5%
Anemometry HTA 4200 0,3 m.s-1 to 34 m.s-1 ± 1% Flowmetry MASSFLO 2100 0 to 1000 kg.h-1 0.1%
Barometry AKS 32 0 to 200 psig ± 0.3%
2.2. Experimental testing procedure
Experimental tests (ET) were performed for initial evaluation of the ORDC. As the PBP airflow ratio, β, calculated by eq. (7) considering constant air density., and the characteristic length of DAG influence the TEF and overall energy consumption, tests were conducted to four different levels of total air flow, i.e. to four different levels of mass air flow distributed by the DAGPAC and PBP ( ). The system
control is provided by a frequency inverter connected to the fans of DAGPAC. After identifying the best
configuration for the PBP distribution i.e. its porosity, the fans of DAGSAC were also connected. With this
procedure, the air curtain thickness was doubled. The air velocity in DAGSAC outlet was modulated to five
different levels via control of the frequency inverter connected to the fans of DAGSAC. The PBP was initially
closed with tape as shown in Figure 3 for the first four tests (ET1 to ET4). The tapes were partially withdrawn at each series of ET with four levels of fans rotation velocity. The tapes were taken by its numerical order (as shown in Figure 3) to obtain a better distribution of air over the shelves. The procedure consists in firstly to take out all tapes n.º 1, then take out also the tapes with n.º 2, and so on. After identifying the best configuration for β, DAG width was increased from bPAC = 70 mm to bPAC+SAC = 140 mm
Figure 3. Open refrigerated display cabinet with perforated back panel completely closed.
The air velocity in DAG (PAC and SAC), RAG and PBP were measured with the propeller type anemometer model HTA4200 in twelve points along the opening perpendicular to flow. These values are shown in Figure 4 in the form of air flow rate for each ET. This figure also includes the value of β for each ET.
Figure 4. Airflow in PBP, PAC and SAC and PBP airflow ratio.
3. RESULTS ANALYSIS AND DISCUSSION
With the experimental results it was possible to adjust the ORDC and obtain a 10% reduction of energy consumption compared to commercial equipment (given by ET5). The criteria for evaluating the performance of the ORDC was, (1) lowest TEF, (2) test packages temperature below 5 °C, and (3) lowest cooling load. 0 0,1 0,2 0,3 0,4 0,5 0,6 0 200 400 600 800 1000 1200 1400 1 2 3 4 5 6 7 8 9 10 11 12 13 14 15 16 17 18 19 20 21 P B P ai rf low rat io, b A irf lo w rat e [m 3/h] Experimental test n.º PBP PAC SAC Beta
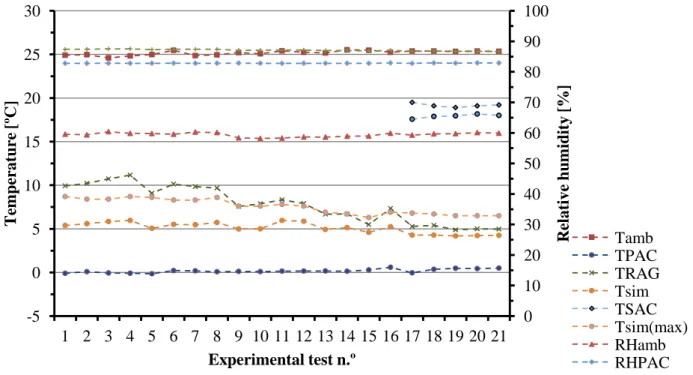
The air temperature and humidity values obtained in the carried out ET (ET1 to ET21) are shown in Figure 5.The test results (EE1 the EE21), showed that: (1) there is an optimal value for β, (2) increasing the DAG thickness reduces TEF and the cooling load. The values of TEF, total cooling load (Qtot) and the average and
maximum test packages temperatures (Tsim) for the EE are shown in Figure 6. The maximum value of test
packages temperature is measured in the well tray for all EE. Qtot values were determined by eq. (1) whereas
the TEF values were determined by eq. (5) to eq. (8).
Figure 5. Values of temperature and relative humidity for the experimental tests.
Figure 6. Values of and TEF for the experimental tests.
In Figure 5, it is possible to see that the air curtain efficiency is a relevant factor to reduce energy consumption and maintenance of product temperature. An efficient sealing ability provided by DAG can be identified by analyzing the TEF values. In order to obtain more efficient equipment considering the previously defined evaluation criteria (lowest TEF, Qtot and Tsim), without making major changes in the
current design, the best configuration shown in Figure 6 is given by EE19, where β = 0.46, considering VPAC = 734 m 3. h-1, VSAC = 391 m 3. h-1 and VPBP = 669 m 3.
h-1. The mass flows on other ET are different due to the different pressure drop caused in the different configurations.
0 10 20 30 40 50 60 70 80 90 100 -5 0 5 10 15 20 25 30 1 2 3 4 5 6 7 8 9 10 11 12 13 14 15 16 17 18 19 20 21 R el at ive hu m idit y [% ] T em perat ure [º C ] Experimental test n.º Tamb TPAC TRAG Tsim TSAC Tsim(max) RHamb RHPAC 0 0,1 0,2 0,3 0,4 0,5 0,6 0,7 0,8 0,9 1 0 1 2 3 4 5 6 1 2 3 4 5 6 7 8 9 10 11 12 13 14 15 16 17 18 19 20 21 TEF Qto t [ k W] Experimental test n.º Qtot TEF
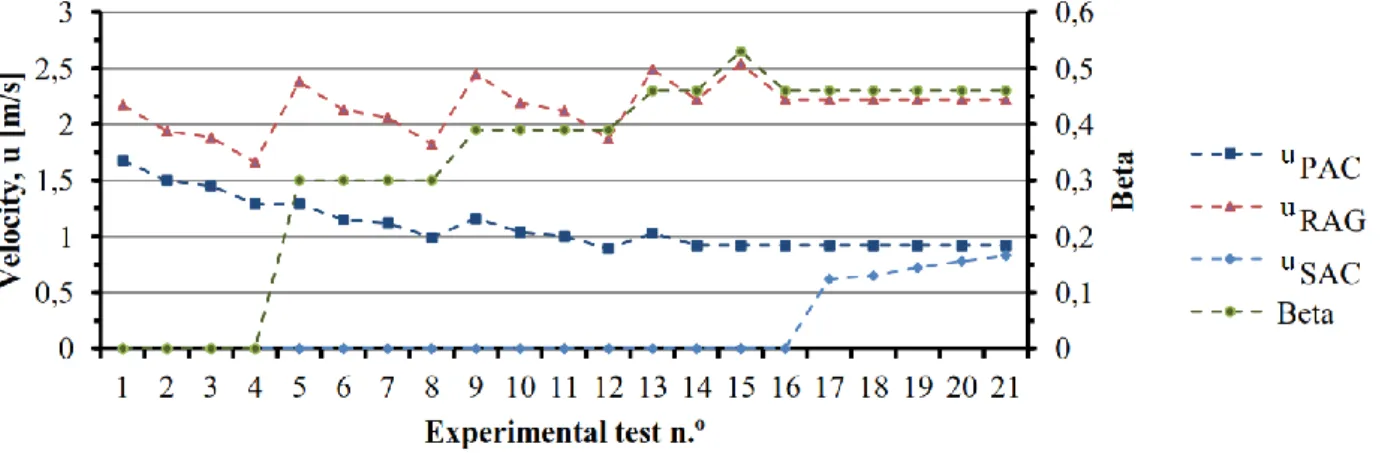
The air velocity in DAG, RAG e β for each ET is shown in Figure 7. In EE19 was obtained a uDAG = 0.92 m
.
s-1. Gaspar et al. (2011) determined the best performance at uDAG = 1.5 m .
s-1, Cao et al. (2011) obtained the best performance at uDAG = 0.8 m
.
s-1 to 1 m.s-1, while Yu et al. (2009) found an optimum DAG velocity from uDAG = 0.7 m
.
s-1 to 0.8 m.s-1. Comparing the results with these obtained by other authors, we can be stated that the optimal DAG velocity depends on the physical characteristic of the air curtain and the PBP airflow ratio, so for every height/width ratio exists a optimum value for the DAG velocity. With the experimental study, it was possible to adjust this particular ORDC and improve its performance by reducing 10% the energy consumption (ET19) as compared to commercial design (ET15).
Figure 7. PAC, SAC and RAG velocity and β for the experimental tests in climate class n.° 3 (Tamb = 25 ºC,
RHamb = 60%, uamb = 0.15 m .
s-1).
4. CONCLUSION
This paper includes an optimization technique for open refrigerated display cabinets. This is a test method of great value to industry, since usually it does not have easily the computational resources or expertise to develop CFD modelling, but it can develop experimental studies measuring the thermo-physical parameters to quantify the air curtain flow. With the experimental results it was possible to identify a value for the airflow rate and its distribution between the PBP and DAG that provides a design with better performance. The optimum values are given by the experimental test where uPAC = 0.92 m
. s-1; uSAC = 0.72 m . s-1; uRAG = 2.22 m .
s-1; bDAG = 140 mm; and β = 0.46. With the development of this work, it is evident the fact that
for each type of vertical open refrigerated display cabinet with a height/width ratio different from the model where presented, there are optimum values for β and DAG and RAG velocities.
NOMENCLATURE
b air curtain width (m) Subscripts
g Gravitational accelerations (m.s-1) amb ambient
Gr Grashof number (-) DAG Discharge air grille
H Air curtain height (m) ET Experimental test
i enthalpy (J.kg-1) HX Heat exchanger
Mass flow rate (kg.h-1) IB Insulating body
Thermal power (W) PAC Primary Air
Re Reynolds number (-) RAG Return air grille
Ri Richardson number (-) SAC Secondary Air
RH Relative humidity (%) Curtain
T Temperature (K) SH Shelve
u Velocity (m.s-1) sim simulator
V Airflow rate (m3/h) tot total
X Dimensionless temperature (-) Abbreviation
DAG Discharge Air Grille RAG Return Air Grille PBP Perforated Back Panel TEF Thermal Entrainment Factor PAC Primary Air Curtain
SAC Secondary Air Curtain Greek symbols
Airflow direction ( º )
ν Kinematic viscosity (m².s-1) Thermal expansion coefficient (K-1) β Back panel airflow ratio (-)
REFERENCES
1. ASHRAE. 2010, “ASHRAE Handbook: Refrigeration”, ASHRAE, Inc.
2. Cao, Z., Gu, B. Mills, G., Han, H. 2010, A novel strategy for predicting the performance of apen vertical refrigerated display cabinets based on the MTF model and ASVM algorithm, International Journal of Refrigeration 33(7), 1413-1424.
3. Cao, Z., Gu, B. Mills, G., Han, H. 2010, Application of an effective strategy for optimizing the design of air curtains for open vertical refrigerated display case, Int. Journal of Thermal Sciences 49(6), 976-983. 4. Cao, Z., Gu, G., Han, H. 2011, A novel optimization strategy for the design of air curtains for open
vertical refrigerated display cases, Applied Thermal Engineering 31(16), pp. 3098–3105.
5. Chen, Y., Yuan, X.-L. 2005, Simulation of a cavity insulated by a vertical single band cold air curtain, Energy Conversion and Management 46(11-12), 1745-1756.
6. Chen, Y. 2009, Parametric evaluation of refrigerated air curtains for thermal insulation, International Journal of Thermal Sciences 48(10), 1988-1996.
7. Chen, Y., Xia, D.H. 2011, The flow characteristics analyses of refrigerated air curtains in multi-deck display cabinets, International Congress of Refrigeration), 23rd ed., Pregue, Czech Republic.
8. Faramarzi, R. 1999, Efficient display case refrigeration, ASHRAE Journal 41(11), 46–52.
9. Foster, A.M., Madge, M., Evans, J.A. (2005), The use of CFD to improve the performance of a chilled multi-deck retail display cabinet, International Journal of Refrigeration, 28(5), 698–705.
10. Gaspar, P.D., Gonçalves, L.C.C., Vogeli, A. 2009, Dependency of air curtain performance on discharge air velocity (grille and back panel) in open refrigerated display cabinets, ASME International Mechanical Engineering Congress and Exposition, Lake Buena Vista, Florida, U.S.A.
11. Gaspar, P.D., Gonçalves, L.C.C., Ge, X. 2010, CFD parametric study of ambient air velocity magnitude influence in thermal behaviour of open refrigerated display cabinets, European Conference on Computational Fluid Dynamics, 5rd ed., Lisbon, Portugal
12. Gaspar, P.D., Gonçalves, L.C.C., Ge, X. 2010, Influence of ambient air velocity orientation in thermal behaviour of open refrigerated display cabinets, ASME 2010 10th Biennial Conference on Engineering Systems Desing and Analysis, Istanbul, Turkey, July.
13. Gaspar, P.D., Gonçalves, L.C.C., Pitarma, R.A. 2011, Experimental analysis of the thermal entrainment factor of air curtains in vertical open display cabinets for different ambient air conditions, Applied Thermal Engineering 31(5), 961–969.
14. Gaspar, P.D., Gonçalves, L.C.C., Pitarma, R.A. 2011, Análise Experimental da estabilidade de cortinas de ar de equipamentos de refrigeração para diferentes condições do ar ambiente, International Conference on Engineering UBI2011 -28-30 Nov 2011 - Universidade of Beira Interior - Covilhã, Portugal.
15. Hayes, F.C., Stoecker, W.F. 1969, Design data for air curtains, ASHRAE Transactions 75(2), 68-180. 16. Laguerre, O., Hoang, M.H., Flick, D. 2012, Heat transfer modelling in a refrigerated display cabinet: the
influence of operating conditions, Journal of Food Engineering 108(2), 353-364.
17. Navaz, H.K., Henderson, B.S., Faramarzi, R., Pourmovahed, A., Taugwalder F. 2005, Jet entrainment rate in air curtain of open refrigerated display cases, International Journal of Refrigeration 28(2), 267–275. 18. Rigot, G. 1991, Meubles et Vitrines Frigorifiques, PYC DITION, París, France, 340p.
19. Yu, K., Ding, G., Chen, T. 2009, A correlation model of thermal entrainment factor for air curtain in a vertical open display cabinet, Applied Thermal Engineering 29(14-15), 2904–2913.