1 This article was published in Solar Energy Materials and Solar Cells, 128, 399-410, 2014
http://dx.doi.org/10.1016/j.solmat.2014.05.051
An Innovative Photoelectrochemical Lab Device for Solar Water
Splitting
Tânia Lopes, Paula Dias, Luísa Andrade, Adélio Mendes*
LEPABE - Faculdade de Engenharia, Universidade do Porto, rua Dr. Roberto Frias, 4200-465 Porto, Portugal
Rua Roberto Frias, 4200-465 Porto, Portugal
* Corresponding author: Tel.: +351 225081695; Fax: +351 225081449; E-mail address: [email protected]
Abstract
A photoelectrochemical (PEC) device capable of splitting water into storable hydrogen fuel by the direct use of solar energy is becoming a very attractive technology since it is clean and sustainable. Indeed, real field experiments are being developed in order to assess technological issues for large-scale usage under outdoor conditions. Following the need for developing photoelectrochemical devices with an optimized design that allows reaching a commercial performance level, the present works describes an innovative PEC cell for testing different photoelectrodes configurations, suitable for continuous operation and for easily collect the evolved gases. Moreover, a porous Teflon® diaphragm useable
for a wide range of aqueous electrolyte solutions is tested. Two semiconductors were investigated: tungsten trioxide and undoped hematite. The WO3 photoelectrodes were
deposited in two different substrates: i) anodized WO3 photoelectrodes on a metal
substrate and ii) WO3 deposited by blade spreading method on a TCO glass substrate.
The undoped-Fe2O3 photoanode was deposited by ultrasonic spray pyrolysis technique in
a TCO glass substrate. The material deposited on glass substrates allows to obtain transparent photoelectrodes. Photocurrent-voltage characteristics were obtained for all samples characterized under three different conditions: i) no membrane separating the anode and the cathode evolution; ii) using a Teflon® diaphragm and iii) using a Nafion®
212 membrane. The transparent samples (photoanodes deposited on glass substrates) produced the highest values of photocurrent when the Teflon® diaphragm was used. This
2 photocurrent enhancement was assigned to the high reflectance showed by the diaphragm, which reflects back a significant fraction of the transmitted solar radiation.
Keywords
Photoelectrochemical Cell, Photoelectrolysis, Diaphragm, Solar Hydrogen, Electrochemical Impedance Spectroscopy
3
1.
Introduction
Finding alternatives to supply the world energy needs by developing clean and safe processes for energy production without CO2 emissions is currently a key issue.
According to different sources, the energy demand will almost double until 2050, from 13 TW to 23 TW. With approximately 120 PW of solar energy continuously irradiating the surface earth, the sun seems to be an outstanding source of energy to overcome the current and future energy demand.[1] Currently, only 1 % of the total consumed energy comes from the sun, mainly through the use of photovoltaic (PV) technology.[2] The electrical photovoltaic power, however, is not dispatchable and, thus, a complementary approach is needed to transform the solar radiation into a storable energy form for later use.[3] One of the most interesting technologies is the photoelectrochemical (PEC) cells that combine in a single device the harvesting of solar energy with an electrolysis system, converting water into hydrogen and oxygen by light-induced electrochemical processes.[4] Presently, the main concerns about PEC cells lie not only on the energetic properties and stability issues, but also on the efficiency improvement of the photoactive materials in order to attain at least 10 % of energy conversion efficiency; this is the minimum efficiency level required to make the PEC solution commercially interesting/viable.[5]
There are numerous hydrogen-production approaches that use solar energy for PEC water splitting: i) combined PV-electrolysis system; ii) photoelectrode-based systems; iii) photocatalysts based slurry systems. The first work reporting successful water splitting by bandgap excitation of TiO2 in a PEC cell configuration using a Pt wire as
counter-electrode dates back to the earlier 1970s, by Fujishima and Honda.[6] Afterwards, a monolithic photoelectrochemical/photovoltaic cell (PEC/PV cell) placed in series using heterojunctions of expensive and instable III-V materials, such as GaInP2 and n-p-GaAs,
demonstrated 12.4 % efficiency of light conversion into hydrogen.[7] More recently, a single photoelectrochemical device with Pt-doped hematite photoanode modified with Co-Pi catalyst produced a record-performance of 4.32 mA·cm-2 at 1.23 V
RHE under
simulated 1 sun (100 mW·cm-2).[8] A different approach for splitting water into hydrogen
and oxygen consists of using aqueous suspensions of self-supported photocatalysts composed by semiconductor powders or colloidal (often a large band gap metal oxide) and a noble metal such Pt.[9] Even if these systems present the great advantage of enabling photolysis in a homogeneous phase without the need of both expensive
4 transparent electrodes and directional illumination, they have a huge problem: the separation of the explosive mixture of hydrogen and oxygen is not easy, bringing safety concerns about these devices.[9]
All the above mentioned options have the particularity of combining the harvesting of solar energy and the electrolysis of water into a single conversion unit called PEC cell. Although the PEC cell approach is simple and elegant in concept, in practice it is very challenging since it relies on complex interactions involving sunlight, semiconductors and liquid solutions.[10, 11] In fact, PEC cell researchers claim that these systems are the
Holy Grail of hydrogen production since it offers a unique combination of an efficient
and low-cost approach for producing high purity hydrogen from water by harvesting solar energy.[10] Nowadays, powerful synergies are being created between researchers from different fields to pursue the PEC quest.[12]
Among the different examples presented above, the most studied topic is the photoelectrode-based systems, where the water splitting phenomenon produces oxygen and hydrogen at a physically separated anode and cathode, respectively.[9] Here, either or both electrodes can be photoactive and the evolved gases can be collected and stored separately. Currently, the major challenge in developing efficient PEC cells for water splitting relies on finding inexpensive materials that fulfill as much as possible the requirements of an ideal photoelectrode: i) it has to have strong light absorption in the visible spectrum, ii) high chemical stability in aqueous electrolyte solutions under dark and illuminated conditions, iii) suitable band edges positions for hydrogen and oxygen evolutions, iv) low kinetic overpotentials; and finally v) the charge transfer at the semiconductor/electrolyte interface must be selective for water splitting (Figure 1).[13, 14]
5 Figure 1. Energetic diagram of a PEC cell under dark (a) and illumination (b) conditions. Oxide semiconductors (both n- and p-type) have been shown to be promisingly stable photoelectrodes for electrolysis of water. The most frequently studied photoelectrode materials are TiO2, WO3, Fe2O3, BiVO4 SnO2 and Cu2O and their modifications.[10, 11,
15-17] Recently, nanostructured photoelectrodes showed radically improved properties. In fact, due to the small size of the nanocrystalline structures, the photogenerated carriers are always created near the surface, where water conversion takes place.[9, 18, 19] Nanostructured electrode materials can be used to address some of the intrinsic limitations of the materials: visible light absorption, efficient charge carrier separation and transport, interfacial charge-transfer kinetics, appropriate positions of the conduction and valence band energy levels with respect to the required reaction potentials, and good stability in contact with electrolytes under dark and light illumination conditions.[10]
A photoelectrode-based system comprises two electrodes, an anode and a cathode, both immersed in an aqueous electrolyte solution; at least one of the electrodes must be photoactivated under illumination. When a semiconductor with the ideal set of properties is immersed in an electrolyte solution and illuminated, the correspondent photon energy is used for splitting water into hydrogen and oxygen.[20] Currently, there are different types of PEC reactors, most of them responding to the need of testing new photoelectrodes, but less attention is being given to the improvement of such devices in order to increase their overall performance. The photoreactors reported for PEC water splitting exhibit various shapes and configurations: e.g. simple cubic or cylindrical open vessels, closed vessels equipped with an ion exchange membrane separating hydrogen
Electrolyte CB VB H2/H+ H2O/O2 M SC-n 1.23 eV EF E W ΔVPh Electrolyte CB VB H2/H+ H2O/O2 M SC-n 1.23 eV EF,n E W h+ e- e -ηa ηc 0 a L b
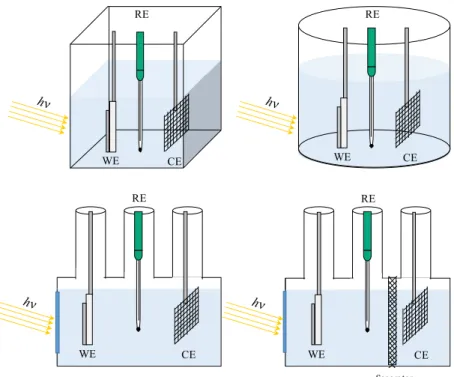
6 from oxygen evolutions[5], H-type PEC cells[6, 21], sandwich assembly, among other more complex cells, such as the ones that allows tandem configurations (PV + PEC system in a single embodiment)[15, 22] – Figure 2. Among the typical PEC cells, more complex ones were also developed, such as the “Cappuccino” PEC cell[23] designed by the LPI group at EPFL (Switzerland) and the cell designed and built by the MECS group at TU Delft[10].
Figure 2. Example of PEC cells devices for water splitting with different designs, in a three-electrode configuration. WE – working electrode; RE – reference electrode; CE-counter-electrode.
Still, to make this technology marketable, it is not only necessary to find new photoelectrode materials, but also to develop photoelectrochemical devices with an optimized design that allows reaching a commercial performance level. For this, a special attention was given to study the effect of the position of the electrodes towards each other and towards the light source. Two PEC cells’ configurations were disclosed, always with the main concern of positioning the electrodes for maximizing the solar light harvesting: i) transparent n- and p-type electrodes, facing each other (the bandgaps of the photoelectrodes are such that the light not absorbed in the first photoelectrode can be absorbed in the second one – in series arrangement)[24]; and ii) n- and p-type photoelectrodes placed one beside the other such as both photoelectrodes face the same
WE CE RE WE CE RE WE CE RE Separator WE CE RE
7 light source – in parallel arrangement[25]. Despite these works, nowadays only simple PEC reactor configurations are actually commercially available and only for lab scale applications. Besides, these cells have a limited flexibility to host new advancements.[5] The arrangement of the PEC cell and its design largely depends on the photoelectrodes configuration, e.g.: single photo-system - Figure 3, or dual photo-system devices - Figure 4.
a) b) c)
Figure 3. No-biased single photo-system configurations for solar water splitting (SC - semiconductor; M – metal) - (adapted from reference [5]): a) n-type semiconductor photoanode and a metal counter-electrode; b) p-type semiconductor photocathode and a metal counter-electrode; and c) monolithic configuration.
a) b) c )
Figure 4. Different no-biased multiple photo-system configurations for solar water splitting (SC - semiconductor; M - metal) - (adapted from reference [5]): a) n- and p-type semiconductors wired; b) n- and p-type semiconductors linked by an ohmic contact; and c) hybrid systems. Electrolyte CB VB H2O/H2 H2O/O2 M SC-n e -e -h+ e -Electrolyte CB VB M SC-p h+ e -e -H2O/H2 H2O/O2 h+ H2 H2O M H2O O2 SC-n SC-p e -Electrolyte Electrolyte CB VB H2O/H2 H2O/O2 M SC 1 e -e -h+ e -SC 2 h+ e -VB Electrolyte CB VB H2O/H2 H2O/O2 SC-n e -e -h+ e -h+ CB VB SC-p e -H2O H2 H2O O2 Glass Substrate e -SC-n SC-p Electrolyte
8 A PEC cell device has to comply with several requirements for lab applications: a) photoelectrodes configuration, b) light penetration through the cell to reach the photoelectrodes, c) resistant to corrosive electrolytes, d) need of continuously electrolyte feeding and e) need of a membrane to maintain the evolved gases separated. Bearing in mind all these requirements the authors proposed a new PEC cell design.[20] This work describes a new and versatile PEC cell reactor with the possibility of directly collecting the evolved gases, with an innovative feeding system and a cheap and adaptable membrane.
1.1. The new PEC cell
The more common PEC cell design is the conventional electrochemical cell used for corrosion studies, with an optically transparent window, as reported by Chen et al. in 2010.[21] It consists of a reservoir that holds the electrolyte solution wherein the two electrodes are immersed: the anode and the cathode, where one or both electrodes must be photoactive – Figure 2. This electrolyte container should be transparent or, at least, should have a transparent window so that the light can reach the photoactive electrode, triggering the correspondent electrochemical reactions responsible for water splitting into hydrogen and oxygen.[26] The cell should be connected to an external bias source whenever the energetic requirements of the photoelectrode(s) alone are not enough to promote water splitting. However, a PEC cell reactor should allow a continuous feed of electrolyte, a separate evolution of hydrogen and oxygen, besides having a great flexibility for hosting the electrodes. The new PEC cell depicted in Figure 5 presents all the above mentioned features and, in particular, it is prepared to host photoelectrodes up to 10 × 10 cm2. These dimensions and versatile configurations foster the scaling-up of
PEC technology and allow a better understanding of the behavior of these devices under real outdoor applications.
9 Figure 5. 10 × 10 cm2 photoelectrochemical cell: a) disassembled, b) under operating
conditions and c) detail of the innovative feeding system. 1 – Transparent acrylic cap (gas collection chamber); 2 – Teflon membrane; 3- transparent acrylic cap (electrodes contacts); 4 – photoelectrode; 5 – Diaphragm to separate both electrodes; 6 - Pt-counter electrode; 7 – black acrylic for light blocking; 8 – transparent window; 9 – transparent PEC cell body; 10 - removable metallic window; 11- electrolyte inlet; 12 – electrolyte outlet.
The cell has two removable metallic windows (front and back – Figure 5 b10) screwed to a transparent acrylic part (Figure 5 a9) crossing a synthetic quartz window (Robson Scientific, England - Figure 5 a8), which is pressed against an o-ring by means of twelve screws. Then, a black acrylic mask is placed next to the metallic windows, allowing an illumination area of 10 × 10 cm2 - Figure 5 a7). After assembling the metallic and the
black acrylic parts to the transparent acrylic cell body, the cell is prepared to be filled with the appropriate electrolyte solution, where both electrodes will be immersed. This PEC cell permits back and front illumination and allows to place a membrane between the electrodes to prevent gas mixture (hydrogen and oxygen) - Figure 5 a5). This separator can be a commercial Nafion® membrane that allows just protons to permeate in an acid media or a stretched porous hydrophobic Teflon® membrane (diaphragm), which exhibits a high porosity of micrometer size pores that prevent hydrogen and oxygen bubbles to permeate. The cell is sealed with two transparent acrylic caps screwed on the top of the cell - Figure 5 a1 and a3). Between these two caps is placed a membrane that prevents liquid passage to the gas-collecting chamber - Figure 5 a2). This membrane, made of Teflon®, allows the gases to easily permeate but prevents aqueous electrolytes to cross
due to its high hydrophobicity. The sealed cell allows the electrolyte to be continuously fed to both chambers without fearing leakage.
1 3 2 6 4 5 9 8 7 a) b) c) 10 11 12
10 The optically transparent windows are very important to allow PEC cells to work properly; for instance, a normal soda lime glass cuts off the transmittance for wavelengths lower than 350 nm, while a quartz window have normally a transmittance higher than 90 % from 250 nm.[20] Nevertheless, cheaper materials can be used with similar performances, such as: fused silica (amorphous silica) – visible light transmittance higher than 90 % and excellent stability in both acid and alkaline aqueous solutions; or Pyrex - which has similar transmittance and high stability towards acid solutions.[10, 21] Additionally, windows of polycarbonate and acrylic can also be used, showing visible light transmittances of 89 % and 92 %, respectively. Nevertheless, these materials easily scratch during handling and so they should be changed more often.
To simulate a real PEC cell application, a 2-electrode configuration is preferable; however, to measure the PEC cell efficiency in a laboratory setup normally a 3-electrode configuration is used, being the third electrode the reference one. Thus, to determine the photoelectrode performance in a 3-electrode configuration in the above presented cell the second acrylic cap, as well as the Teflon® membrane on top of the cell, have to be removed. The reference electrode is then immersed and connected to the potentiostat.
It is well known that there are only few photoelectrodes schemes allowing the water splitting reaction without bias; as so, these devices usually integrate more complex configurations and so the versatility of the PEC reactor is again crucial. In fact, the disclosed PEC cell fulfills these special demands by including the following properties:
i) ability to receive light from both sides, since it has two transparent windows; ii) allows
using a membrane to separate the evolved gases (H2 and O2); iii) does not require a
complex and expensive feeding system; iv) the stacked bubbles in the photoelectrodes are easily removed by the electrolyte movement within the PEC cell originated by the feeding system; v) the electrolyte temperature can be easily controlled; vi) the gases are easily collected without liquid contaminations and/or gases recombination. Moreover, when an opaque Teflon® diaphragm is used to prevent gases mixture, a mirror can be then used to
11 Figure 6. 10 × 10 cm2 photoelectrochemical cell with a mirror system to redirect the light
beam.
2.
Materials and methods
2.1. WO3 photoelectrode on metal substrate
The WO3 photoelectrode on metal substrate was prepared by the anodization method
at Institute ENI Donegani (Novara, Italy), as described elsewhere.[27] The tungsten foil,
prior to anodization, was carefully cleaned with acetone and ethanol and sonicated in an Alconox/water solution to remove surface contaminants and oily or greasy impurities. Then, the WO3 photoanodes were prepared by applying a potential difference of 40 V
(Aim-TTi EX752M DC power supply) across the two tungsten foils, which were kept at a distance of about 3 mm. To avoid electrode corrosion, care was taken to reach the final 40 V in about 1 min. This way, a passivating compact oxide was formed during the initial stages of anodization. The total duration of anodization was 5 h in a thermostatic bath at 40 ºC.[27]
2.2. WO3 photoelectrode on TCO glass substrate
The WO3 photoelectrode on TCO glass substrate was prepared by the blade-spreading
method at Institute ENI-Donegani (Novara/Italy).[28] The procedure named Synt-1 was employed to fabricate these photoelectrodes, as described elsewhere[28]. Briefly, tungstic
acid was obtained by passing 5 mL of an aqueous Na2WO4 solution (10 % w/w, Carlo–
Erba) through a proton exchange resin (Amberlite IR120H) and the eluted solution was collected in 5 mL of ethanol to slow down the tungstic acid condensation. To the resulting colloidal dispersion, 0.5 g of organic dispersing agent was added and stirred until complete dissolution. WO3 photoelectrodes were obtained by blade-spreading the
12 resulting H2WO4 colloidal precursor on FTO (fluorinated tin oxide, TEC 8, 8 Ω·sq-1)
substrates. The resulting films were annealed at 550 ºC in air for 2 h.[28]
2.3. Hematite photoelectrode on TCO glass substrate
The hematite films were prepared at LPI - EPFL laboratories (Lausanne, Switzerland), as described elsewhere.[29] Iron (III) acetylacetonate was sprayed to a tetraethoxysilicate (TEOS)-pretreated substrate of FTO (glass 30 mm × 12 mm; TEC 15, Hartford Glass Co.;
15 V·sq-1). The spray setup consisted of an ultrasonic spray head (Lechler company,
US130º) set 30 cm over the substrates, which were placed on a hot plate heated at 550 ºC (corresponding to a measured substrate surface temperature of 400 ºC). An automatic
syringe pump was used to deliver 1 mL of a solution containing 10 mM of Fe(acac)3
(99.9+, Aldrich) in EtOH (≥ 99.8 % Fluka) to the spray head, every 30 seconds at a rate
of 12 mL min-1 (spray length of 5 s). The carrier gas (compressed air) flow, directing the
spray to the substrates, was set to 15 L min-1.
2.4. J-V Measurements
The photocurrent-voltage (J-V) characteristic curves were obtained applying an external potential bias to the cell and measuring the generated photocurrent using an Autolab/PGSTAT302N workstation controlled by Nova software package (Nova version 1.10). The electrochemical measurements were performed in both 2- and 3- electrode configurations. In a 2-electrode configuration, the working electrode and the counter-electrode are each connected to the workstation. Meanwhile, if a 3-counter-electrode measurement is considered, an Ag/AgCl sat. KCl is additionally used as reference electrode. For both cases, the potential is reported against the reversible hydrogen electrode (RHE). The measurements were performed in the dark and under simulated sunlight, AM 1.5 G (1000 W Xe lamp, 1000 W m-2, 25 ºC) calibrated with a c-Si
photodiode, at a scan rate of 10 mV s-1. The J-V characterization parameters are presented
in detail in Table 1.
2.5. EIS Measurements
EIS measurements were performed using an Autolab/PGSTAT302N workstation. The frequency range was 0.01 Hz – 100 kHz and the magnitude of the modulation signal was 10 mV. The EIS measurements were performed according to Table 1. The EIS
13 spectra obtained for the last sample (Fe2O3-Glass) were then fitted to an electrical
analogue using ZView® software.
.
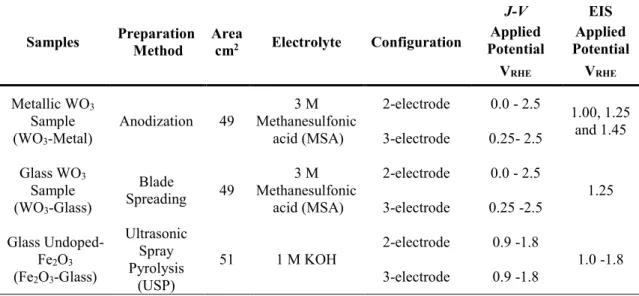
Table 1. Summary of the characterization parameters.
Samples Preparation Method Area cm2 Electrolyte Configuration
J-V EIS Applied
Potential Potential Applied VRHE VRHE Metallic WO3 Sample (WO3-Metal) Anodization 49 Methanesulfonic 3 M acid (MSA) 2-electrode 0.0 - 2.5 1.00, 1.25 and 1.45 3-electrode 0.25- 2.5 Glass WO3 Sample (WO3-Glass) Blade Spreading 49 3 M Methanesulfonic acid (MSA) 2-electrode 0.0 - 2.5 1.25 3-electrode 0.25 -2.5 Glass Undoped-Fe2O3 (Fe2O3-Glass) Ultrasonic Spray Pyrolysis (USP) 51 1 M KOH 2-electrode 0.9 -1.8 1.0 -1.8 3-electrode 0.9 -1.8
3. Results and discussion
The present work aims at studying the new PEC cell arrangement for producing hydrogen from water, powered by solar energy. As mentioned, this new cell has an innovative feeding system, which allows continuous work without disruptions for electrolyte replacement. On the other hand, a diaphragm separates the anode from the cathode chambers, preventing the mixture of evolved hydrogen and oxygen bubbles. Two semiconductor materials were investigated with this innovative PEC cell design: tungsten trioxide (WO3) and undoped hematite (Fe2O3). The WO3 photoelectrodes were deposited
in two types of substrates by two different techniques: i) anodized WO3 photoelectrodes
on a metal substrate and ii) WO3 deposited by blade spreading method on a TCO glass
substrate. The undoped-Fe2O3 photoanode was deposited by ultrasonic spray pyrolysis
technique (USP). For all photoelectrodes the characteristic J-V curves and the electrochemical impedance spectroscopy spectra were obtained.
Normally, WO3 photoelectrodes are more stable under acid electrolyte solutions; thus,
Nafion® membranes can be used to separate both electrodes since protons are the mobile
charge carriers. On the other hand, hematite works better in alkaline aqueous solutions, where Nafion® membranes cannot be used since the mobile charge carriers are hydroxyl
14 usually known as diaphragm and prevents the hydrogen and oxygen bubbles to cross from one chamber to the other; the presence of hydrogen in the anode causes overpotential and the same is valid for oxygen that reaches the cathode. Besides, oxygen presence is very undesirable in the product hydrogen stream. Porous diaphragm should display a very low resistance to the ion transport and only dissolved oxygen can permeate it, since hydrogen has a very low solubility in the electrolyte.
Teflon membranes are very inert though hydrophobic; Teflon films can be made very permeable to ions in aqueous solution if stretched and boiled in water to remove the trapped air. Another important feature of the Teflon® porous diaphragm is the possibility
of using it on top of the PEC cell to separate the evolving gases from the electrolyte – Figure 5a2). Indeed, Teflon® is a hydrophobic material that prevents the electrolyte to
permeate, while its porosity allows the evolving gases to easily cross. [30]
3.1. WO3 photoelectrodes
The WO3 samples were tested both in a 3-electrode configuration, i.e. with an
Ag/AgCl sat. KCl as reference electrode, and in a 2-electrode configuration. The 3-electrode configuration was used to obtain the characteristic curves of the photo3-electrodes and the 2-electrode configuration was used to study the characteristic curves of the complete device.[31] The 2-electrode configuration allows studying the overall charge transfer phenomena occurring at the semiconductor, within the electrolyte and at the counter-electrode side of the cell, whereas the 3-electrode configuration enables the detailed study of the electrochemical behavior of the photoelectrode/electrolyte interface since the potential is measured with respect to a fixed reference potential.[31]
The J-V curves obtained for the two WO3 samples in the dark and under 1 sun
illumination conditions are plotted in Figure 7. It can be observed that the anodized metal sample has a significantly higher photocurrent density than the sample deposited onto a TCO glass substrate; at 1.45 VRHE the metallic sample (coded hereafter as WO3-Metal)
produces 0.9 mA·cm-2 and the glass sample (coded hereafter as WO
3-Glass) produces
0.15 mA·cm-2; actually, this behavior is in line with the efficiency values reported in
literature.[27, 28] The differences observed in the photocurrents are not only due to the preparation method but also due to the higher charge transport resistance through the transparent conductive oxide (TCO) layer in the glass substrate. The EIS spectra will
15 allow to discriminate the series resistances in glass and metal substrates, which are directly related to the charge transport resistance on them – cf. Figure 9.
0.0 0.4 0.8 1.2 1.6 2.0 2.4 0.0 0.2 0.4 0.6 0.8 1.0 1.2
WO3-Metal in a 3-electrode configuration WO3-Metal in a 2-electrode configuration WO3-Glass in a 3-electrode configuration WO3-Glass in a 2-electrode configuration
Cur ren t Den si ty / m A · c m -2
Applied potential / VRHE
Figure 7. J-V characteristics obtained for metal and glass WO3 photoanodes, under dark
and 1 sun light conditions, in a 2- and 3-electrodes configurations. All the measurements were performed without membrane. WO3-Metal: Sample of WO3 on metal substrate,
WO3-Glass: Sample of WO3 on TCO glass substrate.
The use of a diaphragm has never been reported for PEC cell applications. Thus, the use of a porous Teflon® diaphragm will be compared in two distinctive cases: i) no
membrane; and ii) Nafion® 212 membrane, highly proton conductive. Tungsten
photoelectrodes deposited both on glass and metal substrates were used.
3.1.1. WO3 photoelectrode on metal substrate
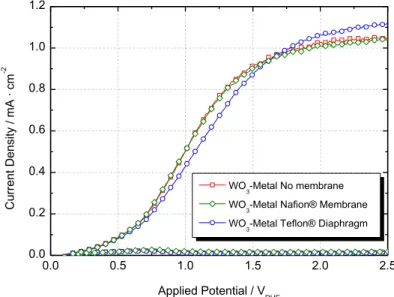
Figure 8 shows the photocurrent-voltage characteristic curve obtained for the anodized metallic sample (WO3-Metal) in a 2-electrode configuration with: i) no
membrane, ii) Nafion® N212 membrane and iii) Teflon® diaphragm. The obtained
characteristic curves show a similar shape for the three cases. This corroborates the possibility of using Teflon® diaphragm also for acid electrolyte media. Nevertheless,
16 for potentials from 0.8 VRHE to 1.6 VRHE. On the other hand, for applied potentials higher
than 1.6 VRHE, this behavior changes and the device with Teflon® membranestarts to
present higher photocurrent density. At the beginning of the experiment, the Teflon®
diaphragm presents a higher transport resistance since it is made of a hydrophobic polymer and the aqueous electrolyte has difficulty to penetrate into the pores of the membrane. During the experiment time the diaphragm becomes slightly more transparent indicating that more pores are being filled with electrolyte and thus more ions are permeating. This behavior justifies the progressively better performance of the Teflon®
based device, especially for potentials above 1.6 VRHE. This allows to conclude that the
Teflon® diaphragm should be pre-treated to remove the trapped air in the pores, for
example by as boiling the diaphragm in hot water.
0.0 0.5 1.0 1.5 2.0 2.5 0.0 0.2 0.4 0.6 0.8 1.0 1.2 WO3-Metal No membrane WO3-Metal Nafion® Membrane WO3-Metal Teflon® Diaphragm
Curr en t Den si ty / m A · c m -2
Applied Potential / VRHE
Figure 8. J-V characteristics of the WO3 anodized metallic sample in the dark and
under 1 sun solar radiation for the three situations under study: without membrane (□), with Nafion® membrane (◊) and with Teflon® diaphragm (ᴏ). WO
3-Metal: Sample of
WO3 on metal substrate.
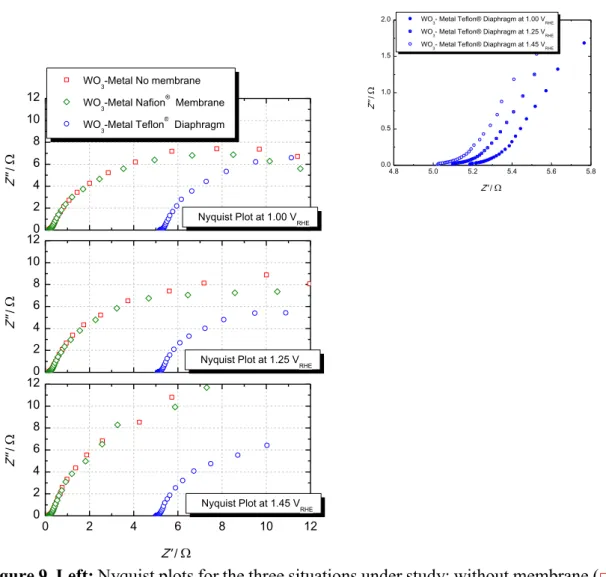
Electrochemical impedance spectroscopy technique is a unique tool that can give important information about the phenomena occurring inside the PEC cell. In particular, it allows to identify groups of resistors and capacitors that describe the behavior of the electrochemical reaction kinetics, ohmic conduction processes and even mass transport limitations. The Nyquist spectra in 2-electrode configuration is plotted in Figure 9 at three
17 different applied potentials; 1.00 VRHE, 1.25 VRHE and 1.45 VRHE. At an applied potential
of 1.00 VRHE, the overall PEC cell resistances shows similar values for the three studied
cases. Still, the device with Teflon® diaphragm displays a higher series resistance (R s), of
about 5 Ω, than the other two cases, which show almost 0 Ω. Rs in this type of systems
comprises the substrate charge transport resistance, the resistance related to the ion conductivity in the electrolyte and the external contacts resistances (e.g. wire connections). The membrane resistance contribution is considered an ohmic resistance and thus it is also included in Rs value. Even if the Teflon® diaphragm presents higher
series resistance for the three studied potentials, for the highest applied potential the overall resistance is lower and thus the final produced photocurrent is higher. As mentioned, this enhancement for applied potentials higher than 1.6 VRHE is related to air
release from the Teflon porous material, increasing the active pores for mass transport. Additionally, from the right side of Figure 9 it is visible that the Teflon® series resistance
monotonously decreases with the applied potential, indicating that the ohmic resistance of the Teflon® diaphragm also decreases.
18 0 2 4 6 8 10 12 0 2 4 6 8 10 120 2 4 6 8 10 120 2 4 6 8 10 12 Z'' / Z' /
Nyquist Plot at 1.45 VRHE Nyquist Plot at 1.25 VRHE Nyquist Plot at 1.00 VRHE
Z'' / WO 3-Metal No membrane WO 3-Metal Nafion ® Membrane WO 3-Metal Teflon ® Diaphragm Z'' /
Figure 9. Left: Nyquist plots for the three situations under study: without membrane (□), with Nafion® (◊) and with Teflon® (ᴏ) tape at three different applied potentials (1.00
VRHE, 1.25 VRHE and 1.45 VRHE); Right: Nyquist plots zooming for the case of using a
Teflon® diaphragm. WO
3-Metal: Sample of WO3 on metal substrate.
The solar-to-hydrogen conversion efficiency (STH) is defined as the chemical energy produced divided by the solar energy input[21]. The chemical energy produced is the rate of hydrogen production (mmol H2·s-1) multiplied by the change in Gibbs free energy per
mol of H2 (at 25 ºC, ΔG = 237 kJ·mol-1). The solar energy input is the incident
illumination power density (PTotal, in units of mW·cm-2) multiplied by the illuminated
area (cm2). Therefore, STH can be described through the following expression:[21]
2
2 1
1
2 2 Total AM1.5G H mmolH s 237 kJ mol % mW cm cm rate G STH P A (1) 4.8 5.0 5.2 5.4 5.6 5.8 0.0 0.5 1.0 1.52.0 WO3- Metal Teflon® Diaphragm at 1.00 VRHE
WO3- Metal Teflon® Diaphragm at 1.25 VRHE WO3- Metal Teflon® Diaphragm at 1.45 VRHE
Z''
/
19 The amount of produced hydrogen was determined assuming 100 % Faradaic efficiency: ph ph 2 H 2 2 I J A rate F F (2)
where H rate2 is the hydrogen production rate (mol·s-1), Iph is the photocurrent (A), F is
the Faraday’s constant (C·mol-1), A is the illuminated photoelectrode area (m2) and J ph is
the photocurrent density (A·m-2). From equations (1) and (2) it is possible to plot the
hydrogen production rate and the correspondent STH efficiency - Figure 10.
0.0 0.5 1.0 1.5 2.0 2.5 0.0 0.2 0.4 0.6 0.8 1.0 1.2 1.4 WO3-Metal No membrane WO3-Metal Nafion® Membrane WO3-Metal Teflon® Diaphragm
ST
H
/ %
Applied Potential / VRHE
0.0 0.1 0.1 0.2 0.2 0.3 0.3 0.3 R H 2 / m mo l · s -1
Figure 10. Left Axis: Hydrogen production rate (mmol·cm-2) for the case of not using
membrane (□), with Nafion® membrane (◊) and with Teflon® diaphragm (○). Right axis:
Solar-to-hydrogen PEC cell efficiency (%) for the case of not using membrane (■), with Nafion® membrane ( ) and with Teflon® diaphragm (●).WO
3-Metal: Sample of WO3 on
metal substrate.
Since it was assumed 100 % Faradaic efficiency, in Figure 10, the photocurrent and hydrogen evolution curves have the same shape, achieving a plateau of about 0.27 mmolH2·s-1 for applied potentials higher than 1.5 VRHE. Additionally, the
solar-to-hydrogen PEC cell efficiency showed the same behavior, reaching a maximum efficiency
20 membrane is used (bias of 2.5 VRHE). With the Nafion® membrane the hydrogen evolution
rate and the solar-to-hydrogen efficiency are similar to the ones obtained without membrane - Figure 10.
It is important to mention that when WO3 metallic samples are used, it is possible to
apply either a Nafion® or a Teflon® membrane to separate the electrodes within the PEC
cell. However, if we want to tilt the cell in a tracking system to harvest the maximum solar radiation at each moment, a mebrane must be placed on top of the cell (Figure 5 a2) and here only the Teflon® diaphragm can be in fact used since one of the sides is free of
electrolyte solution. Nafion® membranes cannot be used because both sides of the
membrane must be immersed in the electrolyte solution so that it works properly. Moreover, in what concerns long-term stability studies, the developed continuous electrolyte feeding system plays a crucial role, as explained elsewhere.[32]
3.1.2. WO3 sample applied onto a glass substrate
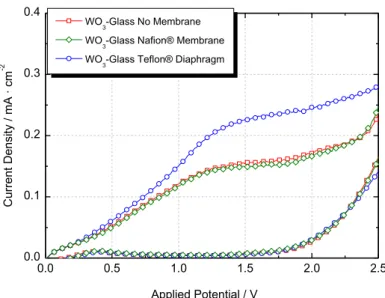
Contrary to what happened with WO3 samples deposited on metal substrates, the J-V
characteristic curve obtained for the device equipped with WO3 on TCO glass substrate
(coded WO3-Glass) and using Teflon® diaphragm exhibits higher photocurrent density,
ca. 47 % higher, in all applied potentials range - Figure 11. Since WO3-Glass
photoelectrode is transparent, the semiconductor absorbs a fraction of the incident light, being the rest reflected and transmitted. A fraction of the transmitted light is then reflected back by the white Teflon® diaphragm to the photoelectrode, leading to a higher
photocurrent. This may explain the photocurrent density enhancement; indeed at 500 nm the transmittance of the sample is 44 % and the reflectance of the Teflon® diaphragm is
80 %. Additionally, since the photoelectrode material was deposited on a TCO layer, the common dark current onset is observed for applied potentials higher that 1.8 VRHE.[33]
21 0.0 0.5 1.0 1.5 2.0 2.5 0.0 0.1 0.2 0.3 0.4 Curr en t Den si ty / m A · c m -2
Applied Potential / VRHE
WO3-Glass No Membrane WO3-Glass Nafion® Membrane WO3-Glass Teflon® Diaphragm
Figure 11. J-V characteristics for the WO3 sample prepared by the blade spreading
method, in the dark and under 1 sun solar radiation for the three situations under study: without membrane (□), with Nafion® membrane (◊) and with Teflon® membrane (ᴏ), all
in a 2-electrode configuration. WO3-Glass: Sample of WO3 on TCO glass substrate.
The EIS analysis was obtained at room temperature at an applied bias potential of 1.25 VRHE. The Nyquist plots on Figure 12corroborate that the Teflon® diaphragm device
shows higher ohmic resistances than the other two devices: 12.1 Ω for the sample with Teflon® and 4 Ω for the other two cases. Nonetheless, at 1.25 V
RHE the overall cell
resistances are in fact lower than the case where no membrane is placed or with Nafion®
membrane - Figure 12. The Bode plot on Figure 12b) explicitly shows the frequency-dependence of the impedance of the device under test; here, higher impedance is observed in the low frequencies range by exhibiting the presence of a semicircle. On the other hand, at higher frequencies range the impedance response does not show the small semicircle.
22 0.1 1 10 100 1000 10000 100000 0 -20 -40 -60 -80 P ha se / de grees Frequency / Hz 0 20 40 60 80 100 120 140 160 180 200 0 40 80 120 160 200 Z ' / b) WO3-Glass No Membrane
WO3-Glass Nafion® Membrane WO3-Glass Teflon® Diaphragm
Z'' / a) 0 5 10 15 20 0 5 10 15 20
Figure 12. Nyquist a) and b) Bode plots for the three situations under study: no membrane (□), with Nafion® (◊) and with Teflon® diaphragm (ᴏ) at an applied potential
of 1.25 VRHE. WO3-Glass - Sample of WO3 on TCO glass substrate.
Similarly to the WO3 sample on metal substrate, the produced hydrogen rate was
determined using Equation (2) and the corresponding solar-to-hydrogen efficiency was calculated using Equation (1). The obtained results are plotted in Figure 13 and they agree with the photocurrent trends observed in Figure 11; when Teflon® diaphragm is used,
both the produced rate of hydrogen and the solar-to-hydrogen efficiency are higher than for the cases of no membrane or Nafion® membrane. Concerning the device with Teflon®
diaphragm, a rate of 0.029 mmolH2·s-1 is produced at an applied of 1.45 VRHE,
corresponding to a solar-to-hydrogen efficiency of 0.14 %. On the other hand, for the device with no membrane, the hydrogen evolution rate is 0.019 mmol·s-1, corresponding
to a solar-to-hydrogen efficiency of 0.10 %; similar values of both hydrogen evolution rate and STH are obtained when a Nafion® membrane is placed between both electrodes
23 0.0 0.5 1.0 1.5 2.0 2.5 0.00 0.04 0.08 0.12 0.16 0.20 ST H / %
Applied Potential / VRHE
WO3-Glass No membrane WO3-Glass Nafion® Membrane WO3-Glass Teflon® Diphragm
0.00 0.02 0.04 0.06 0.08 R H 2 / m mo l · s -1
Figure 13. Left Axis: Hydrogen production rate (mmol·cm-2) for the case of not using
membrane (□), with Nafion® membrane (◊) and with Teflon® diaphragm (○). Right axis:
Solar-to-hydrogen PEC cell efficiency (%) for the case of not using membrane (■), with Nafion® membrane ( ) and with Teflon® diaphragm (●).WO
3-Glass: Sample of WO3 on
glass substrate.
3.2. Undoped-Fe2O3 photoelectrode on a glass substrate
Photoelectrodes of hematite work preferentially in strong alkaline media, normally 1 M of NaOH or KOH (pH 13.6), and thus protonic exchange membranes like Nafion®
cannot be used. On the other hand, Teflon® diaphragm is chemically stable at acid and
basic pH media and therefore more versatile than Nafion® membranes. A PEC device
composed by an undoped-Fe2O3 photoelectrode with a Teflon® diaphragm was studied.
The performance of this undoped-Fe2O3 photoanode was assessed using 2- and
3-electrode configurations, under dark and 1 sun illumination conditions. Then, the corresponding impedance spectra were obtained for applied potentials ranging from 1.00 to 1.80 VRHE.
Figure 14 shows the J-V characteristic curves for the undoped-Fe2O3 sample under
dark and illumination conditions, in 2- and 3-electrodes configuration, with and without Teflon® diaphragm. From Figure 14a), measured in a 2-electrode configuration, a
photocurrent density of 0.40 mA·cm-2 at 1.45 V
RHE is observed for the case where no
membrane was used and 0.47 mA·cm-2 at the same potential when a Teflon® diaphragm
24 photocurrent density. The produced photocurrent density of the undoped-Fe2O3 sample is
significantly higher than the one obtained with the WO3 sample deposited onto a TCO
glass substrate. On the other hand, comparing with the WO3 deposited onto metallic
substrates the photocurrent produced by the hematite sample is almost 50 % less. As expected, the samples deposited onto TCO glass substrates produce lower photocurrent densities than the samples deposited on metallic substrates, for all the studied cases.
0.8 1.0 1.2 1.4 1.6 1.8 0.0 0.2 0.4 0.6 0.8 1.0 3-electrode configuration Fe2O3-Glass No Membrane Fe2O3-Glass Teflon Diaphragm
Applied Potential / VRHE
0.8 1.0 1.2 1.4 1.6 1.8 0.0 0.2 0.4 0.6 0.8 1.0 b) 2-electrode configuration Fe2O3-Glass No Membrane Fe2O3-Glass Teflon Diaphragm
P ho toc urr en t Den si ty / m A · c m -2 a)
Figure 14. J-V characteristics for the undoped-Fe2O3 sample prepared by the USP method
in the dark and under 1 sun solar radiation without (□) and with Teflon® diaphragm (ᴏ)
under: a) 2- and b) 3-electrodes configuration. Fe2O3-Glass: Sample of Fe2O3 on TCO
glass substrate.
The hydrogen flow rate of the hematite photoelectrodes was again computed using Equation (2) and the corresponding solar-to-hydrogen efficiency was obtained using Equation (1) - Figure 15. Similarly, to what happened with the previous sample (WO3
-glass), the undoped-Fe2O3 sample tested with Teflon® diaphragm showed higher
hydrogen evolution rates than if no membrane is used: 0.10 mmolH2·s-1 and 0.12
mmolH2·s-1 with no membrane and with Teflon® diaphragm, respectively, at an applied
bias voltage of 1.45 VRHE. Consequently, the STH efficiency is also higher when the
25 0.8 1.0 1.2 1.4 1.6 1.8 0.0 0.2 0.4 0.6 0.8 1.0 ST H / %
Applied Potential / VRHE
Fe2O3-Glass No Membrane Fe2O3-Glass Teflon® Diaphragm
0.00 0.05 0.10 0.15 0.20 0.25 0.30 R H 2 / m mo l · s -1
Figure 15. Left Axis: Hydrogen production rate (mmol·cm-2) for the case of not using
membrane (□) or using a Teflon® diaphragm (○). Right axis: Solar-to-hydrogen PEC cell
efficiency (%) for the case of not using membrane (■) or using a Teflon® diaphragm (●).
Fe2O3-Glass - Sample of Fe2O3 on TCO glass substrate.
The EIS measurements give additional information concerning the charge transport in the different PEC cell parts, allowing a better understanding of the role of the Teflon®
diaphragm. Nyquist and Bode plots – Figure 16 - indicate the existence of two distinguished time-response of the system. The first semicircle in the Nyquist plot (second peak in the Bode diagram) corresponds to the higher frequencies range (100000 Hz – 1 Hz) and it is considerably smaller than the second semicircle, which responds in the low frequencies range (1 Hz – 0.1 Hz). Comparing the Nyquist plots of samples WO3-Glass
and Fe2O3-Glass, shown in Figures 12 and 16, it is noticed that the WO3 sample deposited
onto a TCO glass substrate shows a larger lower frequencies semicircle. Figure 16 also shows that the series resistance is higher for the device using the Teflon® diaphragm, in line with the results obtained before for the WO3-Glass and WO3-Metal samples.
26 0 25 50 75 100 0 25 50 75 100 1.45 V RHE 1.25 VRHE 1.00 VRHE 1.45 VRHE 1.25 VRHE Fe2O3-Glass No Membrane Fe2O3-Glass Teflon® Diaphragm
Fe2O3-Glass No Membrane Fe2O3-Glass Teflon® Diaphragm
Z' ' / Z' / 1.00 VRHE 1 10 100 1000 10000 100000 0 20 40 60 80 Phas e angle / D egrees Frequency / Hz 0 5 10 15 20 25 0 5 10 15 20 25 Z' ' / Z' / 1 10 100 1000 10000 100000 0 10 20 30 40 Phas e angle / D egrees Frequency / Hz 0 5 10 15 20 25 0 5 10 15 20 25 Semicondctor + Electrolyte Counter Electrode Z' ' / Z' / Ohmic losses 1 10 100 1000 10000 100000 0 10 20 30 Phas e angle / D egrees Frequency / Hz 1 10 100 |Z | / 1 10 100 |Z | / 1 10 100 |Z | / 0 5 10 15 20 25 0 5 10 15 20 25 Z' ' / Z' /
Figure 16. Nyquist and Bode plots for the two situations under study: without membrane (□) and with Teflon® diaphragm (ᴏ) at an applied potential of 1.00, 1.25 and 1.45 V
RHE.
Fe2O3-Glass - Sample of Fe2O3 on TCO glass substrate.
In a 2-electrode configuration EIS measurement, the system response allows studying the overall charge transfer phenomena occurring at: i) the semiconductor, ii) within the electrolyte and iii) at the counter-electrode of the cell. To identify the frequency response of the individual elements that compose the PEC cell, a previous study was carried out in a cell comprising a platinum mesh as counter-electrode and a similar platinum mesh as working electrode, both immersed in a 1 M KOH, with and without Teflon® diaphragm
– Figure 17. This is the well-known dummy cells characterization. Analyzing the Pt-Pt EIS measurements, a difference of 16 Ω is observed in the series resistances values when a membrane is placed or not between both electrodes - Figure 17b). Thus, the membrane resistance contribution appears on the series resistance confirmed by the Pt-Pt EIS experiment. To confirm the frequency range when the counter-electrode responds, the EIS data response of a PEC cell comprising a photoanode of undoped-Fe2O3 as working
27 cell. As shown in Figure 17a) the first semicircles in both situations correspond to the high frequencies range; the low frequency semicircle was correlated to the semiconductor/electrolyte diffusion processes.
0 5 10 15 20 25 30 35 0 5 10 15 20 25 30 35 b) Fe2O3-Glass No Membrane Pt-Pt No Membrane Z '' / Z ' / a) 0 5 10 15 20 25 30 35 0 5 10 15 20 25 30 35 R s Rs z z Pt-Pt No Membrane Pt-Pt Teflon® Diaphragm Z '' / Z ' /
Figure 17. a) Nyquist plots comparing a PEC system with undoped-Fe2O3 under 1 sun
illumination ( ) and a dummy cell ( ), at an applied bias potential of 1.5 VRHE and 2.3
VRHE, respectively. b) Nyquist plots comparing the Pt-Pt PEC system with ( ) and without
a Teflon® diaphragm ( ) at 2.3 V RHE.
4. Conclusions
An innovative PEC cell was presented and tested using three different photoelectrodes: WO3 applied on metal and on TCO-glass substrate and undoped
hematite deposited on TCO-glass substrate. The WO3 photoelectrodes were deposited by
two different techniques: i) anodized WO3 photoelectrodes on a metal substrate and ii)
WO3 deposited by blade spreading method on a TCO glass substrate. The undoped-Fe2O3
photoanode was deposited by ultrasonic spray pyrolysis (USP). The highest photocurrent density was obtained with photoelectrode WO3-Metal, ca. 0.90 mA·cm-2 at 1.45 VRHE,
which corresponds to a hydrogen evolution rate of ca. 0.27 mmolH2·s-1 and a STH
efficiency of 1.28 %. With transparent photoelectrodes, partially due to the higher charge transport resistance imposed by the TCO layer on glass substrates, the produced
28 photocurrent was lower: 0.30 mA·cm-2 and 0.40 mA·cm-2 for the WO
3 and
undoped-Fe2O3, respectively.
The proposed Teflon® diaphragm was successfully implemented in the new PEC cell,
with ca. 47 % photocurrent density enhancement when transparent WO3 photoelectrode
was used. Indeed, despite the Teflon® diaphragm increased the series resistance due to its
higher charge resistance, it also allowed that the fraction of the light lost through the transparent photoelectrode is then reflected back, leading to a higher photocurrent. However, it should be emphasized that a thinner and pre-treated Teflon® diaphragm for
removing the air trapped in the pores should result in a negligible extra charge transport resistance. The use of the Teflon® diaphragm on the top of the cell is another important
feature of this newly disclosed PEC device. Its usage on top of the cell allows tilting the cell with no leakage in a tracking system for harvesting the maximum solar radiation at each moment; this is actually a crucial feature for outdoor applications.
Acknowledgment
T. Lopes and P. Dias are grateful to the Portuguese Foundation for Science and Technology (FCT) for their PhD fellows (references: SFRH/BD/62201/2009 and SFRH/BD/62201/2009, respectively). L. Andrade acknowledges European Research Council for funding within project BI-DSC – Building Integrated Dye sensitized Solar Cells (Contract number: 321315). The authors acknowledge also the European Commission for funding (Project NanoPEC - Nanostructured Photoelectrodes for Energy Conversion; contract number 227179) and the Portuguese Foundation for Science and Technology (FCT) through the project H2Solar (PTDC/EQU-EQU/104217/2008). The authors are also very thankful to Dr. Laura Meda from Istituto ENI-Donegani and Dr. David Tilley and Professor Michael Grätzel from LPI-EPFL group for providing the photoelectrodes of WO3 and Fe2O3, respectively. The authors acknowledge Fernando
29
References
[1] World Energy Outlook 2008, OECD Publishing, 2008. [2] World Energy Outlook 2011, OECD Publishing, 2011.
[3] The Energy Report: 100% Renewable Energy by 2050, in: S. Singer (Ed.), World Wide Fund for Nature International, 2011.
[4] F. Trieb, Concentrating Solar Power for the Mediterranean Region, in: DLR (Ed.) Final Report, German Aerospace Center 2005.
[5] L.J. Minggu, W.R. Wan Daud, M.B. Kassim, An Overview of Photocells and Photoreactors for Photoelectrochemical Water Splitting, International Journal of Hydrogen Energy, 35 (2010) 5233-5244.
[6] A. Fujishima, K. Honda, Electrochemical Photolysis of Water at a Semiconductor Electrode, Nature, 238 (1972) 37-38.
[7] O. Khaselev, J.A. Turner, A Monolithic Photovoltaic-Photoelectrochemical Device for Hydrogen Production via Water Splitting, Science, 280 (1998) 425-427.
[8] J.Y. Kim, G. Magesh, D.H. Youn, J.-W. Jang, J. Kubota, K. Domen, J.S. Lee, Single-Crystalline, Wormlike Hematite Photoanodes for Efficient Solar Water Splitting, Nature - Scientific Reports 3(2013).
[9] F. Osterloh, B. Parkinson, Recent developments in solar water-splitting photocatalysis, MRS Bulletin, 36 (2011) 17-22.
[10] R.v.d. Krol, M. Grätzel, Photoelectrochemical Hydrogen Production, Springer US, 2012.
[11] L. Han, F.F. Abdi, P. Perez Rodriguez, B. Dam, R. van de Krol, M. Zeman, A.H.M. Smets, Optimization of Amorphous Silicon Double Junction Solar Cells For an Efficient Photoelectrochemical Water Splitting Device Based on a Bismuth Vanadate Photoanode, Physical Chemistry Chemical Physics, 16 (2014) 4220-4229.
[12] E.L. Miller, N. Gaillard, J. Kaneshiro, A. DeAngelis, R. Garland, Progress in new semiconductor materials classes for solar photoelectrolysis, Int. J. Energy Res., 34 (2010) 1215-1222.
[13] V.M. Aroutiounian, V.M. Arakelyan, G.E. Shahnazaryan, G.M. Stepanyan, E.A. Khachaturyan, J.A. Turner, Investigations of the structure of the iron oxide semiconductor-electrolyte interface, Comptes Rendus Chimie, 9 (2006) 325-331.
[14] R.V.d. Krol, Y. Liang, J. Schoonman, Solar Hydrogen Production with Nanostructured Metal Oxides, Journal of Materials Chemistry, 18 (2008) 2311-2320.
30 [15] F.F. Abdi, L. Han, A.H. Smets, M. Zeman, B. Dam, R. van de Krol, Efficient Solar Water Splitting by Enhanced Charge Separation in a Bismuth Vanadate-Silicon Tandem Photoelectrode, Nature communications, 4 (2013).
[16] R. Liu, Y. Lin, L.-Y. Chou, S.W. Sheehan, W. He, F. Zhang, H.J.M. Hou, D. Wang, Water Splitting by Tungsten Oxide Prepared by Atomic Layer Deposition and Decorated with an Oxygen-Evolving Catalyst, Angewandte Chemie International Edition, 50 (2011) 499-502.
[17] X. Yang, C. Du, R. Liu, J. Xie, D. Wang, Balancing photovoltage generation and charge-transfer enhancement for catalyst-decorated photoelectrochemical water splitting: A case study of the hematite/MnOx combination, Journal of Catalysis, 304 (2013) 86-91.
[18] Y. Lin, G. Yuan, S. Sheehan, S. Zhou, D. Wang, Hematite-based solar water splitting: challenges and opportunities, Energy & Environmental Science, 4 (2011) 4862-4869.
[19] L.-Y. Chou, R. Liu, W. He, N. Geh, Y. Lin, E.Y. Hou, D. Wang, H.J. Hou, Direct oxygen and hydrogen production by photo water splitting using a robust bioinspired manganese-oxo oligomer complex/tungsten oxide catalytic system, International Journal of Hydrogen Energy, 37 (2012) 8889-8896.
[20] T. Lopes, L. Andrade, A. Mendes, Photoelectrochemical Cells for Hydrogen Production from Solar Energy in: N.E.A. Akbarzadeh (Ed.) Solar Energy Sciences and Engineering Applications, CRC Press, 2013.
[21] Z. Chen, T.F. Jaramillo, T.G. Deutsch, A. Kleiman-Shwarsctein, A.J. Forman, N. Gaillard, R. Garland, K. Takanabe, C. Heske, M. Sunkara, E.W. McFarland, K. Domen, E.L. Miller, J.A. Turner, H.N. Dinh, Accelerating Materials Development for Photoelectrochemical Hydrogen Production: Standards for Methods, Definitions, and Reporting Protocols, Journal of Materials Research, 25 (2010) 3-16.
[22] J. Brillet, J.-H. Yum, M. Cornuz, T. Hisatomi, R. Solarska, J. Augustynski, M. Graetzel, K. Sivula, Highly efficient water splitting by a dual-absorber tandem cell, Nat Photon, 6 (2012) 824-828.
[23] I. Cesar, Solar Photoelectrolysis of Water with Translucent nanostructured Hematite Photoanodes, in, EPFL, Lausanne, 2007.
[24] D.I. Tchernev, Device for solar energy conversion by photo-electrolytic decomposition of water, in: Patent File Date: Filed date 2 Jan 1974, 1975, pp. Medium: X; Size: Pages: 6.
31 [25] A.J. Nozik, Photoelectrolysis of water by solar radiation, in: Patent File Date: Filed date 26 Nov 1976, 1978, pp. Medium: X; Size: Pages: 16.
[26] R. Krol, J. Schoonman, Sustainable Energy Technologies, in: R. Krol, M. Graetzel (Eds.) Photo-Electrochemical Production of Hydrogen Springer Netherlands, 2008, pp. 121-142.
[27] A. Tacca, L. Meda, G. Marra, A. Savoini, S. Caramori, V. Cristino, C.A. Bignozzi, V.G. Pedro, P.P. Boix, S. Gimenez, J. Bisquert, Photoanodes Based on Nanostructured WO3 for Water Splitting, ChemPhysChem, 13 (2012) 3025-3034.
[28] L. Meda, G. Tozzola, A. Tacca, G. Marra, S. Caramori, V. Cristino, C. Alberto Bignozzi, Photo-Electrochemical Properties of Nanostructured WO3 Prepared with
Different Organic Dispersing Agents, Solar Energy Materials and Solar Cells, 94 (2010) 788-796.
[29] F. Le Formal, M. Grätzel, K. Sivula, Controlling Photoactivity in Ultrathin Hematite Films for Solar Water-Splitting, Advanced Functional Materials, 20 (2010) 1099-1107. [30] A. Mendes, T. Lopes, L. Andrade, P. Dias, Células Fotoeletroquímicas e Processo da sua construção, in: p. pending. (Ed.) patent pending, Portugal, 2013.
[31] T. Lopes, L. Andrade, H.A. Ribeiro, A. Mendes, Characterization of photoelectrochemical cells for water splitting by electrochemical impedance spectroscopy, Int. J. Hydrogen Energy, 35 (2010) 11601-11608.
[32] P. Dias, T. Lopes, L. Andrade, A. Mendes, Temperature effect on the water splitting using a Si-doped hematite photoanode, Under submission, (2014).
[33] P. Dias, T. Lopes, L. Andrade, A. Mendes, The role of the TCO support on the performance of photoelectrochemical cells for water splitting, Under submission, (2013).
![Figure 3. No-biased single photo-system configurations for solar water splitting (SC - semiconductor; M – metal) - (adapted from reference [5]): a) n-type semiconductor photoanode and a metal counter-electrode; b) p-type semiconductor photoca](https://thumb-eu.123doks.com/thumbv2/123dok_br/19175807.943126/7.892.136.759.323.614/configurations-splitting-semiconductor-reference-semiconductor-photoanode-electrode-semiconductor.webp)