V. 9 N. 1 [2016] pp. 209–235
Abstract: Active travel is enthusiastically promoted in the Western
world due to its clear and demonstrated individual and collective ben-efits. While active travel has been shown to be associated with features of the built environment such as density and land-use mix, it is also associated with walking and cycling accessibility—which we designate as active accessibility. However, the measurement of active accessibil-ity is not straightforward and it can represent significantly different features of the built environment. This paper presents an extensive review of published research that measures active accessibility. We classified the literature into four categories based on the methodology used: distance-based, gravity-based or potential, topological or infra-structure-based, and walkability and walk score-type measures. A fifth category was created to classify outliers consisting of distinct method-ological approaches or hybrids of the four main categories. We argue that almost all of these methods have conceptual and computational limitations, and that there are inconsistencies in the use of concepts and terms. Furthermore, no sensitivity analysis was carried out on the selected parameters. We conclude by presenting some guidelines that might improve the value and clarity of active accessibility research, theory, and practice.
Keywords: Accessibility, active travel, walking, cycling,
non-motor-ized accessibility, pedestrian accessibility, bicycle accessibility, walk-ability, bikeability
1
Introduction
Active travel, i.e., walking and cycling, is enthusiastically promoted in the Western world. These travel modes have clear and demonstrated individual as well as collective benefits, which encompass climate
Active accessibility: A review of operational measures of walking
and cycling accessibility
David S. Vale
Miguel Saraiva
University of Lisbon University of Lisbon
dvale@fa.ulisboa.pt miguelsaraiva@fa.ulisboa.pt
Mauro Pereira
University of Lisbon mauro.pereira@fa.ulisboa.pt Article history: Received: Nov. 29, 2013 Accepted: Nov. 20, 2014 Available online: June 5, 2015Copyright 2015 David S. Vale, Miguel Saraiva, and Mauro Pereira
http://dx.doi.org/10.5198/jtlu.2015.593
ISSN: 1938-7849 |Licensed under the Creative Commons Attribution – Noncommercial License 3.0
The Journal of Transport and Land Use is the official journal of the World Society for Transport and Land Use (WSTLUR) and is published and sponsored by the University of Minnesota Center for Transportation Studies. This paper is also published with sponsorship from WSTLUR and the Institutes of Transportation Studies at University of California, Davis and University of California, Berkeley.
210
change mitigation, pollution and noise reduction, urban vitality, public health, obesity, not to mention the individual and collective financial benefits. One of the ways in which active travel is promoted is by altering the characteristics of the built environment in which the individuals live and move, as it has been shown that the built environment has a clear influence on travel behavior and active travel in par-ticular (Handy et al. 2002; Forsyth et al. 2008; Brownson et al. 2009).
One important aspect of the built environment is accessibility. Accessibility can be defined as the ability to reach relevant activities, individuals or opportunities, which might require traveling to the place where those opportunities are located (Handy 2005). There are two main approaches to measuring accessibility: place-based, which is focused on the physical separation of key locations for individuals; and individual-based, which is focused on the space-time restrictions of individuals themselves (Horner 2004). These two approaches are intimately related as in place-based accessibility, locations represent clusters of entities and/or actors, and accessibility reflects an individual’s potential space-time prism when the individual is in that location (Harris 2001; Vale 2010). Therefore, from both perspectives, accessibility is determined by the spatial distribution of destinations, the ease of reaching them, and the quality and character of the activities found at the destinations (Handy and Niemeier 1997). In this pa-per, we adopt the meaning of “the ability to reach relevant activities, individuals or opportunities,” which necessarily requires traveling from the place where accessibility is being measured to the place in which opportunities are located. We are therefore focusing our analysis in place-based accessibility.
Methodologically, there are three main approaches to measuring place-based accessibility: infra-structure-based measures, activity-based measures, and utility-based measures (Geurs and van Eck 2001; Halden et al. 2000; Kwan 1998). Infrastructure-based measures are based exclusively on features of the street and transportation network and are insensitive to the location of activities in space. Activity-based measures (also designated gravity-based or Hansen-type measures) are based on the gravity model and weight opportunities according to a travel impedance function. The accessibility of a place is therefore assessed as the combined effect of the size of opportunities and the cost of traveling to them. Finally, utility-based measures (also designated benefit measures) are developed from microeconomic random utility theory, and describe accessibility as the result of a (rational) choice from a set of destination-transportation alternatives.
Nowadays, information and communication technologies (ICT) have transformed space-time, al-lowing several activities to be performed asynchronously and/or remotely. However, the relationship be-tween ICT, accessibility and travel is extremely complex and they can both substitute and complement each other (Miller 2005). As Tobler’s first law of geography states, “everything is related to everything else, but near things are more related than distant things” (Tobler 1970, p. 236); consequently spatial accessibility remains an important feature of space, reflecting the ease of reaching opportunities.
In this paper, we restrict our analysis to accessibility by active travel. Several terms have been used in literature to express this concept, including walking accessibility, pedestrian accessibility, non-motorized accessibility, walkability, bicycle accessibility, and bikeability. Although non-motorized accessibility is often used to designate walking and cycling, it is being replaced by active travel or human-powered transportation. This is because these modes are associated with the concept of physical activity, which is defined by the World Health Organization as “any bodily movement produced by skeletal muscles that requires energy expenditure,” and includes walking, cycling, and participating in sports. Therefore, in line with these concepts, here we adopt the term “active accessibility,” to express accessibility by active travel, i.e., accessibility by walking and cycling.
Although active accessibility is easy to understand and explain it is inconsistently measured. It has been measured at different scales, with different variables, methods and strategies. There is therefore a risk that the same concept may represent different phenomena. In this paper, we review objective active
accessibility measures, and deliberately exclude perceived accessibility measures. Thus, it is a method-ological review of active accessibility measures that can be applied in a variety of urban contexts. Al-though there are other reviews of accessibility measures (Geurs and Van Wee 2004; Iacono, Krizek, and El-Geneidy 2010; Maghelal and Capp 2011; Talen and Koschinsky 2013), this analysis fills a gap in the literature as it focuses exclusively on active accessibility and operational measures that can be reproduced in different contexts. In this sense it provides a categorized portfolio of current active accessibility mea-sures. Moreover, we provide a theoretical-methodological evaluation framework that makes explicit the implicit assumptions in each measure, thereby improving the clarity of the evaluation.
This paper is organized as follows. In the next section we briefly discuss the relationship between the built environment and active travel, and the relationship with active accessibility. Then we present the methodology used to identify, collect, and classify published research on operational active accessibility measures. In Section 4 we present and describe the literature included in the review, which is divided into four main categories. The paper finishes with a discussion of the theoretical and practical aspects of our research, the advantages and limitations of our methodologies, and some proposals to improve the measurement of active accessibility.
2
The built enviroment, active travel, and accessibility
The Behavioral Model of the Environment (Lee and Moudon 2004; Moudon and Lee 2003) provides a theoretical and conceptual framework for the way in which the built environment relates to mobil-ity and shapes accessibilmobil-ity. This model takes a socio-ecological perspective, and emphasizes that not only socio-cultural factors but also physical environmental factors are important to change and explain behavior. The model is composed of three environmental components: the origins and destinations of trips, route characteristics of trips, and the characteristics of the area around origins and destinations. The variables that are used to measure these three components are not mutually exclusive, as many address more than one component. Accessibility is one example: In order to measure the accessibility of an origin with respect to one or more destinations two components are simultaneously evaluated, namely origins and destinations and route characteristics. It could even be argued that accessibility is a three-component variable, as the characteristics of the area around origins and destinations are also often used as parameters in accessibility indicators. Examples include topological measures, which focus on the characteristics of the network around origins and destinations, and therefore implicitly reveal the characteristics of an area around the measurement point.
In the last decade there have been several reviews in the travel-behavior and public-health literature of the relationship between the built environment and active travel or physical activity that focus on some or all of these three components (Forsyth et al. 2007; Forsyth et al. 2008; Lee and Moudon 2006; Pikora et al. 2003; Saelens and Handy 2008; Saelens, Sallis, and Frank 2003; Talen and Koschinsky 2013; Handy et al. 2002; Brownson et al. 2009; Ewing and Handy 2009). Although most of these studies are focused on North American and Australian cities, the findings provide a valuable and suit-able framework for the evaluation of other urban situations. It is often the case that a range of objective variables is used to analyze and characterize the built environment, and they can be used to measure the same characteristic in a variety of ways. They can be grouped into six influential environmental factors: density (residential, employment, or both), diversity (land-use mix and destinations), distance (proxim-ity or accessibil(proxim-ity), route characteristics (street connectiv(proxim-ity and qual(proxim-ity of the infrastructure), safety (both personal and from traffic), and aesthetic qualities (trees, parks and open spaces, bus shelters, etc.). Topography (slope) is almost exclusively referenced in cycling travel research (Pikora et al. 2003; Saelens, Sallis, and Frank 2003). Different domains of physical activity may be related to different features of the built environment. For instance, leisure-time physical activity tends to be associated with access to
212
recreation facilities, while transportation physical activity tends to be associated with access to destina-tions and infrastructure in general.
Whatever the motivation, the active travel trip is important in itself (Handy et al. 2002) due to the personal benefits that are derived from walking or cycling. Walking and cycling are intrinsically social activities and the pedestrian and cyclist develop a particular relationship with the built environment. This translates into other characteristics of the built environment such as aesthetics, safety and security, comfort, and also urban design qualities such as imageability, enclosure, human scale, transparency and complexity (Ewing and Handy 2009). These characteristics can become as important as density, land-use diversity, or street connectivity in explaining active travel behavior.
Figure 1: Relationship between built environment factors and active accessibility
Active accessibility is either implicitly or explicitly included in the measurement of the built environ-ment (Figure 1). In practice, density is often used as an implicit proxy for overall accessibility, as denser places have more facilities and opportunities nearby. Likewise, the distance to the closest facility is an explicit measurement of accessibility. Route characteristics such as street connectivity are other explicit accessibility measures, while infrastructure quality has a clear impact on accessibility. Diversity (mea-sured by indicators such as land-use mix) implicitly measures accessibility, because a place with a greater mix of land-use facilitates access to a broader range of opportunities or facilities. Diversity (measured by indicators such as intensity) can also be an explicit measure of accessibility, as it measures the number of facilities in the surrounding area. Therefore, accessibility cannot be separated from the built environ-ment, as several of the physical features of the built environment are closely linked with, and influence accessibility.
Likewise, there is typically high collinearity between the physical features that make up the built environment, which are normally used to measure its quality. A clear example is the walkability concept (Frank et al. 2005; Frank et al. 2006), which is a composite index of several built environment variables. Walkability reflects both the potential of a space to be walkable and the ability to access facilities on foot. Finally, the creation of a spatial threshold around an origin or destination in order to measure its walking or cycling potential implicitly measures accessibility, because the boundary itself is a measure of imped-ance of access to certain opportunities.
Active accessibility, therefore, can be defined as the ability of an individual to reach relevant activi-ties by active travel alone. It can be either a place-based or an individual-based measure, and the special needs of older people, children, disabled people, and other groups can be taken into consideration. It involves the analysis of walking and cycling infrastructure and the calculation of available routes (see, for instance, Church and Marston 2003; Dong et al. 2006; Achuthan, Titheridge, and Mackett 2010). An important and often disregarded issue when measuring the built environment is the modifiable area unit problem, which translates into arbitrarily defined boundaries and has two impacts: a scale ef-fect (the spatial resolution), and a zoning efef-fect (the configuration of the spatial units) (Clark and Scott 2013; Brownson et al. 2009). Indeed, apparently simple measures such as density can assume different values when measured at different spatial scales and with different spatial units (Forsyth et al. 2007). An-other limitation of most early research is that it mainly focuses on the features of the built environment around the home, as it assumes that the active trip begins at home. However, the actual travel pattern of the population is becoming increasingly complex, and consequently the characteristics of the built environment around the workplace (for instance) can be as important in explaining travel behavior and modal choice. Finally, other variables that have been found to be relevant to explain travel behavior, such as parking availability and cost (Hess 2001; Vale 2013) are largely ignored in the active travel literature (Bradshaw 1993 is an exception). However, they may be extremely important in explaining active travel behavior, as they may decrease the utility of car travel, and therefore contribute to an increase in walking and cycling.
3
Methodology
In September 2013, we carried out a systematic literature review of papers written in English and pub-lished in peer-reviewed journals and conference proceedings. Our research tools included ScienceDirect, the Web of Science™, the Transportation Research Board’s Transport Research International Documen-tation (TRID) database and Google Scholar. We used the following keywords: walking accessibility, pedestrian accessibility, bicycle accessibility, cycling accessibility, non-motorized accessibility, walkability, and bikeability. We also included a recently published report from a European research project that identifies accessibility instruments and methods that can be used as planning tools (Hull, Silva, and Bertolini 2012), from which we selected methods that discuss walking or cycling. Other reviews were included in order to validate our research and identify other relevant methodologies (Geurs and Van Wee 2004; Iacono, Krizek, and El-Geneidy 2010; Maghelal and Capp 2011; Talen and Koschinsky 2013). From the papers that were identified, only those that explicitly measured accessibility through the physical aspects of the built environment were selected, which led to a total of 84 papers. In terms of mode of travel, these papers can be classified into four major groups (literature reviews excluded): walk-ing, bicyclwalk-ing, active travel, and public transport and active travel. Walking accessibility made up the largest group (32 papers), followed by public transport and active travel (25 papers), active travel alone (16 papers), and bicycle accessibility (6 papers).
Following the work of Handy and Niemeier (1997) and Miller (2005), we developed a theoretical-methodological evaluation framework in order to review and classify in detail the active accessibility methodologies we found (see Table 1). This evaluation framework is based on the whole range of speci-fication issues that the researcher must consider when designing his or her accessibility measurement method. It should be noted that two issues were not included in the analysis: socioeconomic disaggrega-tion and temporal disaggregadisaggrega-tion. This was because almost none of the identified accessibility measures took them into account (Horacek et al. 2012, for example, is an exception).
214
Several of the accessibility measures we identified had other specificities that could not be included or evaluated within our initial theoretical framework. These measures did not strictly relate to accessibil-ity and often included it in a broader built environment evaluation based on a common framework. Examples include: land-use mix, density (residential population and employment) and safety, together with the infrastructure characteristics of networks such as intersection density or count, node/link ratio, block length, and sidewalk continuity and quality. Other important characteristics of the built environ-ment, such as slope and parking, were mentioned in some studies. We therefore complemented the ini-tial evaluation framework presented above with a description of the built environment features included in each methodology.
4
Active accessibility: methodological review
Authors agree on the definition of four major categories of place-based accessibility measures: (i) activity-based, which can include gravity-based (also designated attraction-accessibility or potential) and cumu-lative opportunities measures (also referred to as isochrone or contour measures); (ii) topology-based, which include topological measures of the network; (iii) distance-based, which include analyses of the closest facilities, and (iv) utility-based, also referred to as benefits measures (Handy and Clifton 2001; Church and Marston 2003; Dong et al. 2006; Vale 2010; El-Geneidy and Levinson 2011). Using these four major types we categorized active accessibility studies based on their methodological and computa-tional similarities. This led to an immediate, major decision, namely to exclude utility-based measures. These measures are based on concepts of rational behavior and utility maximization, and describe ac-cessibility as the result of a (rational) choice from a set of destination-transportation alternatives. The existence of a random component, which assumes that not all individuals in the same location have the same accessibility to the same opportunities, and which needs to be based on prior surveys, and the inherent difficulty in interpreting, explaining, and comparing these measures, led them to be excluded from this review. We also noted that, in the case of pedestrian accessibility, a fifth category of measures
Table 1: Specification issues used to evaluate accessibility measures
Specification issue Summary/key questions
Disaggregation
Spatial Which spatial units are being used (spatial resolution)? Socio-economic Distinguish different socio-economic groups, reflecting
differ-ent needs and constraints Trip purpose Work and/or non-work trips
Transportation mode Walk, Cycle, Active Modes (Walk and Cycle), Active Modes and Public Transport
Temporal Different times of the day (peak versus off-peak travel / avail-ability of opportunities)
Places of reference (origins and destinations
Origin-based and/or destination-based measures?
Which places (related to trip purpose) are considered destinations / what opportunities are being considered?
Attractiveness of opportunities
How to measure opportunities (binary, count number for aggregate destination, square footage, etc.)?
Travel distance, time, cost or combination of them?
Travel impedance
How to measure travel impedance (Euclidean, Manhattan, network distances)? Which impedance function (inverse power, negative exponential, modified Gaussian, cumulative opportunities), and how to calibrate its parameters?
could be identified. As no definition exists, we designated them as “walkability” or “walk score-type” measures. They are related to two well-known and popular methodologies, which combine some of the accessibility measures previously mentioned and others that include land-use/built-environment measures.
The result of our analysis of over 80 accessibility measures led to a grouping into four, slightly rear-ranged, categories, namely: (i) distance-based; (ii) gravity-based; (iii) topological or infrastructure-based; and (iv) walkability or walk score-type. These categories, their respective subdivisions, and the method-ologies contained therein are summarized in Figure 2. The following sections provide a brief description of each category, the variables used, accessibility algorithms, and the studies that contributed to their definition. We also identify small differences between methodologies included in the same category, group or type. Around 10 methodologies could not be grouped, as they proved to be special cases, com-binations of the other four categories, or distinct methodologies that included relevant keywords in the title. An example is “walk score,” used in the eco-friendly walk score developed by Lwin and Murayama (2011). These methodologies are briefly described in section 4.5.
216
It could be argued that these four accessibility measurement categories serve distinct purposes. Distance-based measures are useful if opportunities are seen as perfect, or near-perfect, substitutes. Examples are accessibility to emergency services, bus stops, or supermarkets, where it is assumed that an individual wants to access the closest possible opportunity, and all opportunities provide the same benefit. Gravity-based measures (including cumulative opportunities measures) are useful if opportunities are seen as complementary, and travel (time or distance) is seen as a cost to be minimized or kept within a certain acceptable value. Examples are accessibility to jobs, other residents, commerce and services, or public parks, where more is better, and being closer represents higher accessibility. Topological accessibility measures can be used to analyze the impact the road network has on movements and therefore overall accessibility. Although these measures do not evaluate existing opportunities, they can be very useful as planning tools—either to identify intervention priorities—or to identify the potential impacts of urban development proposals. Finally, walkability (including bikeability) measures are useful as overall indica-tors of the active travel conditions in spaces, and are very popular in the health literature as explanatory variables for the health of residents.
4.1 Distance-based accessibility measures
Distance-based accessibility measures consider accessibility simply as a function of the spatial separation between places, i.e., accessibility is a synonym of proximity, and therefore higher separation implies lower accessibility. Apparicio et al (2008) defines four categories of accessibility: 1) distance to the closest opportunity; 2) the number of opportunities within n meters or minutes; 3) the mean distance to all opportunities; and 4) the mean distance to the n closest opportunities. However, we argue that cumula-tive opportunities measures, which have as output the number of opportunities, should be regarded as a particular case of gravity-based or potential measures, in which the impedance function of equation (1) is rectangular1 (see below). They are therefore discussed in the next section.
It should be noted that distance-based accessibility measures are extremely sensitive to the way in which travel impedance (i.e., distance) is measured. Accordingly, four types of distance can be identified: Euclidean distance, Manhattan distance, shortest network distance, and shortest network time. Only one article in this category used “straight line” distance (Shen 2002), although it should be noted that it was one of the oldest articles included in the review. Additionally, for a pedestrian the shortest network distance and shortest network time are normally the same, as the travel speed of the walker is similar across all street segments. However, for a cyclist, the shortest network time route can be completely dif-ferent from the route that has the shortest network distance, as the cyclist often chooses the flattest route to reduce his or her physical effort. Even for a pedestrian, a significant slope can considerably reduce travel speed and/or affect the choice of route. Here again, the shortest network time route may be dif-ferent to the route that has the shortest network distance. None of the methodologies included in this category specifically addressed bicycle use, but instead included walking measures that were applied to cycling, while only Pearce, Witten, and Bartle (2006) considered slope.
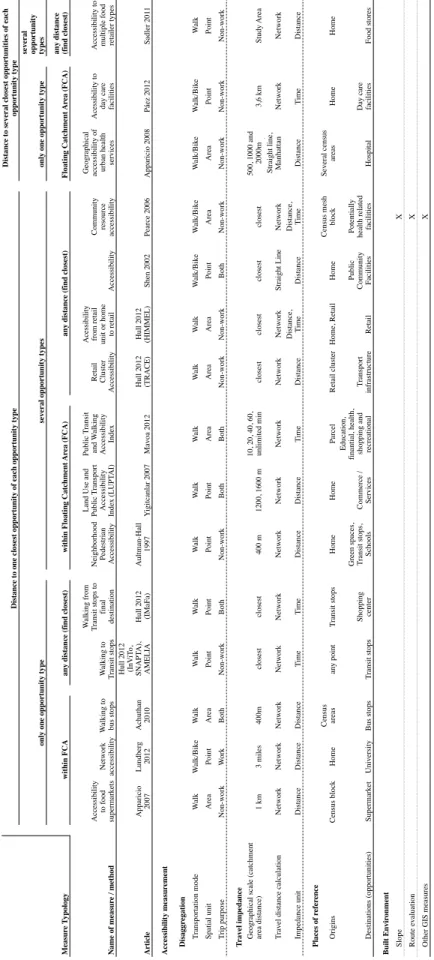
Within this category, we identified two subgroups (Table 2). The first calculates the distance to the single closest opportunity of each type (18 papers). The second is more rare (3 papers) and is based on a calculation of the distance to several closest opportunities of each type. Both of these subgroups can again be divided into methodologies that measure only one opportunity type (the closest or the n closest supermarkets, for example) and those which measure several opportunity types (the closest or the n clos-est supermarkets, banks, bakeries, and so on). The final division identifies methodologies that are based on a floating catchment area (FCA) and those that find the closest opportunity, regardless of distance.
Beginning with the group of methodologies where accessibility is represented by a single distance measurement from one point to the closest pre-defined opportunity, we found seven papers. Lundberg 1This function has a value of 1 between [0, x] and a value of 0 between [x, ∞]
(2012) examined the shortest distance between home and a university campus, while Apparicio and colleagues (Apparicio et al. 2008; Apparicio, Cloutier, and Shearmur 2007) considered, respectively, the shortest distance to the closest supermarket, and the closest health facility. The latter two papers test and compare several methodologies and use several maximum distance values. Apparicio, Cloutier, and Shearmur (2007) calculated the single shortest distance to three different supermarkets (i.e., several opportunity types) and counted homes within a given buffer (a cumulative opportunities measure, see below), while Apparicio et al. (2008) calculated the distance to the three, the five and all closest health facilities (several closest opportunities of one type), counted health facilities within a given buffer and examined a gravity-based measure (see also the following section). All of the other methodologies in this group measured accessibility as the distance (generally measured by travel time) to reach a transit station (the opportunity), or from a transit station to a final destination. However, this only represents a part of the public transport trip and the measurement of the entire trip is beyond the scope of this paper; here we only look at walking access to and from stops. The AMELIA, InVito and SNAPTA methodologies assess the cost of reaching a transit stop on foot (only AMELIA uses a floating catchment area and dis-tance as an impedance unit), while IMaFA assesses the cost (in time) of walking from a transit stop to the final destination (Achuthan, Titheridge, and Mackett 2007, 2010; Hull, Silva, and Bertolini 2012).
The work of Yigitcanlar et al. (2007) and Mavoa et al. (2012) presents broader methods that take into account multi-modal transportation. They include walking as a way to access a transit station within a floating catchment area, measured by travel time. However, these studies evaluate multiple op-portunities: 13 and 17 land-use types, respectively. Similarly, Aultman-Hall, Roorda, and Baetz (1997) calculates the shortest distance to five different destinations in a given catchment area. However, most papers that evaluate multiple opportunities are not bounded by a maximum distance. For example, accessibility is calculated as the shortest distance to each of six food stores in the study area, to 16 health-related destinations, to a range of commercial or service facilities (HIMMEL), a range of infrastructure (TRACE), and various community facilities (Sadler, Gilliland, and Arku 2011; Pearce, Witten, and Bartie 2006; Hull, Silva, and Bertolini 2012; Shen 2002).
As highlighted above, there are significantly fewer research methods that consider both the shortest distance to a given opportunity, and the nth closest opportunities. Apparicio et al. (2008) measured the distance to the three, the five and all the closest health facilities and Páez, Scott, and Morency (2012) measured the distance (in travel time) to all daycare facilities within a floating catchment area. Only Sadler Gilliland, and Arku (2011) measured the distance to the two and the three closest opportunities for each of six different food stores for which the closest distance had already been calculated.
It should be noted that methodologies that include a floating catchment area do not agree on the definition of its size. Values range from the classic 400 meters (0.25 miles) to almost 4 kilometers (2.4 miles) (Páez, Scott, and Morency 2012). Time, as an impedance unit is only considered when accessing public transport or, in Páez, Scott, and Morency (2012), accessing daycare facilities.
218
Table 2: Analysis of distance-based measures
several opportunity types
Measur
e T
ypology
any distance (find closest)
Name of measur
e / method
Accessibility to food supermarkets Network accessibility Walking to bus stops
W alking to Transit stops W alking from Transit stops to final destination
Neighborhood Pedestrian Accessibility Land Use and Public T
ransport
Accessibility Index (LUPT
AI) Public T ransit and W alking Accessibility Index Retail Cluster Accessibility
Acessibility from retail unit or home to retail
Accessibility
Community resource accessibility Geographical accessibility of urban health services Acessibility to day care facilities Accessibility to multiple food retailer types
Article Apparicio 2007 Lundber g 2012 Achuthan 2010 Hull 2012 (InV iT o, SNAPT A), AMELIA Hull 2012 (IMaFa) Aultman-Hall 1997 Yigitcanlar 2007 Mavoa 2012 Hull 2012 (TRACE) Hull 2012 (HIMMEL) Shen 2002 Pearce 2006 Apparicio 2008 Páez 2012 Sadler 201 1 Accessibility measur ement Disaggr egation Transportation mode W alk W alk/Bike W alk W alk W alk W alk W alk W alk W alk W alk W alk/Bike W alk/Bike W alk/Bike W alk/Bike W alk Spatial unit Area Point Area Point Point Point Point Area Area Area Point Area Area Point Point Trip purpose Non-work W ork Both Non-work Both Non-work Both Both Non-work Non-work Both Non-work Non-work Non-work Non-work
Travel impedance Geographical scale (catchment area distance)
1 km 3 miles 400m closest closest 400 m 1200, 1600 m 10, 20, 40, 60, unlimited min closest closest closest closest 500, 1000 and 2000m 3,6 km Study Area
Travel distance calculation
Network Network Network Network Network Network Network Network Network Network Straight Line Network
Network, Straight line, Manhattan
Network Network Impedance unit Distance Distance Distance Time Time Distance Distance Time Distance Distance, Time Distance Distance, Time Distance Time Distance Places of r efer ence Origins Census block Home Census areas any point Transit stops Home Home Parcel Retail cluster Home, Retail Home Census mesh block Several census areas Home Home Destinations (opportunities) Supermarket University Bus stops Transit stops Shopping center Green spaces, Transit stops, Schools Commerce / Services
Education,
finantial, health, shopping and recreational
Transport
infrastructure
Retail
Public
Community Facilities Potentially health related facilities
Hospital
Day care facilities
Food stores Built Envir onment Slope X Route evaluation X
Other GIS measures
X
Note:
Articles are mentioned only referring to the first author
Distance to one closest opportunity of each opportunity type
Distance to several closest opportunities of each
opportunity type
only one opportunity type
several opportunity types
only one opportunity type
within FCA
any distance (find closest)
within Floating Catchment
Ar
ea (FCA)
any distance (find closest)
Floating Catchment
Ar
4.2 Gravity-based of potential accessibility measures
A important group of measures are Hansen-type (Hansen 1959), also designated as gravity-based or potential measures, which are widely used in transportation planning (Miller 2005). These are derived from the denominator in the gravity model and weight opportunities according to an impedance func-tion, given by the following expression:
Ai = ∑ Oj f (Cij ) (1)
where Ai is the accessibility of place i, Oj are relevant opportunities found at j, Cij is the cost of trav-eling between i and j, and f (Cij ) is an impedance function that measures the spatial separation between
i and j.
When applied to active travel, the cost or traveling from i to j (Cij) is only measured for walking and/ or cycling. These measures assume that travel is a derived demand and there is a tradeoff between the benefit of the opportunity and the cost to reach it from a given origin. Therefore, the closest opportuni-ties are more valued than opportuniopportuni-ties located farther away, and opportuniopportuni-ties can be distinguished depending on their size or importance. Cumulative opportunities measures are a particular case of this type, in which f (Cij ) is a rectangular function, which takes assuming the value 1 if included in a pre-defined threshold and the value 0 if not.
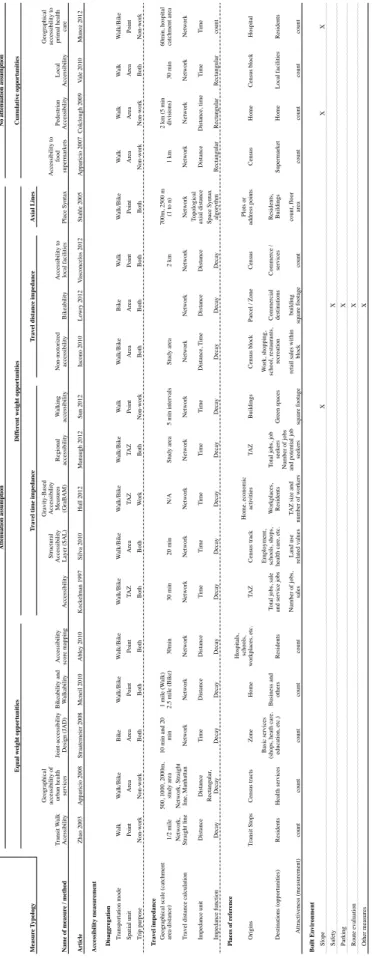
We identified two sub-categories of methodologies depending on the impedance function used in the study (Table 2). The first sub-category consists of methodologies that assume an attenuation of distance on opportunities. It can be further divided into four types based on methodological similari-ties. The first consists of methods that do not distinguish opportunities, where the result is the number of opportunities weighted by their distance to the origin (Zhao et al. 2003; Apparicio et al. 2008; Straatemeier and Bertolini 2008; Abley and Consultants 2010; McNeil 2011). In the case of Zhao et al. (2003) and Abley and Consultants (2010) the opportunity is “residents,” while the other methodologies consider different land-use types. The floating catchment area also varies, ranging from 500 meters to 4 kilometers (0.3 to 2.4 miles).
The second, third, and fourth types all give opportunities different weights (attractiveness). They are initially distinguished by the impedance unit. Most authors measure impedance by travel time (sec-ond type). In this case, accessibility reflects the attractiveness of opportunities weighted by the time needed to travel from the origin to the destination (Kockelman 1997; Silva and Pinho 2010; GraBAM in Hull, Silva, and Bertolini 2012; Manaugh and El-Geneidy 2012; Sun, Lin, and Li 2012). Neverthe-less, this type is far from homogeneous in terms of the travel time threshold, which ranges from 5 to 30 minutes. Moreover, measures of the attractiveness of the destination vary considerably, ranging from a scale of values given to specific land-use types, their square footage, or the number of jobs.
220
Table 3: Analysis of gravity-based or potential accessibility measures
Axial Lines Name of measur e / method Transit W alk Acessibility
Geographical accessibility of urban health services Joint-accessibility Design (JAD) Bikeability and W
alkability
Accessibility score mapping
Accessibility
Structural Accessibility Layer (SAL) Gravity-Based Accessibility Measures (GraBAM) Regional accessibility W alking accessibility Non-motorized accessibility Bikeability
Accessibility to local facilities
Place Syntax Accessibility to food supermarkets Pedestrian Accessibility Local Accessibility
Geographical accessibility to primal health
care Article Zhao 2003 Apparicio 2008 Straatemeier 2008 Mcneil 2010 Abley 2010 Kockelman 1997 Silva 2010 Hull 2012 Manaugh 2012 Sun 2012 Iacono 2010 Lowry 2012 Vasconcelos 2012 Stahle 2005 Apparicio 2007 Colclough 2009 Vale 2010 Munoz 2012 Accessibility measur ement Disaggr egation Transportation mode W alk W alk/Bike Bike W alk/Bike W alk/Bike W alk/Bike W alk/Bike W alk/Bike W alk/Bike W alk W alk/Bike Bike W alk W alk/Bike W alk W alk W alk W alk/Bike Spatial unit Point Area Area Point Point TA Z Area TA Z TA Z Point Area Area Point Point Area Area Area Point Trip purpose Non-work Non-work Both Both Both Both Both W ork Both Non-work Both Both Both Both Non-work Non-work Both Non-work
Travel impedance Geographical scale (catchment area distance)
1/2 mile 500, 1000, 2000m, study area 10 min and 20 min 1 mile (W alk) 2.5 mile (Bike) 30min 30 min 20 min N/A Study area 5 min intervals Study area 2 km 700m, 2500 m (1 to n) 1 km 2 km (5 min divisions) 30 min
60min, hospital catchment area
Travel distance calculation
Network, Straight line Network, Straight line, Manhattan
Network Network Network Network Network Network Network Network Network Network Network Network Network Network Network Network Impedance unit Distance Distance Time Distance Distance Time Time Time Time Time Distance, T ime Distance Distance
Topological axial distance
Distance Distance, time Time Time Impedance function Decay Rectangular , Decay Decay Decay Decay Decay Decay Decay Decay Decay Decay Decay Decay
Space Syntax algorythm
Rectangular Rectangular Rectangular count Places of r efer ence Origins Transit Stops Census tracts Zone Home Hospitals, schools, workplaces, etc. TA Z Census track Home, economic activities TA Z Buildings Census block Parcel / Zone Census Plots or address points Census Home Census block Hospital Destinations (opportunities) Residents Health services Basic services
(shops, heath care. education, etc.) Business and others
Residents
Total jobs, sale and service jobs Employment, schools, shops, health care, etc.
W
orkplaces, Residents Total jobs, job seekers
Green spaces W ork, shopping, school, restaurants, recreation Commercial destinations Commerce / services Residents, Buildings Supermarket Home Local facilities Residents Attractiveness (measurement) count count count count count Number of jobs, sales Land use related values
TAZ size and
number of workers
Number of jobs and potential job
seekers
square footage
retail sales within
block building square footage count count, floor area count count count count Built Envir onment Slope X X X Safety X Parking X Route evaluation X Other measures X Note:
Articles are mentioned only referring to the first author
Measur
e T
ypology
Attenuation assumption
No attenuation assumption
Equal weight opportunities
Differ
ent weight opportunities
Cumulative opportunities
Travel time impedance
The third type is methodologically identical to the second, but in this case, travel distance, rather than travel time is used as the impedance function (Iacono, Krizek, and El-Geneidy 2010; Lowry and Cal-lister 2012; Vasconcelos and Farias 2012). It should be noted that the Bikeability index (Lowry and Callister 2012) is the only methodology exclusively dedicated to bicycle travel. In this study, the attrac-tiveness measure is the square footage of the building at the destination. Finally, we identified a fourth type, which contains only one method—place syntax (Ståhle, Marcus, and Karlström 2005). This uses the topological axial distance, given by the space syntax algorithm, as the impedance function, and op-portunities are weighted in relation to the topological characteristics of the network. In this case, rather than the metric distance, the index reflects the “informational effort” needed to move through the urban network, emphasizing lines over points in measuring the proximity of a destination.
The second sub-category is comprised of methodologies that use a rectangular function (i.e., cu-mulative opportunities measures). In this case, all opportunities in the floating catchment area are given the same weight, and therefore accessibility is measured by the count of these opportunities. Apparicio, Titheridge, and Mackett (2007), Colclough (2009) and Vale (2010) take this approach, although they use a different catchment area and count different opportunities (supermarkets, homes, and local facili-ties, respectively). Finally, Munoz and Källestål (2012) takes a slightly different approach by first calcu-lating travel time from all homes to a central hospital (distance-based measure). Then, it considers the hospital as the origin and counts the number of residents (based on the number of homes) served by the hospital, up to a limit of 60 minutes (i.e., the hospital catchment area).
4.3 Topological or infrastructure-based accessibility measures
We found several methodologies that measured accessibility based on topology (i.e., the walking and cycling accessibility of the road network). These studies take no account of origins and destinations or opportunities in the neighborhood, and instead focus on an analysis of network connectivity and/or the characteristics of the walking and cycling infrastructure. Two major subgroups were identified: those that evaluate network connectivity and those that do not (see Table 4).
Within graph theory several indicators and measures have been developed that evaluate connec-tivity both at the network and the node level. These include the detour index, the gamma index, the Shimbel index (also designated nodal accessibility), among others (Rodrigue, Comtois, and Slack 2013). In urban planning, however, connectivity is normally evaluated with simpler indices such as the link/ node ratio and block size (Handy, Paterson, and Butler 2003).
222
Table 4: Analysis of topological or infrastructure-based measures
Deficiency index
LOS with FCA
Name of measur
e / method
Space Syntax Spatialist Lines (MoSC)
Pedestrian
Environmental Factors (PEF)
Network
Connectivity
Guidelines for Integrated Network Design
(RIN) Network Accessibility Pedestrian Deficiency Index (PDI) Bikeability W ABSA Walking W ABSA Biking Bicycle Level of Service (BLOS)
W
alkability and Bikeability
W alkability Bikeability Biwet Pedestrian accessibility Articles Alayo 2001 Hull 2012 Portland Pedestrian Master Plan 1998 Dill 2004 Gerike 2009 Lundber g 2012 Portland Pedestrian Master Plan 1998 Sisson et al 2006 Emery and Crump 2003 Emery and Crump 2003 Lowry et al 2012 Horacek et al 2012 Dannenber g 2005 Nikolaos 2009 Hoedll et al 2010 Zielstra 201 1 Accessibility measur ement Disaggr egation Transportation mode W alk/Bike W alk/Bike W alk W alk/Bike W alk/Bike W alk/Bike W alk Bike W alk Bike Bike W alk/Bike W alk Bike W alk/Bike W alk Spatial unit Segment Segment TA Z Segment Segment Point Segment Point Segment Segment Segment Segment Segment Segment Segment Point
Travel impedance Geographical scale (catchment area distance)
1 to n
1 to n
1/2 mile
1/4 mile from school
10 m intervals
400m (Bus), 800m (Metro)
Travel distance calculation
Segments Segments Network Straight Line Network Impedance unit Topological distance Topological distance Distance Distance Distance
Network connectivity Intersection density
X
X
Direction changes
X
Intersection / Cul-de-sac ratio
X
Links/Node ratio
X
Pedestrian route directness
X
X
X
Extent of grid street patterns
X
Distance between intersections
X Distance to intersections X Space Syntax Algorythm X X
Length of street segments
X X X Block Length X Infrastructur e
Sidewalks and/or bike paths Availability
X X X Continuity X X Length X Quality X X X X W idth X X X X X Maintenance X
Problematic intersections / crossings
X X X X X X X Number of lanes X X X X X Speed limit X X X X X X X
Outside lane width
X X X Pavement factors X X X X X Curve factors X X X X Built Envir onment Land-use evaluation X X X X Slope X X X Safety X X X X X Car parking X X Traf fic X X X X X X Aesthetics X X X Other measures X X X X X X X X Note:
Articles are mentioned only referring to the first author
Measur
e T
ypology
Network Connectivity Evaluation
No network connectivity evaluation
Space syntax
Topological-connectivity measur
es
Level of Service (LOS) with pr
edefined spatial unit
W
The first group (which evaluates network connectivity) concerns methods that include urban morphol-ogy parameters. This group relies on three main types of measures. The first is based on the space syntax methodology (Hillier 1996; Hillier and Hanson 1984) and is therefore closely linked to the evaluation of the relationships between segments and nodes and with the entire network (Alayo 2001; MoSC in Hull, Silva, and Bertolini 2012). The second type consists of four methodologies that emphasize connectivity. It includes two methods that combine connectivity with other characteristics of the infra-structure and the built environment such as slope, land-use evaluation or safety (City of Portland 1998; Gerike, Gerlach, and Rau 2009), while the other two (Dill 2004; Lundberg 2012) are simply connec-tivity measures. With the exception of RIN (Gerike, Gerlach, and Rau 2009), these methods combine several parameters in order to measure network connectivity (such as intersection density, intersection/ cul-de-sac ratio, and pedestrian route directness). The third type combines evaluations of connectivity and traffic and infrastructure, leading to the identification of a Pedestrian Deficiency Index (City of Portland 1998).
A second group of methodologies consists of topological measures that do not evaluate network connectivity, and therefore place greater emphasis on infrastructure evaluation. There are three types of measures in this group. The first contains only one method and is based on an evaluation of the level of service (LOS) within a floating catchment area (FCA) (Sisson et al. 2006). The second type is similar, but instead of a FCA, a pre-defined spatial unit is used to evaluate LOS, and the evaluation is based on the segment rather than the point (Emery and Crump 2003; Lowry and Callister 2012; Horacek et al. 2012). The third type is very different, as traffic is not considered as a relevant parameter (Dannenberg, Cramer, and Gibson 2005; Nikolaos, Athanasios, and Apostolos 2009; Hoedl, Titze, and Oja 2010; Zielstra and Hochmair 2011). Measures are based on infrastructure characteristics and the evaluation of network segments, and include parameters such as sidewalk or bike path availability, quality, and length among others.
4.4 Walkability and walk score-type measures
Accessibility measures classified as “walkability and walk score-type measures” include built environ-ment characteristics in their algorithms and always express accessibility as the relationship between a point and another point or a set of points (i.e., from a clear origin to a clear set of destinations). Unlike gravity- and distance-based accessibility measures, area characteristics around these points are also taken into account in the calculation. With reference to the Behavioral Model of the Environment, it can be argued that these measures consider both origins and destinations and the characteristics of the area around them, but not route characteristics. Variables such as sidewalk quality, dropped curbs, pave-ment surface material, cleanliness, trees, benches, etc. play no part in these measures, and therefore they should be used with care in the evaluation of pedestrian accessibility. Bradshaw (1993)’s neighborhood walkability measure includes a series of other measures of the built environment that are not included in any other study in this group, although it only measures built environment variables and not acces-sibility or connectivity.
The two major groups of measures in this category follow either the work of Frank and colleagues (Frank et al. 2010; Frank et al. 2006; Frank et al. 2005) and what they call the Walkability Index, or the Walk Score® approach. This is a registered methodology2 that has gained in popularity and has been used or tested since 2010. Our review identified 16 papers directly or indirectly related to the Walkability In-dex and six related to Walk Score (Table 5). The major difference between these approaches is that Walk Score uses a gravity-based methodology. Opportunities are weighted using a distance decay function, while the Walkability Index is based on a cumulative opportunities measure.
The Walkability Index has been used in several studies that examine the relationship between the 2 http://www.walkscore.com/
224
built environment and travel and physical activity. The term “Walkability Index” was coined by Frank et al. (2005) to express the qualities of the built environment that are associated with physical activity. The initial index consisted of three major dimensions: land-use mix, residential density, and street con-nectivity. These three elements, measured in a designated floating catchment area around a point (only Bradshaw 1993; Gebel et al. 2011 use a predefined spatial unit), are combined and given a z-score (ac-cording to the census tract or the neighborhood) leading to a walkability score for an area.
Prior to 2011, some authors (Van Dyck et al. 2010; Manaugh and El-Geneidy 2011) used Frank et al. (2005)’s original three-measure methodology. However, since Frank et al. (2006), the Walkability Index has included the retail floor area ratio (FAR), and network connectivity has been given twice the weight of other variables. This four-measure methodology was later used to evaluate physical activity and active transportation (Leslie, Butterworth, and Edwards 2006; Leslie et al. 2007; Frank et al. 2010) and has been used mostly ipsis verbis in more recent articles (Freeman et al. 2012; Lemon 2010). Only Glazier et al. (2012), for the three-measure index, and Gebel et al. (2011) for walkability with FAR have produced slightly altered methodologies, which have nonetheless stayed true to the walkability variable types and calculation principles.
Other authors have not replicated Frank’s methodology per se, but have included the three main measures, while adding other components. Of these, the Pedestrian Potential Value (PPV) devised by Kim (1994, cited in City of Portland 1998) is worthy of note, as is the only one which pre-dates Frank et al. (2005)’s index. Kim generated an aggregated PPV for each traffic analysis zone (TAZ) within the city of Portland, using five variables (adding slope and average parcel size to the three main measures). Other studies include Vargo, Stone, and Glanz (2012)’s Google Walkability, which introduces the number of reachable transit stops and streets with sidewalks, Krizek (2003)’s neighborhood accessibility, which includes a measure of block length and uses employees as a proxy of land use, and Mantri (2008)’s walk-ability of a neighborhood, which uses the Walk Score land-use groups. We only found one methodology that transposed the concept of walkability to bicycle trips. The Bikeability Index described by Winters et al. (2013) includes the three basic measures, but adds the length of bicycle routes, slope, and the separation from car traffic. Each variable is given a score of 1 to 10, which is then summed to produce the final score.
Walk Score-related articles have stayed true to the original methodology. Basically, the Walk Score index assesses the “walking potential” of a place through a combination of three elements: the shortest distance to a group of preselected destinations (such as commerce/services, green spaces, and schools), the block length, and the intersection density around the origin. It therefore links two types of accessi-bility: a gravity-based measure (distance accessibility), with topological accessibility (street connectivity) measured by two complementary indicators that act as penalties in the final score (linearly expanded in the range 0 to 100). We identified two types of articles. Prior to 2010, the Walk Score algorithm used a one mile Euclidean distance buffer (Brewster et al. 2009; Carr, Dunsiger, and Marcus 2010). Currently the buffer is determined by the network (Duncan et al. 2011; Manaugh and El-Geneidy 2011, 2012; Hirsch et al. 2013). All of these more recent articles cite the Walk Score website as the source for their calculations. In addition, Carr, Dunsiger, and Marcus (2010) and Duncan et al. (2011) correlate their Walk Score results with other built environment measures.
Based on Winters et al. (2013)’s Bikeability score, the Walk Score website now offers a Bike Score,® which measures whether a location is good for cycling on a scale of 0–100 based on four equally weight-ed components: bike lanes, hills, destinations and road connectivity, and bike commuting mode share. As far as we could ascertain, to date there are no peer-reviewed papers that have applied the Bike Score.
Table 5: Analysis of walkability and walk score-type measures
Measur
e typology
Straight line walk scor
e
Network distance walk scor
e Name of measur e / method W alkability index W alkability index W alkability index W alkability index Pedestrian Potential V alue (PPV) Neighborhood Accessibility W alkability of a neighbourhood Google walkability Bikeability W alk score W alk score Articles
Frank 2005, Van Dyck 2010, Manaugh 201
1
Glazier 201
1
Frank 2006, Leslie 2006, Leslie 2007, Frank 2010, Lemon 2010, Freeman 2012
Gebel 2012 Kim 1994 Krizek 2003 Mantri 2008 Var go 2012 W inters 2013 Brewster 2009, Carr 2010 Duncan 201 1, Manaugh 201 1, Manaugh 2012, Hirsch 2013 Accessibility measur ement Disaggr egation Transportation Mode W alk W alk W alk W alk W alk W alk W alk/Bike W alk Bike W alk Wa lk Spatial unit Point Point Point Census collector district Point Grid Point Point Point Point Point Trip purpose Non-work Non-work Non-work Non-work W ork Both Non-work Non-work Both Non-work Non-work
Travel impedance Geographical scale (catchment area distance)
1km 720m 1km Census collector districts 0,5 mile 1/4 mile 1,5 mile 0,5 mile 400 m 1 mile 1 mile
Travel distance calculation
Network Straight line Network Network Grid Network Straight line Straight line Straight line Network Impedance unit Distance Distance Distance Distance Distance Distance Distance Distance Distance Distance Distance Impedance function Rectangular Rectangular Rectangular Rectangular Rectangular Rectangular Rectangular Rectangular Rectangular Decay Decay Places of r efer ence Origins Home Home Home Census collector districts Home 150m Grid Home Home 10m Grid Home Home Destinations (opportunities) Commerce / services Commerce / services Commerce / services Commerce / services Employment Commerce / services Commerce / services, green spaces, schools Commerce / services
Commerce /
services, schools
Commerce / services, green spaces, schools Commerce / services, green spaces, schools
Attractiveness (measurement) Count Count Count Count Count Count Count Count Count Count Count Built Envir onment
Topological and infrastructur
e Street connectivity Intersection density Intersection count Intersection density Intersection density Intersection count Intersection density Link/Node ratio (Gamma Index) Intersection count Intersection density Intersection density Intersection density Block Length X X X
Parcel average size
X
Sidewalks
% of street lenght with 1 or more separation from car traf
fic
Lenght of bycicle routes
X Density Residential Residential, Population Residential Residential Residential, Employment Residential, Population Residential Population, Employment Population
Land Use Land use mix
Entropy index
Count
Entropy index
Entropy index
Employment/ Household Ratio Number of Employees Entropy index, count closest
Count Density Retail Floor Area Ratio (F AR) X X Other measur es Slope X X Safety X
Car parking Transit stops
X
Note:
Articles are mentioned only referring to the first author
W alkability W alk Scor e W alkability index W
alkability index with F
AR
Other
walkability-type measur
226
4.5 Other active accessibility measures
Our review uncovered around 10 methodologies for calculating accessibility that could not be included in any of our four main categories as they proved to be special cases, combinations of the other four categories, or are other methodologies with titles that contain similar terms. Only one of these meth-odologies is shown in Figure 2: the Pedestrian Potential Index (PPI) that was developed for Portland’s Masterplan (City of Portland 1998). The PPI is mostly a topological measure. Like the previously men-tioned Pedestrian Deficiency Index, the evaluation (a summed index) is based on the characteristics of street segments (their type, classification, location within the region and environmental score). However, the PPI includes another important element; segments are given more points if they are within a float-ing catchment area (for different radii) of schools, public parks, transit stops and pedestrian-friendly commercial spaces. In other words, it is a topological measure that includes origins and destinations, in which the spatial unit is the segment.
Two other methodologies were identified, which measured the area covered by the opportunities in the floating catchment area of a given point; the first area is divided by the second to produce a ratio. In their eco-friendly walk score calculation (Lwin and Murayama 2011), opportunities are green spaces in-side the floating catchment area, while in the School Specific Walkability Index (Giles-Corti et al. 2011) opportunities are pedestrian areas. In this case, the ratio is converted from a scale of 1 to 10, and another score is given according to a ratio that measures the proportion of main roads, to produce a final score that ranges from 2 to 20. The use of the terms walk score and walkability index is particularly revealing, as these methodologies have little in common with their original namesakes described in the previous section. Indeed, these examples show that there is still some confusion in cataloguing and unequivocally defining active accessibility measures.
Sakkas et al. (2006) calculated the accessibility of buildings as the distance between a point outside the building (for example, the parking lot) to a given point inside it. In theory this is a distance-based measure, but the study weighted it both by a decay parameter that included slope (gravity-based) and the quality of the path (topology-based). This spatially focused accessibility measure only applies to relatively short distances, and in this case, the destination is not the building as a whole (generally repre-sented by the centroid) but a precise location inside it. Therefore, this measure is not universal. Church and Marston (2003) include this specificity in its methodology, which can be applied to any accessibility calculation. In the study method, the relative accessibility of a given location to a person with a physical disability (whether inside a building or not) is given by the ratio of accessibility calculated for that person and accessibility calculated for a person without a physical disability. Allan (2001) calculated a cost ratio (time or distance) measured using the network and the same cost measured as the crow flies. Although this is a measure of network connectivity, it cannot be included in topological measures, as it does not exclude the origin–destination pair.
Place-rank, which is a recent methodology developed by El-Geneidy and Levinson (2006, 2011), is a gravity-based measure that redistributes people (workers) between zones (e.g., traffic access zones) based on a weighted assessment of the zone’s attraction (measured by the ratio of job opportunities and the number of workers residing in the zone) and the power of the links. The accessibility of a zone is determined by the number of people commuting into it, but each person contributes to the accessibil-ity measure depending on the attractiveness of his or her zone of origin. The measure requires several iterations to stabilize; a calculation of the weighted sum of jobs by destination is used to rank zones. The measure requires knowledge of actual choices of origins and destinations, and therefore reflects revealed behavior, which might be different to preferred behavior (Handy and Niemeier 1997).
Finally, activity-based measures (Dong et al. 2006), perceived activity set (Le Vine et al. 2013) and space-time methodologies (Miller 1999; Miller and Wu 2000; Kim and Kwan 2003) were also briefly
reviewed, although they are considered utility-based measures as they measure on-foot accessibility as an integral part of a person’s daily routine. Nevertheless, we acknowledge that space-time methodologies have a great potential to measure active accessibility of an individual, which can be significantly differ-ent from place accessibility (Miller 2007). Activity-based measures (based on utility theory) compute an individual’s expected maximum utility over the choices of all available activity patterns, and display isochrones-based maps that represent the areas that can be reached based on maximum individual util-ity. Methodologies that include space-time measures use similar approaches, but take into account not only the travel time needed to reach a given weighted opportunity (a measure of attraction—gravity) but also how long an individual can enjoy those facilities given their space-time constraints, i.e., a time budget based on individual schedules (Kwan and Weber 2003). Kim and Kwan (2003) considered opening hours of opportunities and the time taken to enjoy the experience. For example, while people may only need five minutes to have a cup of coffee at the nearest coffee shop, they may need an hour to visit the doctor. Finally, the perceived activity set (Le Vine et al. 2013) is a predictive model of mobility resources. It is a set of out-of-home activities that encompasses an individual’s potential travel needs. The formula weights the (dis)utility of acquiring or maintaining the mobility resources they might possess and the (dis)utility of using the travel modes that enable them to access the activities in their perceived activity set.
5
Discussion and conclusion
In the vast majority of the Western world, finding ways to increase active travel is becoming a key ob-jective of policies and plans. The health, environmental and even financial and psychological benefits derived from the active pursuit of walking and cycling have been continuously demonstrated, not only by theoretical scientific research, but also by practical empirical evidence. Walking and cycling are no longer merely weekend leisure activities, rather they are, or aim to be, part of day-to-day living. For this to happen, it is essential that the built environment provides suitable conditions so that they can become usual and routine. The likelihood of walking and cycling has been associated with the proximity of the destination to the home. As an example, the absence of supermarkets near residential areas and/or workplaces is expected to significantly reduce the likelihood of walking or cycling to shop for groceries. These, and other related subjects have become an increasing focus of scientific discussion since the turn of the millennium.
However, current ways to measure active travel accessibility are very diverse, and there is little agree-ment on theoretical and methodological concepts and assumptions. In this review, we have explicitly analyzed operational measures of walking and cycling accessibility, which can be replicated in different urban and national contexts. We found around 80 scientific papers, reports, or theses published in the last 15 years, which for the most part (with different purposes) measured a single variable: the ability of a person to reach a place by walking or cycling. In line with the concept of active travel, we suggest that the concept of active accessibility can express this particular type of accessibility.
The first and major outcome of our review confirmed our suspicions: Ways to measure active ac-cessibility are as varied as the number of scholars that measure them. Moreover, the same concepts have different meanings and are used to describe different methodologies. The term walkability, for instance, is used as a combined land-use/accessibility index (Frank et al. 2006; Frank et al. 2005) but also as a topological index (Dannenberg, Cramer, and Gibson 2005; Horacek et al. 2012), and a walkable area ratio (Giles-Corti et al. 2011). Forsyth and Southworth (2008) expressed concern about this confusion, and it remains a major flaw in active accessibility research.
From a theoretical perspective, however, ways to measure accessibility can be grouped into catego-ries that have been defined for decades. Regardless of the variables or the coefficients used, or the names
228
given to them, methodologies still calculate accessibility on the basis of infrastructure-, gravitational- or distance-based algorithms. Our research identified a fourth group: walkability and walk score-type measures, which introduce built environment variables into a gravitational-based model. The lack of systematization is not, therefore, theoretical, but practical or methodological.
It is interesting to examine the reasons for the numerous dissimilarities between similar method-ologies. A second question relates to the added value of an extra variable included in a previously tested method, which is often unclear. For example, when Frank et al. (Frank et al. 2010; Frank et al. 2006) introduced the retail floor area ratio into their earlier three-variable walkability index methodology, they were really adding another land-use variable. This new walkability index may be a better predictor of accessibility, but it may also lead to collinearity problems as the new algorithm possesses two land-use measures. Likewise, Walk Score considers both intersection density and average block length, which are two measures of street connectivity, but it ignores infrastructure features of the network such as pavement quality. Furthermore, not only do different methodologies in similar categories calculate the same variable in a different way, but this also can occur within the same methodology. For example, 11 ways were found to measure street connectivity, and the combination of variables used to measure the quality of a bicycle path seems to be endless. Therefore, the most important issue seems to be not what to measure, but how to measure. In this context, the walkability index is a paradigmatic example, as all the methodologies we reviewed included a measure of land-use mix, density, and connectivity in their algorithms, yet few calculated these three measures in exactly in the same way.
Many of these problems can be explained and justified in terms of data limitations. In all scientific research, but particularly spatial analysis, data collection is a major concern (Talen 2003), and it is often the case that the necessary data is not available. In the case of accessibility there seems to be a dichotomy between what can be obtained in the field and what can be obtained through municipal or open-source databases. In the initial stages this can limit the choice of model, for example, the non-inclusion of the time of day, detailed land-use data, or other subjective variables. This latter point is of particular interest, as utility- or survey-based measures are harder to find in the literature, partly because they require prior data collection and allocation of resources. In addition, data is collected from different sources, which makes it harder to replicate and subsequently compare models. Therefore, measures that simplify data collection and rely on pre-established networks (e.g. Open Street Map) diminish the computational effort and offer accessible and comparable planning tools. Consequently, they become more popular, despite their notable deficiencies. Walk Score for example, does not include workplaces and excludes time of day. From a time-geography perspective, it focuses almost exclusively on flexible activities and neglects fixed activities such as work, childcare, and so on. Therefore, it reflects the accessibility of activi-ties where the individual is free to choose when and where to perform them, and not the accessibility of activities that require the individual to be present in a certain place at a certain moment in time. Another major data limitation we found is topography. In assessing the accessibility of bicycling, slope measure-ments should always be included, as it is known that cyclists choose routes that minimize elevation gain. Furthermore, although we would argue that slope is also important for walking, it was largely absent from the walking accessibility measures we reviewed. We believe that data limitations may justify this absence. Finally, the extensive use of road centerlines to represent the pedestrian network may increase measurement errors, by overstating real pedestrian accessibility measured by lines representing sidewalks and pedestrian crossings (Van Eggermond and Erath 2014).
Another important conceptual and methodological issue when measuring active accessibility is the scale of analysis. Our results show great disparity in values of travel impedance (distance or time). Therefore, scale effects (i.e., spatial resolution and spatial extent) are likely to be a major issue, as these two parameters are pre-determined in most methodologies and not normally subject to a sensitivity