UNIVERSIDADE DA BEIRA INTERIOR
Ciências Sociais e HumanasSegmentation of Winter Sports Consumers Using
Attributes of Destination Choice, to Support a
Competitive Analysis of Ski Resorts - A Case Study
Marco Alexandre Batista Martins
Dissertação para obtenção do Grau de Mestre em
Ciências do Desporto
(2º ciclo de estudos)
Orientador: Prof. Doutora Dina Alexandra Marques Miragaia
Manuscrito Submetido / Manuscript Submitted:
Miragaia, D., & Martins, M. (2011). Segmentation of Ski and Snowboard Consumers Using Attributes of Destination Choice to Support a Competitive Analysis of Alpine Resorts - A Case Study. Journal of Sport Management.
Identificação do Manuscrito / Manuscript Identification:
JSM_2011_0125
Data da Submissão / Date Submitted:
Agradecimentos
Na conclusão deste trabalho realizado na Universidade da Beira Interior não posso deixar de agradecer a todas as pessoas que directa ou indirectamente contribuíram na elaboração da tese.
Em primeiro lugar, agradecer à Professora Doutora Dina Miragaia por todo o empenho, dedicação e motivação que sempre dedicou na orientação desta investigação, que em muito ajudaram a levar o barco a bom porto.
À minha namorada Telma, que desde o primeiro dia se preocupou em dar-me apoio e motivar-me, não deixando que o cansaço, nem as dificuldades me afectassem e sobretudo fazer-me acreditar que eu iria conseguir concretizar este objectivo.
Aos meus pais, assim como à minha irmã, por toda a força e compreensão que sempre me deram ao longo deste caminho.
Resumo
O objectivo deste estudo foi o de identificar os atributos que diferentes segmentos de turistas privilegiam na escolha de um destino turístico de desportos de inverno e analisar o grau de satisfação destes sobre os serviços prestados pela única estância de ski existente em Portugal. Foi aplicado um questionário a 200 turistas e feita uma análise factorial de onde se extraíram factores que serviram de base a uma análise de clusters. Foram identificados cinco factores acerca dos atributos mais valorizados na escolha do destino e distinguidos seis clusters de consumidores. No que se refere à análise da satisfação sobre os serviços da estância, foram identificados cinco factores e descriminadas as preferências de diferentes segmentos de consumidores através da identificação de cinco clusters. O estudo sugere que a segmentação dos consumidores com base nas características dos atributos do destino em conjunto com uma avaliação da sua satisfação sobre os serviços disponibilizados, pode fornecer informação relevante para avaliar a competitividade das organizações.
Palavras-Chave: turismo desportivo, segmentação dos consumidores, satisfação dos
Abstract
The aim of this study was to identify the attributes that different tourist segments prioritize in choosing a destination for winter sports and analyze their degree of satisfaction with the services provided by the only ski resort in Portugal. A questionnaire was applied to 200 tourists with factor analysis from which factors were extracted to serve as a basis for a cluster analysis. Five factors about the most valued attributes in choosing a destination were identified, and six consumer clusters were distinguished. Concerning the analysis of satisfaction with the resort’s services, five factors were identified and the preferences of different consumer segments were discriminated from identification of five clusters. The study suggests that consumer segmentation based on the characteristics of the destination’s attributes together with assessment of their satisfaction with the services available can supply relevant information to evaluate organizations’ competitiveness.
Keywords: sports tourism, segmentation, consumer satisfaction, competitiveness,
Table of Contents
Introduction ... 1
Literature Review ... 4
Sport Tourism ... 4
Consumer Segmentation ... 5
Segmentation: Consumer Characteristics, Needs or Motivations ... 5
Segmentation: Attributes for Choosing a Ski Resort ... 6
Consumer Satisfaction ... 7
Competitiveness of a Tourist Destination ... 8
Method ... 10
Research Context ... 10
Sample ... 10
Data Collection ... 11
Discussion of the Results ... 13
Study I ... 13 Study II ... 22 Conclusions ... 31 References ... 34
Attachments
Attachment 1 – Questionnaire ... 1List of Tables
Table 1 – Sample Profile ... 11 Table 2 – Factor Analysis of Attributes for Choosing a Winter Sports Destination ... 14 Table 3 – Tourist Segmentation Based on Destination Attributes ... 16 Table 4 – Differences between Clusters Relating to Attributes for Choosing a Winter
Sports Destination ... 19 Table 5 – Factor Analysis of the Degree of Satisfaction with Resort Attributes ... 22 Table 6 – Tourist Segmentation regarding Satisfaction with Resort Services ... 24 Table 7 – Differences between Clusters in Relation to Satisfaction with Resort
Introduction
The growth of the tourist industry over the last 50 years has aroused great interest in the scientific community, this being shown by the diversity of investigations on the subject. More leisure time, increased disposable income, the improvement and greater variety of means of transport, and the greater ease in obtaining information about destinations, increased the demand for tourist activity, soon leading to interest in studying consumer behavior (Calantone, Di Benedetto, Hakam, & Bojanic, 1989; De Knop & Standeven, 1999; Downward, 2005; Eisenhardt & Martin, 2003; Pearce, 1982; Weed, 2001, 2005).
Various approaches have been used to understand the reasons leading the consumer to choose a certain tourist destination. Some try to do so setting out from the attributes that characterize that very destination (De Knop & Standeven, 1999; Dickson & Faulks, 2007; Godfrey, 1999; Klenosky, Gengler, & Mulvey, 1993; Konu, Laukkanen, & Komppula, 2010; Woodside & Lysonski, 1989), others, in turn, do so from the motivations, needs and characteristics of consumers (Hudson & Shephard, 1998; Matzler, Füller, Renzl, Herting, & Späth, 2008; Matzler & Siller, 1993).
In addition, these approaches have been complemented by studies that attempt to segment consumers, trying to combine information that will help organizational decision-makers to define strategies, in order to give added value to their tourist developments, in this way intervening in the destination’s competitiveness (Barney, 1991; Eisenhardt & Martin, 2003; Grant, 1991; Hassan, 2000; Middleton & Clarke, 2001; Tkaczynski, Rundle-Thiele, & Beaumont, 2009).
Regarding the association between sport and tourism, it is important to highlight that this has been strengthened over time, providing a good example of cooperation between two industries (De Knop & Standeven, 1999; Gammon & Robinson, 2003; Gibson, 2003; Weed & Bull, 2004, 2009). Therefore, also in this sphere it is
increasingly important to understand the profile of the consumer who seeks this type of tourism.
Specific studies about destinations dedicated to winter sports (Calantone, et al., 1989; Koenig & Abegg, 1997; Pearce, 1982; Thapa & Graefe, 2003; Tuppen, 2000; Vaske, Carothers, Donnelly, & Baird, 2000; Woodside & Lysonski, 1989) have shown that the destination’s attributes are determinant in consumer choice (Buckley, 2007; Dickson & Faulks, 2007; Frochot & Morrison, 2001; Godfrey, 1999; Hudson & Shephard, 1998; Klenosky, et al., 1993; Konu, et al., 2010). However, besides identifying the destination’s attributes, valued by different consumer segments, it is also important to identify their degree of satisfaction after having used the facilities on offer in the chosen destination.
Although some studies about winter sports resorts have been devoted to identifying the degree of consumer satisfaction (Matzler & Siller, 1993; Middleton & Clarke, 2001; Tkaczynski, et al., 2009), studies combining these two focuses of information were not found in the literature. Uniting these two aspects will allow organizational decision-makers to define more specific strategic guidelines, so as to discriminate the competitiveness of their tourist developments by having as a point of reference the attributes consumers generally value when seeking this type of destination and the assessment they make of the services used.
From the above, it was considered relevant to develop this investigation based on the only winter sports resort in Portugal, since this is a unique and differentiating attribute for tourism in this region of the country. The goal of this study is therefore to identify the attributes that different tourist segments prioritize in choosing a winter sports resort (Study I) and analyze their degree of satisfaction with the services provided by the only ski resort in Portugal (Study II).
This study is structured as follows: it begins with a literature review that deals with the concepts of ”sports tourism” and “tourism sports”, indicates results of other
studies about consumer segmentation and attributes in choosing a destination, and finally shows the importance these data may have in analyzing the competitiveness of a destination. The experimental part follows, where the organization forming the case study in this investigation will be characterized, and the methodology used will be described. Subsequently, the results will be presented and discussed. It ends with conclusions, limitations and future recommendations.
Literature Review
Sports Tourism
Over the years, the tourism and sports sectors have come to have common activities, contexts and practices, showing an overlapping area currently defined as sports tourism (De Knop & Standeven, 1999). Sports tourism as we know it today had its origins in the middle of the twentieth century, associated with the emergence of winter sports in the Alps (Pigeasson, Bui-Xuan, & Gleyse, 2003). At present, sports tourism undeniably represents a major social, economic and cultural phenomenon, arising from a unique interaction between activities, people and places (Gibson, 2003; Hritz & Ross, 2010; Solberg & Preuss, 2007; Weed & Bull, 2004).
Gammon & Robinson (2003), distinguish the concepts of “sports tourism” and “tourism sport”. Tourism sport, corresponds to tourists who travel outside their usual environment and end up participating actively or passively in sporting activities, with sport not being the main reason for the trip. In fact, two levels of tourism sport are differentiated: (a) one, where the sporting element is used as a secondary enhancement to the holiday; and the other in which (b) participation in a sporting activity occurs accidentally.
As for the concept of sports tourism, this refers to individuals or groups who travel outside their usual environment to participate actively or passively in a sporting competition, with sport being the main motive for the trip (De Knop & Standeven, 1999; Gammon & Robinson, 2003). For Hall (1992), sports tourism corresponds to people who travel for non-professional reasons to watch or participate in sporting activities. Weed & Bull (1997) consider that sports tourism involves tourists who are accommodated in a certain place as spectators or even as participants.
Gammon & Robinson (2003) distinguish two levels of sports tourism: (a) concerning active or passive participation in a sporting competition; and that which (b)
refers to the tourist who travels specifically to places that are different from his natural environment and participates actively in a recreational or leisure activity. In the same line of thought, Gibson (1998) suggests three distinct types of behaviour associated with sports tourism: (a) the tourist’s active participation in sport; (b) the tourist as a spectator who goes to attend a sporting event; and finally (c) the tourist who visits a place and ends up participating in sporting activities.
Consumer Segmentation
The increase in tourist travel and the diversity of tourist products and consumers has stimulated the use of consumer segmentation as a strategic tool to respond to the increasingly competitive market (Frochot & Morrison, 2001). Consumer segmentation brings great advantages to organizations operating in the tourism sector in that they can differentiate themselves from other competitors in the market, namely through creating pricing policies, developing services and advertising campaigns directed towards the particular segments they wish to target. In this way, tourist developments can be
organized in a specialized way, providing conditions that can deal in a more personalized way with the needs and expectations of each type of visitor (Formica & Uysal, 2001) .
According to Frochot & Morrison (2001), various approaches can be used to carry out consumer segmentation, highlighting: the consumer’s characteristics, his need or motivations and finally the destination’s characteristics.
Segmentation: Consumer Characteristics, Needs or Motivations
According toMazanec (1993), it is fundamental to segment the tourist consumer
based on the following characteristics: (a) their origin (countries, regions); (b) their economic characteristics (income, length of stay, type of accommodation, amount spent, preferred places to visit, how they plan the trip); (c) social characteristics (age group, if
they travel as a family, alone or in groups of friends); (d) the means of transport used (air, rail, road); and also (e) the reasons for the trip (business, sport, religion, leisure).
Tkaczynski et al. (2009), suggest four aspects that can be used to segment consumers: (a) demographic (age, sex, salary and qualifications); (b) geographical (distance from place of residence); (c) psychographic (purpose of the trip, motivations and life-style); and finally (d) behavioural (existing activities, expenses inherent in the trip). In the same connection, Middleton & Clarke (2001), state that segmentation criteria can include: the purpose of the journey; needs; price; demographic; economic, geographical or psychographic characteristics of consumers .
Cha, McCleary, & Uysal (1995), suggest the following factors based on consumers’ needs when seeking a destination: the search for relaxation; the search for knowledge; love of adventure; travelling with the family and playing sports. Bieger & Laesser (2002), mention as attributes that motivate the tourist to undertake a trip: comfort; nightlife; family facilities at the destination; culture and sport.
Referring specifically to the Nordic winter market, Ahmed (1997), defined five motives for segmentation: comfort and safety; culture; entertainment; the cost of the destination; and finally, facilities for relaxation.
Segmentation: Attributes for Choosing a Ski Resort
Perdue (2004) highlights the need to distinguish two types of winter sports tourists: (a) those for whom the winter destination is close to their usual environment, as is the case of local skiers; and (b) those who choose skiing as a holiday activity, and in this case need to move further from their usual place of residence. Gilbert & Hudson (2000), highlight that in the sphere of sports tourism, destinations dedicated to winter sports are the ones that retain tourists for a greater number of days.
Klenosky, Gengler, & Mulvey (1993), aiming to determine the factors that influence the choice of a ski resort, identify nine factors: the variety of slopes; snow
conditions; safety; atmosphere; the social atmosphere of the destination; the time the skier has to carry out the activity; the economic aspect; the welcoming nature of the place and employee competence.
Konu et al. (2010) identified four factors determining the attributes of the most appreciated ski resorts in Finland, these being: the characteristics of the slopes; cross-country skiing; restaurants and social life; and services at the resort.
Aiming to study Australian skiers and snowboarders’ reasons for seeking out winter sports resorts, Dickson & Faulks (2007) identified two factors: snow conditions and services at the resort.
Godfrey (1999), in a study to identify the factors affecting a group of British skiers’ choice of resorts in Canada, mentioned six: snow conditions; the variety of slopes; the facilities at the resort; access to the slopes; accommodation; and also the atmosphere at the resort.
Finally, Frochot & Kreziak (2008), identifying the attributes appreciated in choosing a winter sports destination, determined five factors: the authentic nature of the mountain; the services at the resorts; other activities apart from skiing; skiing activities; and the challenge.
Consumer Satisfaction
Tourists’ needs are related to the expectations they have before travelling, and meeting them will have direct implications on the consumer’s degree of satisfaction (Oliver, 1980; Parasuraman, Zeithaml, & Berry, 1985). Therefore, to understand the consumer’s decision-making process and his satisfaction, it is crucial to know his motives when considering a destination (Matzler & Siller, 1993). The same author, in another study (Matzler, et al., 2008), identified six factors that characterized consumer satisfaction in relation to the services at an Alpine ski resort: the quality of the slopes;
restaurants and bars; the variety of slopes; sports facilities; ski-lifts; and finally, resort employees.
In turn, Hudson & Shephard (1998), evaluating the services of an Alpine ski resort, identified twelve factors: information services; accommodation; restaurants and bars at the resort; ski-shops, medical services; shops and supermarkets; other resort services; the variety of slopes; services on the slopes; the characteristics of other skiers; mountain restaurants (outside the resort) and finally the operator’s services.
Competitiveness of a Tourist Destination
The success of tourist destinations in world markets is influenced by their competitiveness, as various authors have demonstrated (Crouch & Ritchie, 1999; Hudson, Ritchie, & Timur, 2004; Pearce, 1997). These destinations include natural resources (such as beaches, mountains and the countryside); cultural aspects (such as museums, traditions and festivals); and qualified human resources, which together are important in keeping a destination competitive (Mbaiwa, 2003).
For a tourist destination to attract and satisfy travellers, it is necessary to combine their motivations with existing resources. Therefore, identification of the attributes that tourists value most can be used as a tool to develop strategies to increase the competitiveness of that tourist destination. According to Eisenhardt (2003) and Rumelt (1997) an organization’s competitive position depends on an exclusive set of resources it offers, as well as the relationship among them. Various studies have been carried out based on an approach centred on resources, concluding that the state of assets (existing resources) and their characteristics can be a source of sustainable competitive advantage for the destination (Amit & Schoemaker, 1993; Barney, 1991; Conner & Prahalad, 1996; Dierickx & Cool, 1989; Peteraf, 2003; Reed & DeFillippi, 1990).
Barney (1991) and Grant (1991) state that a resource should be valuable in that it can allow exploration of new opportunities and also in its ability to help to neutralize
threats. In addition, when assets are scarce, they can lead the organization to competitive disadvantage, and so an organization can increase its competitiveness through specialization, innovation, investment, risk-taking and improving its productivity (Ritchie & Crouch, 2000).
A destination’s competitiveness has been defined as the capacity to hold on to its position in the market and/or improve it over time (d'Hauteserre, 2000), and so an organization should seek to create and integrate products with added value that sustain its resources, so as to maintain its position in relation to its competitors (Hassan, 2000).
According to the literature review, it was possible to identify a gap in studies about winter sports, in the fact that they do not simultaneously combine indicators about the attributes valued in seeking that type of destination (in general) with assessment of the degree of consumer satisfaction with the services available at the destination (in particular). This information will allow more efficient identification of the competitiveness of particular tourist developments, by providing organizational decision-makers with information about what certain consumer segments most value in choosing a destination and how they assess their experience at that destination. Therefore, the aim of this study is to identify the attributes that different tourist segments prioritize in choosing a tourist destination for winter sports (Study I) and analyze their degree of satisfaction with the services provided by the ski resort of Serra da Estrela/Portugal (Study II).
Method
Research Context
This investigation concerns a case study of the ski resort of Serra da Estrela in Portugal. The resort began operations in the 70s, as the only resort in Portugal where snow sports are possible. It is situated on the mountain of Serra da Estrela, the highest point of mainland Portugal (at an altitude of approximately 2.000 m). The urban area closest to the resort is the town of Covilhã (20 Km) with around 54 thousand inhabitants and the closest accommodation is situated on the mountain-side about 10 minutes from the slopes. It has 9 slopes (2 green, 2 blue, 4 red and 1 black), with a total of 7.7 km, between a minimum altitude of 1.854 m and a maximum of 1.984 m. The resort has 5 mechanical lifts. The closest competitor ski-resorts are the Sierra de Bejar (Salamanca), approximately 200 km away from the Serra da Estrela, with 26 km of skiable slopes, 4 mechanical lifts and with a maximum altitude of 2,369 m. This resort is the one with characteristics most similar to the Serra da Estrela. A little further away, but with very different characteristics is the Sierra Nevada (Andalusia), with 86 slopes over 85 skiable kilometers and 18 mechanical lifts; and Andorra with around 300 km over 174 slopes and having 43 mechanical lifts, situated about 850 km from the Serra da Estrela. Finally, and somewhat further away (1800 km) are the Swiss Alps with over 200 skiable kilometers and around 50 mechanical lifts.
Sample
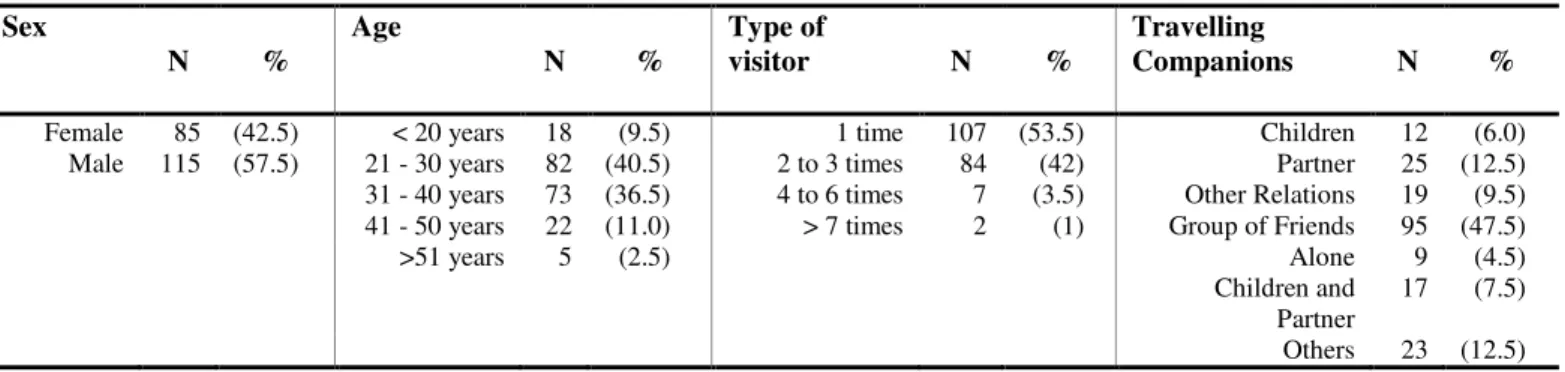
The sample was made up of 200 tourists, of whom 57.5 % were male and 42.5 % female, with 40.5 % being in the 21 to 30 age group and 36.5 % in the 31 to 40 age group. As for the type of visitors, 53.5 % generally visit the resort once a year, 42 % come 2 to 3 times, while only 4.5 % of respondents come to the resort more than 4 times a year. Regarding who accompanies respondents to the tourist destination, it is of
note that 47.5 % said they came with a group of friends and 12.5 % indicated they came with their partner (Table 1). It should also be noted that 43,5 % of the sample live within a 100 km radius, and prefer to drive to the destination (95 %), 57 % have higher educational qualifications and 49 % have a monthly income over 1000 €.
Table 1 – Sample Profile
Sex
N % Age N % Type of visitor N % Travelling Companions N %
Female 85 (42.5) < 20 years 18 (9.5) 1 time 107 (53.5) Children 12 (6.0) Male 115 (57.5) 21 - 30 years 82 (40.5) 2 to 3 times 84 (42) Partner 25 (12.5) 31 - 40 years 73 (36.5) 4 to 6 times 7 (3.5) Other Relations 19 (9.5) 41 - 50 years 22 (11.0) > 7 times 2 (1) Group of Friends 95 (47.5) >51 years 5 (2.5) Alone 9 (4.5)
Children and
Partner 17 (7.5) Others 23 (12.5)
Data Collection
The instrument used to collect data was a questionnaire (Attachment 1), adapted from Konu et al. (2010) e Hudson & Shephard (1998) , made up of two sections that incorporated the two studies. The first section contained the elements for Study I (identifying the attributes various tourist segments prioritize in choosing a winter sports destination), and was formed of 28 questions assessed on a 4-point Likert-type scale (1 = of no importance; 2 = of little importance; 3 = important; 4 = very important). The second section contained the elements for Study II (analyzing the degree of satisfaction with the services provided by the ski resort), made up of 42 questions assessed on a 5-point Likert-type scale (1 = dissatisfied; 2 = not very satisfied; 3 = satisfied; 4 = very satisfied; 5 = not applicable). The questionnaires were applied at the ski resort, in hotels and through the Portuguese Skiing Federation, between 1 December 2010 and 25 April 2011.
To extract the factors making up the two sections of the questionnaire, exploratory factor analysis was carried out. Afterwards, hierarchical methods of agglomeration, the aggregation method and the Squared Euclidean Distance method were used to make the analysis through the dendogram and check its validation resorting to % of variation derived from the coefficient of determination of the ANOVA applied to the factors as a function of the clusters found. In order to obtain more suitable clusters, the non-hierarchical K-means method was used. The software used was software SPSS program version 17.0 (SPSS Inc., Chicago, Illinois, USA).
Discussion of the Results
Study I
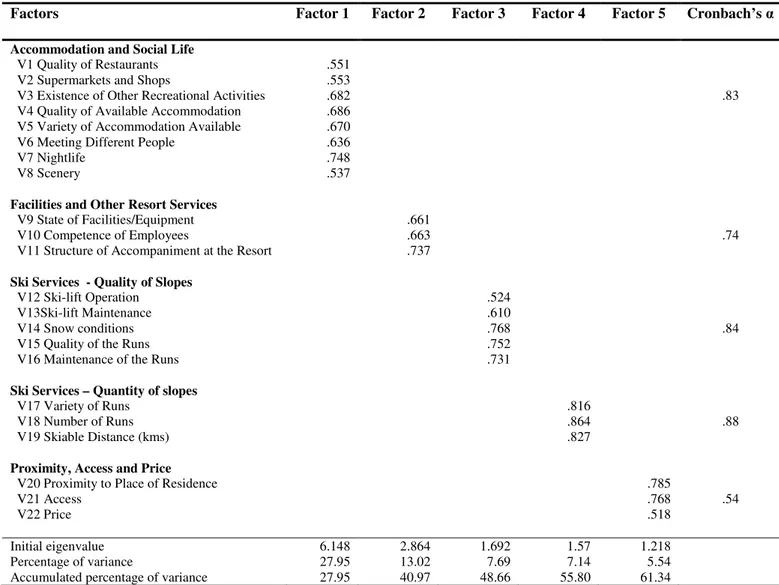
From principle components analysis, using varimax rotation applied to the 24 variables forming the first section of the questionnaire, 5 factors were extracted representing 61.33 % of the total variance. To ensure significance of results, values under .50 were eliminated (Hair, Anderson, Tatham, & Black, 1998), 6 items being removed from the analysis. Data reliability was tested with the Kaiser-Meyer-Olkin test, giving a satisfactory result of .83. The Bartlett sphericity test was also applied, finding that the correlation matrix is not an identity matrix (P < .001), confirming therefore the suitability of the analysis. Internal consistency of factors was confirmed through Cronbach Alphas, these varying between .54 and .88 (Table 2).
Table 2 – Factor Analysis of Attributes for Choosing a Winter Sports Destination
Factors Factor 1 Factor 2 Factor 3 Factor 4 Factor 5 Cronbach’s α
Accommodation and Social Life
V1 Quality of Restaurants V2 Supermarkets and Shops
V3 Existence of Other Recreational Activities V4 Quality of Available Accommodation V5 Variety of Accommodation Available V6 Meeting Different People
V7 Nightlife V8 Scenery .551 .553 .682 .686 .670 .636 .748 .537 .83
Facilities and Other Resort Services
V9 State of Facilities/Equipment V10 Competence of Employees
V11 Structure of Accompaniment at the Resort
.661 .663
.737 .74
Ski Services - Quality of Slopes
V12 Ski-lift Operation V13Ski-lift Maintenance V14 Snow conditions V15 Quality of the Runs V16 Maintenance of the Runs
.524 .610 .768 .752 .731 .84
Ski Services – Quantity of slopes
V17 Variety of Runs V18 Number of Runs V19 Skiable Distance (kms) .816 .864 .827 .88
Proximity, Access and Price
V20 Proximity to Place of Residence V21 Access V22 Price .785 .768 .518 .54 Initial eigenvalue 6.148 2.864 1.692 1.57 1.218 Percentage of variance 27.95 13.02 7.69 7.14 5.54 Accumulated percentage of variance 27.95 40.97 48.66 55.80 61.34
Factor 1 designated “accommodation and social life”, explains 27.95 % of the data variance, including eight items associated with accommodation and social life: the quality of restaurants; supermarkets and shops; the existence of other recreational activities; the quality of available accommodation; the variety of accommodation available; meeting different people; nightlife and finally scenery. Factor 2, named “facilities and other resort services” is formed of the variables of: state of facilities/equipment; competence of employees and structure of accompaniment at the resort, and is responsible for 13.02 % of data variance. Regarding factor 3, with 7.69 % of the variance, this was called “ski services – quality of the slopes”, made up of: lift operation; lift maintenance; snow conditions; run quality and run maintenance. As for factor 4, named “ski services – quantity of slopes” this represents 7.14 % of the
variance, including three items: the variety of runs, the number of runs, and the distance skiable. Finally, factor 5 named “proximity, access and price” includes: proximity to place of residence, access to the resort and also price.
Comparing the results obtained, through principle components analysis, it can be seen that factor 1 (accommodation, restaurants and social life), although also identified in other studies, differs in how it appears aggregated in this case, forming a single factor. In the study by Konu et al. (2010), the restaurant and social life factor was identified, while in other cases restaurants emerged alone (Hudson & Shephard, 1998; Matzler, et al., 2008), as well as accommodation (Godfrey, 1999; Hudson & Shephard, 1998).
In relation to factor 5, representing proximity, access and price, the results agree with those obtained by Buckley (2007) and Godfrey (1999), as in relation to facilities and other services represented by factor 2 (Dickson & Faulks, 2007; Frochot & Kreziak, 2008; Godfrey, 1999; Matzler, et al., 2008).
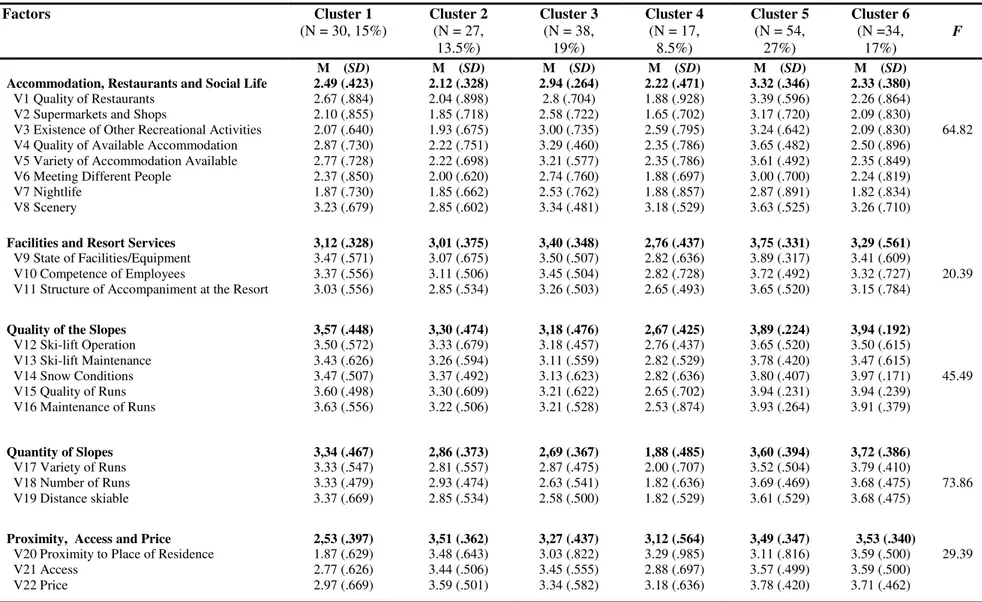
From the 5 factors extracted, 6 clusters were retained (Table 3), with cluster 5 presenting the greatest number of cases (N = 54, 27.0 %) and cluster 4 the lowest number (N = 17, 8.5 %).
Table 3 – Tourist Segmentation Based on Destination Attributes Factors Cluster 1 (N = 30, 15%) Cluster 2 (N = 27, 13.5%) Cluster 3 (N = 38, 19%) Cluster 4 (N = 17, 8.5%) Cluster 5 (N = 54, 27%) Cluster 6 (N =34, 17%) F
Accommodation, Restaurants and Social Life V1 Quality of Restaurants
V2 Supermarkets and Shops
V3 Existence of Other Recreational Activities V4 Quality of Available Accommodation V5 Variety of Accommodation Available V6 Meeting Different People
V7 Nightlife V8 Scenery M (SD) 2.49 (.423) 2.67 (.884) 2.10 (.855) 2.07 (.640) 2.87 (.730) 2.77 (.728) 2.37 (.850) 1.87 (.730) 3.23 (.679) M (SD) 2.12 (.328) 2.04 (.898) 1.85 (.718) 1.93 (.675) 2.22 (.751) 2.22 (.698) 2.00 (.620) 1.85 (.662) 2.85 (.602) M (SD) 2.94 (.264) 2.8 (.704) 2.58 (.722) 3.00 (.735) 3.29 (.460) 3.21 (.577) 2.74 (.760) 2.53 (.762) 3.34 (.481) M (SD) 2.22 (.471) 1.88 (.928) 1.65 (.702) 2.59 (.795) 2.35 (.786) 2.35 (.786) 1.88 (.697) 1.88 (.857) 3.18 (.529) M (SD) 3.32 (.346) 3.39 (.596) 3.17 (.720) 3.24 (.642) 3.65 (.482) 3.61 (.492) 3.00 (.700) 2.87 (.891) 3.63 (.525) M (SD) 2.33 (.380) 2.26 (.864) 2.09 (.830) 2.09 (.830) 2.50 (.896) 2.35 (.849) 2.24 (.819) 1.82 (.834) 3.26 (.710) 64.82
Facilities and Resort Services V9 State of Facilities/Equipment V10 Competence of Employees
V11 Structure of Accompaniment at the Resort
3,12 (.328) 3.47 (.571) 3.37 (.556) 3.03 (.556) 3,01 (.375) 3.07 (.675) 3.11 (.506) 2.85 (.534) 3,40 (.348) 3.50 (.507) 3.45 (.504) 3.26 (.503) 2,76 (.437) 2.82 (.636) 2.82 (.728) 2.65 (.493) 3,75 (.331) 3.89 (.317) 3.72 (.492) 3.65 (.520) 3,29 (.561) 3.41 (.609) 3.32 (.727) 3.15 (.784) 20.39 Quality of the Slopes
V12 Ski-lift Operation V13 Ski-lift Maintenance V14 Snow Conditions V15 Quality of Runs V16 Maintenance of Runs 3,57 (.448) 3.50 (.572) 3.43 (.626) 3.47 (.507) 3.60 (.498) 3.63 (.556) 3,30 (.474) 3.33 (.679) 3.26 (.594) 3.37 (.492) 3.30 (.609) 3.22 (.506) 3,18 (.476) 3.18 (.457) 3.11 (.559) 3.13 (.623) 3.21 (.622) 3.21 (.528) 2,67 (.425) 2.76 (.437) 2.82 (.529) 2.82 (.636) 2.65 (.702) 2.53 (.874) 3,89 (.224) 3.65 (.520) 3.78 (.420) 3.80 (.407) 3.94 (.231) 3.93 (.264) 3,94 (.192) 3.50 (.615) 3.47 (.615) 3.97 (.171) 3.94 (.239) 3.91 (.379) 45.49 Quantity of Slopes V17 Variety of Runs V18 Number of Runs V19 Distance skiable 3,34 (.467) 3.33 (.547) 3.33 (.479) 3.37 (.669) 2,86 (.373) 2.81 (.557) 2.93 (.474) 2.85 (.534) 2,69 (.367) 2.87 (.475) 2.63 (.541) 2.58 (.500) 1,88 (.485) 2.00 (.707) 1.82 (.636) 1.82 (.529) 3,60 (.394) 3.52 (.504) 3.69 (.469) 3.61 (.529) 3,72 (.386) 3.79 (.410) 3.68 (.475) 3.68 (.475) 73.86 Proximity, Access and Price
V20 Proximity to Place of Residence V21 Access V22 Price 2,53 (.397) 1.87 (.629) 2.77 (.626) 2.97 (.669) 3,51 (.362) 3.48 (.643) 3.44 (.506) 3.59 (.501) 3,27 (.437) 3.03 (.822) 3.45 (.555) 3.34 (.582) 3,12 (.564) 3.29 (.985) 2.88 (.697) 3.18 (.636) 3,49 (.347) 3.11 (.816) 3.57 (.499) 3.78 (.420) 3,53 (.340) 3.59 (.500) 3.59 (.500) 3.71 (.462) 29.39
Note1: This solution considers cluster centres as the mean value obtained in each factor
Note2: Values were analyzed considering the following levels of interest represented by the means: Low (< 2.5); Medium (2.5 to 3); and High (> 3).
Note3: Cluster 1 - Snow and grooming; Cluster 2 – Passive tourist; Cluster 3 – Complete experience; Cluster 4 – Proximity, access and price; Cluster 5 - Want it all; Cluster 6 – Ski services, proximity,
Relating to the interest in factors shown by each of the clusters, it can be said that cluster 1 (N = 30, 15%) named “snow and grooming” (Dickson & Faulks, 2007) defines individuals greatly interested in the resort’s facilities and services; quality of slopes and quantity of slopes; showing average interest in accommodation, restaurants and social life; and also proximity, access and price.
Cluster 2 (N = 27, 13.5%), named “passive tourist” (Konu, et al., 2010) shows great interest in the resort’s facilities and services; the quality of the slopes; and the proximity, access and price, showing average interest in the quantity of slopes. It stands out that in this cluster, accommodation, restaurants and social life present a low value.
Cluster 3 (N = 38, 19%), named “complete experience” (Dickson & Faulks, 2007), shows great interest in the resort’s facilities and services; the quality of the slopes; and proximity, access and price; and moderate interest in accommodation, restaurants and social life, and also the quantity of slopes.
Cluster 4 (N = 17, 8.5%), shows little interest with regard to accommodation, restaurants and social life; and also the quantity of slopes. Average interest is shown in the resort’s facilities and services; and the quality of slopes. This cluster shows great interest in proximity, access and price, and was named “proximity, access and price”.
From all the clusters formed, cluster 5 (N = 54, 27%) is the only one presenting great interest in all the factors, and is named “want it all” (Konu, et al., 2010).
Finally, cluster 6 (N = 34, 17%) was called “ski services, proximity, access and price”, showing great interest in all factors except accommodation, restaurants and social life, where interest is moderate.
It can also be observed that in factor 1 (accommodation, restaurants and social life), the most valued item is the quality of available accommodation (mean = 3.65); in factor 2 (resort’s facilities and services) it is the state of facilities and equipment (mean = 3.89); snow conditions (mean = 3.97) is the most valued item in factor 3 (quality of
the slopes); as for factor 4 (quantity of slopes), the variety of runs stands out (mean = 3.79); and finally, price (mean = 3.78) is the item most valued by tourists in relation to factor 5 (proximity, access and price). It is therefore important to highlight that it is cluster 5 that most values the quality of available accommodation, the state of the facilities/equipment and price; the items corresponding to snow conditions and variety of slopes are the ones with most weight in choosing the destination to do winter sports for consumers in cluster 6.
It can also be seen, according to the F value of the ANOVA test, that factor 4, relating to the quantity of slopes, is the one that best discriminates the different clusters (F = 73.86), since the same does not happen with factor 2 (F = 20.39), which represents the resort’s facilities and services.
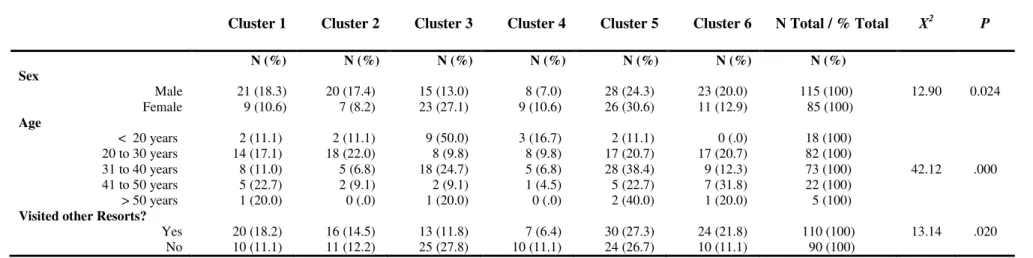
In Table 4, differences between the various clusters can be analyzed, considering consumers’ characteristics relating to sex, age, and knowledge of other winter sports destinations.
Table 4 – Differences between Clusters Relating to Attributes for Choosing a Winter Sports Destination
Cluster 1 Cluster 2 Cluster 3 Cluster 4 Cluster 5 Cluster 6 N Total / % Total X2 P
N (%) N (%) N (%) N (%) N (%) N (%) N (%) Sex Male 21 (18.3) 20 (17.4) 15 (13.0) 8 (7.0) 28 (24.3) 23 (20.0) 115 (100) 12.90 0.024 Female 9 (10.6) 7 (8.2) 23 (27.1) 9 (10.6) 26 (30.6) 11 (12.9) 85 (100) Age < 20 years 2 (11.1) 2 (11.1) 9 (50.0) 3 (16.7) 2 (11.1) 0 (.0) 18 (100) 20 to 30 years 14 (17.1) 18 (22.0) 8 (9.8) 8 (9.8) 17 (20.7) 17 (20.7) 82 (100) 31 to 40 years 8 (11.0) 5 (6.8) 18 (24.7) 5 (6.8) 28 (38.4) 9 (12.3) 73 (100) 42.12 .000 41 to 50 years 5 (22.7) 2 (9.1) 2 (9.1) 1 (4.5) 5 (22.7) 7 (31.8) 22 (100) > 50 years 1 (20.0) 0 (.0) 1 (20.0) 0 (.0) 2 (40.0) 1 (20.0) 5 (100)
Visited other Resorts?
Yes 20 (18.2) 16 (14.5) 13 (11.8) 7 (6.4) 30 (27.3) 24 (21.8) 110 (100) 13.14 .020 No 10 (11.1) 11 (12.2) 25 (27.8) 10 (11.1) 24 (26.7) 10 (11.1) 90 (100)
Note1: Cluster 1 - Snow and grooming; Cluster 2 – Passive tourist; Cluster 3 – Complete experience; Cluster 4 – Proximity, access and price; Cluster 5 - Want it all; Cluster 6 – Ski services, proximity,
Regarding sex, significant differences are found, from the result of the Chi-Squared Test (X2 = 12.90, P < .05). It can therefore be observed that in cluster 1
(21/115, 18.3%), cluster 2 (20/115, 17.4 %), cluster 5 (28/115, 24.3 %) and cluster 6 (23/115, 20.0 %), males predominate, while in cluster 3 (23/85, 27.1 %) and cluster 4 (9/85, 10.6 %) females predominate.
As for age, significant differences were also found (X2 = 41.12, P < .05), with
predominance of age groups between 20 and 40 years. So in cluster 2, the dominant consumer group is formed of 20 to 30 year olds (18/82, 22.0 %), and cluster 5 is formed of 38.4 % of tourists between the ages of 31 and 40. It stands out that the presence of consumers over 50 years of age is residual.
Significant differences were also identified between consumers in the clusters obtained related to them having visited other winter sports destinations or not (X2 =
13.14, P < ,05). In this case, we find that in cluster 1 (20/110, 18.2 %), cluster 2 (16/110, 14.5 %), cluster 5 (30/110, 27.3 %) and cluster 6 (24/110, 21.8 %), there is a greater proportion of individuals who have visited other resorts.
From the results presented, it can be seen that the group classified as “snow and grooming” (cluster 1) are predominantly male, aged between 20 and 30, who have visited other resorts, as is the case with cluster 2 (passive tourist). The tourist group characterized as attributing value to “complete experience” is predominantly female, aged between 31 and 40, with no experience of other resorts. In the group that value “proximity, access and price” (cluster 4) there are slightly more females and aged under 20, also mentioning they have never visited another ski resort. As for the “want it all” segment (cluster 5), they are mainly male visitors, aged between 31 and 40, and with experience of other winter sports destinations. Finally, dominant in the segment valuing “ski services, proximity, access and price” are males aged between 20 and 30, also indicating they have been to other resorts.
Comparison of the different clusters identified that the tourists designated as wanting a “complete experience”, are consumers who have never been to another resort, this result possibly indicating that the lack of knowledge about other cases leads them to attribute medium importance to all factors. Another aspect worth highlighting is the fact that proximity to the resort is pointed out as an important factor for consumers under 20 years of age, this aspect suggesting that young people from the region only visit the resort because of its proximity to their place of residence, as was indicated by the results obtained by Perdue (2004). On the other hand, tourists between 31 and 40 years of age give importance to all attributes, reflecting the profile of a more complex consumer, showing that the quality of their stay will depend on specific attributes for winter sports but also requires comfort in secondary services.
By totalling the aggregate means of each factor and the respective classification attributed by the six clusters (Table 3), it was possible to confirm that the quality of the slopes is the factor given most importance when deciding on a destination for winter sports (mean = 3.42), as can be observed in other studies (Dickson & Faulks, 2007; Godfrey, 1999; Klenosky, et al., 1993; Konu, et al., 2010) .
Study II
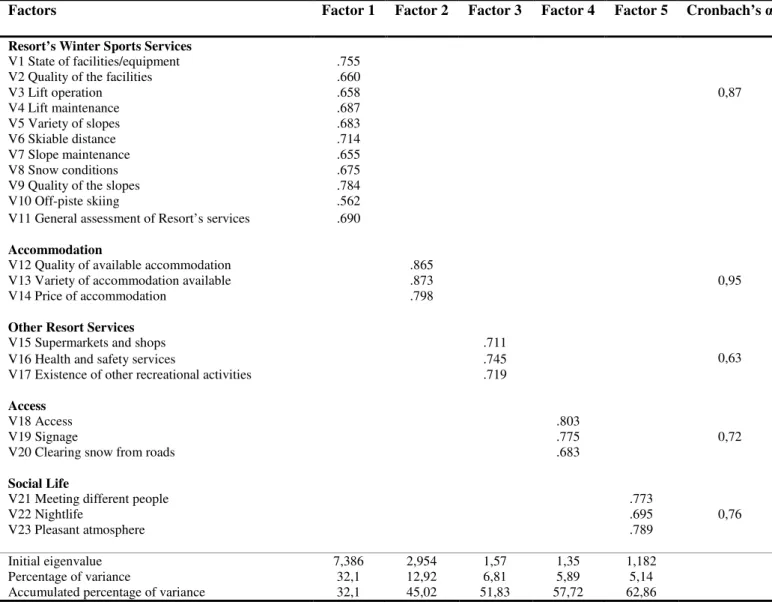
From application of principal components analysis to the 35 variables, relating to tourists’ degree of satisfaction with the services provided by the ski resort of Serra da Estrela, Portugal, with application of varimax rotation, 5 factors were extracted representing 50.8 % of the total variance. To ensure significance, values under .50 were eliminated (Hair, et al., 1998), 5 items being removed from the analysis. The Kaiser-Meyer-Olkin test allowed validation of data reliability (.87) and the Bartlett sphericity test (p < .001) confirmed the analysis was suitable. The Cronbach Alpha allowed assessment of the internal consistency of factors, these varying between .63 and .95 (Table 5).
Table 5 – Factor Analysis of the Degree of Satisfaction with Resort Attributes
Factors Factor 1 Factor 2 Factor 3 Factor 4 Factor 5 Cronbach’s α
Resort’s Winter Sports Services
0,87 V1 State of facilities/equipment .755
V2 Quality of the facilities .660
V3 Lift operation .658 V4 Lift maintenance .687 V5 Variety of slopes .683 V6 Skiable distance .714 V7 Slope maintenance .655 V8 Snow conditions .675 V9 Quality of the slopes .784 V10 Off-piste skiing .562 V11 General assessment of Resort’s services .690
Accommodation
0,95 V12 Quality of available accommodation .865
V13 Variety of accommodation available .873 V14 Price of accommodation .798
Other Resort Services
0,63
V15 Supermarkets and shops .711
V16 Health and safety services .745 V17 Existence of other recreational activities .719
Access
0,72
V18 Access .803
V19 Signage .775
V20 Clearing snow from roads .683
Social Life
0,76
V21 Meeting different people .773
V22 Nightlife .695
V23 Pleasant atmosphere .789
Initial eigenvalue 7,386 2,954 1,57 1,35 1,182 Percentage of variance 32,1 12,92 6,81 5,89 5,14 Accumulated percentage of variance 32,1 45,02 51,83 57,72 62,86
Factor 1 explains 32.1 % of data variance and is associated with “ski resort services”, made up as follows: state of facilities/equipment; quality of the facilities; ski-lift operation; service provided at the resort; ski-ski-lift maintenance; variety of slopes; skiable distance; slope maintenance; snow conditions; quality of the slopes; off-piste skiing and service provided by the resort. Factor 2 (accommodation), includes the variety of accommodation available; quality of available accommodation and the price of accommodation, accounting for 12.92 % of data variance. Concerning factor 3 (6,81 % of the variance) representing “other resort services”, it is made up of: supermarkets and shops; health and safety services and finally other recreational activities. Factor 4, classified as “access”, represents 5.89 % of the variance, including: access, clearing snow off the roads and signage. Finally, factor 5, “social life”, also includes three items: meeting different people; nightlife and pleasant atmosphere, representing 5.14 % of the variance.
A similarity was found when comparing with other studies, regarding specific services for participating in winter sports (Oliver, 1980; Parasuraman, et al., 1985); in relation to accommodation (Godfrey, 1999; Hudson & Shephard, 1998), with this factor in this study including specifically quality, variety and price of accommodation; and also relating to factor 3, concerning other resort services (Frochot & Kreziak, 2008; Hudson & Shephard, 1998). It is of note that Matzler (2008) identified a factor related to restaurants and resort staff, which was not shown in this study.
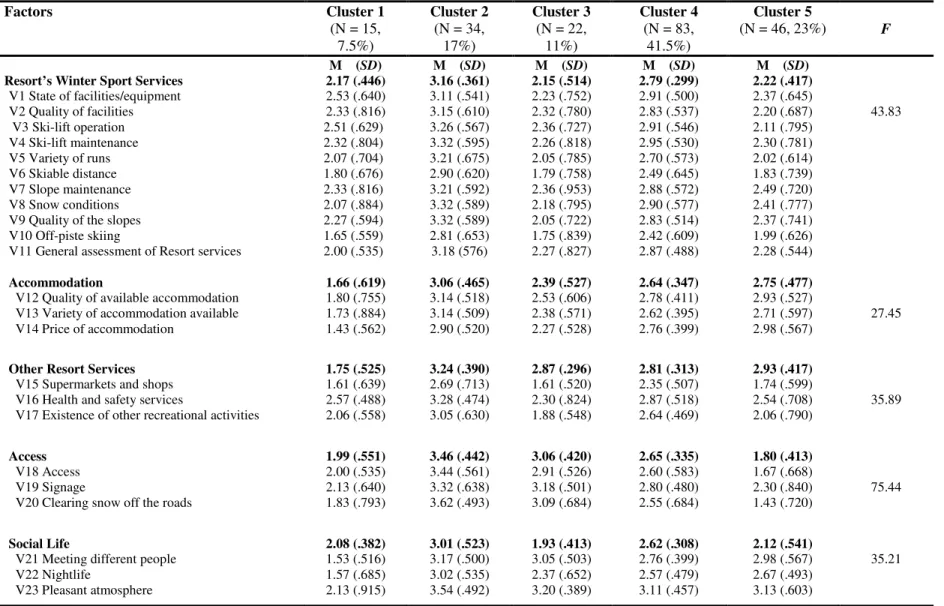
Afterwards, 5 clusters were identified from the factors obtained in the previous factor analysis. Table 6 illustrates that cluster 4 presents the greatest number of cases (N = 83, 41.5 %) and cluster 1 (N = 15, 7.5%) the lowest number.
Table 6 – Tourist Segmentation regarding Satisfaction with Resort Services Factors Cluster 1 (N = 15, 7.5%) Cluster 2 (N = 34, 17%) Cluster 3 (N = 22, 11%) Cluster 4 (N = 83, 41.5%) Cluster 5 (N = 46, 23%) F
Resort’s Winter Sport Services V1 State of facilities/equipment V2 Quality of facilities V3 Ski-lift operation V4 Ski-lift maintenance V5 Variety of runs V6 Skiable distance V7 Slope maintenance V8 Snow conditions V9 Quality of the slopes V10 Off-piste skiing
V11 General assessment of Resort services
M (SD) 2.17 (.446) 2.53 (.640) 2.33 (.816) 2.51 (.629) 2.32 (.804) 2.07 (.704) 1.80 (.676) 2.33 (.816) 2.07 (.884) 2.27 (.594) 1.65 (.559) 2.00 (.535) M (SD) 3.16 (.361) 3.11 (.541) 3.15 (.610) 3.26 (.567) 3.32 (.595) 3.21 (.675) 2.90 (.620) 3.21 (.592) 3.32 (.589) 3.32 (.589) 2.81 (.653) 3.18 (576) M (SD) 2.15 (.514) 2.23 (.752) 2.32 (.780) 2.36 (.727) 2.26 (.818) 2.05 (.785) 1.79 (.758) 2.36 (.953) 2.18 (.795) 2.05 (.722) 1.75 (.839) 2.27 (.827) M (SD) 2.79 (.299) 2.91 (.500) 2.83 (.537) 2.91 (.546) 2.95 (.530) 2.70 (.573) 2.49 (.645) 2.88 (.572) 2.90 (.577) 2.83 (.514) 2.42 (.609) 2.87 (.488) M (SD) 2.22 (.417) 2.37 (.645) 2.20 (.687) 2.11 (.795) 2.30 (.781) 2.02 (.614) 1.83 (.739) 2.49 (.720) 2.41 (.777) 2.37 (.741) 1.99 (.626) 2.28 (.544) 43.83 Accommodation
V12 Quality of available accommodation V13 Variety of accommodation available V14 Price of accommodation 1.66 (.619) 1.80 (.755) 1.73 (.884) 1.43 (.562) 3.06 (.465) 3.14 (.518) 3.14 (.509) 2.90 (.520) 2.39 (.527) 2.53 (.606) 2.38 (.571) 2.27 (.528) 2.64 (.347) 2.78 (.411) 2.62 (.395) 2.76 (.399) 2.75 (.477) 2.93 (.527) 2.71 (.597) 2.98 (.567) 27.45
Other Resort Services V15 Supermarkets and shops V16 Health and safety services
V17 Existence of other recreational activities
1.75 (.525) 1.61 (.639) 2.57 (.488) 2.06 (.558) 3.24 (.390) 2.69 (.713) 3.28 (.474) 3.05 (.630) 2.87 (.296) 1.61 (.520) 2.30 (.824) 1.88 (.548) 2.81 (.313) 2.35 (.507) 2.87 (.518) 2.64 (.469) 2.93 (.417) 1.74 (.599) 2.54 (.708) 2.06 (.790) 35.89 Access V18 Access V19 Signage
V20 Clearing snow off the roads
1.99 (.551) 2.00 (.535) 2.13 (.640) 1.83 (.793) 3.46 (.442) 3.44 (.561) 3.32 (.638) 3.62 (.493) 3.06 (.420) 2.91 (.526) 3.18 (.501) 3.09 (.684) 2.65 (.335) 2.60 (.583) 2.80 (.480) 2.55 (.684) 1.80 (.413) 1.67 (.668) 2.30 (.840) 1.43 (.720) 75.44 Social Life
V21 Meeting different people V22 Nightlife V23 Pleasant atmosphere 2.08 (.382) 1.53 (.516) 1.57 (.685) 2.13 (.915) 3.01 (.523) 3.17 (.500) 3.02 (.535) 3.54 (.492) 1.93 (.413) 3.05 (.503) 2.37 (.652) 3.20 (.389) 2.62 (.308) 2.76 (.399) 2.57 (.479) 3.11 (.457) 2.12 (.541) 2.98 (.567) 2.67 (.493) 3.13 (.603) 35.21
Note1: This solution considers cluster centres as the mean value obtained in each factor
Note2: Values were analyzed considering the following levels of interest represented by the means: Low (< 2.5); Medium (2.5 to 3); and High (> 3).
Note3: Cluster 1 – Total dissatisfaction; Cluster 2 – Total satisfaction; Cluster 3 – Satisfaction with proximity and other services; Cluster 4 – Moderate satisfaction with everything; Cluster 5 – Satisfaction
Cluster 1 (N = 15, 7.5 %), classed as “total dissatisfaction”, represents consumers with a low degree of satisfaction in all factors (winter sports resort services, other resort services, access and social life), whereas cluster 2 (N = 34, 17 %) shows high satisfaction with all factors, and is therefore designated as “total satisfaction”.
Cluster 3 (N = 22, 11 %) presents high satisfaction with factor 4 (access), moderate with factor 3 (other resort services) and low for the other factors. Cluster 4 (N = 83, 41,5 %) represents moderate satisfaction with all factors; and finally cluster 5 (N = 46, 23 %) presents moderate satisfaction with factors 2 (accommodation) and 3 (other resort services) and low satisfaction in relation to all the other factors.
As for the items representing greatest satisfaction among consumers, it is indicated that in relation to factor 1 (winter sports resort services), the most highly valued were ski-lift maintenance, snow conditions and quality of the slopes, all with the same mean value = 3.32. In factor 2 (accommodation) the most highly valued items are the quality and variety of accommodation, also with the same mean = 3.14; in factor 3 (other resort services) the item giving most satisfaction is health and safety services (mean = 3.28). Regarding factor 4 (access), snow-clearing was mentioned (mean = 3.62); and finally, the pleasant atmosphere (mean = 3.54) was the most highly valued item in factor 5 (Social Life). It stands out that all these items are inserted in cluster 2 (total satisfaction).
From the F values obtained in the ANOVA test, access (Factor 4) is what best differentiates the 5 clusters (F = 75.44), with accommodation (factor 2) being what least allows distinction (F = 27.45).
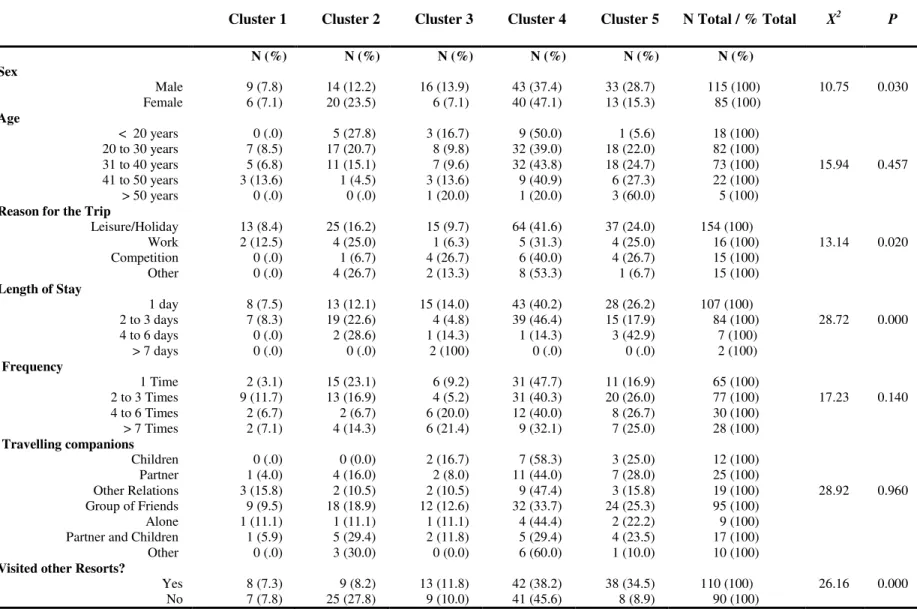
The differences between the various clusters, considering consumer characteristics related to sex, age, reason for the trip, length of stay, frequency of visits to the resort each year, travelling companions and also if they have visited other destinations to participate in winter sports, can be seen in Table 7.
Table 7 – Differences between Clusters in Relation to Satisfaction with Resort Services
Cluster 1 Cluster 2 Cluster 3 Cluster 4 Cluster 5 N Total / % Total X2 P
N (%) N (%) N (%) N (%) N (%) N (%) Sex Male 9 (7.8) 14 (12.2) 16 (13.9) 43 (37.4) 33 (28.7) 115 (100) 10.75 0.030 Female 6 (7.1) 20 (23.5) 6 (7.1) 40 (47.1) 13 (15.3) 85 (100) Age < 20 years 0 (.0) 5 (27.8) 3 (16.7) 9 (50.0) 1 (5.6) 18 (100) 20 to 30 years 7 (8.5) 17 (20.7) 8 (9.8) 32 (39.0) 18 (22.0) 82 (100) 31 to 40 years 5 (6.8) 11 (15.1) 7 (9.6) 32 (43.8) 18 (24.7) 73 (100) 15.94 0.457 41 to 50 years 3 (13.6) 1 (4.5) 3 (13.6) 9 (40.9) 6 (27.3) 22 (100) > 50 years 0 (.0) 0 (.0) 1 (20.0) 1 (20.0) 3 (60.0) 5 (100) Reason for the Trip
Leisure/Holiday 13 (8.4) 25 (16.2) 15 (9.7) 64 (41.6) 37 (24.0) 154 (100) Work 2 (12.5) 4 (25.0) 1 (6.3) 5 (31.3) 4 (25.0) 16 (100) 13.14 0.020 Competition 0 (.0) 1 (6.7) 4 (26.7) 6 (40.0) 4 (26.7) 15 (100) Other 0 (.0) 4 (26.7) 2 (13.3) 8 (53.3) 1 (6.7) 15 (100) Length of Stay 1 day 8 (7.5) 13 (12.1) 15 (14.0) 43 (40.2) 28 (26.2) 107 (100) 2 to 3 days 7 (8.3) 19 (22.6) 4 (4.8) 39 (46.4) 15 (17.9) 84 (100) 28.72 0.000 4 to 6 days 0 (.0) 2 (28.6) 1 (14.3) 1 (14.3) 3 (42.9) 7 (100) > 7 days 0 (.0) 0 (.0) 2 (100) 0 (.0) 0 (.0) 2 (100) Frequency 1 Time 2 (3.1) 15 (23.1) 6 (9.2) 31 (47.7) 11 (16.9) 65 (100) 2 to 3 Times 9 (11.7) 13 (16.9) 4 (5.2) 31 (40.3) 20 (26.0) 77 (100) 17.23 0.140 4 to 6 Times 2 (6.7) 2 (6.7) 6 (20.0) 12 (40.0) 8 (26.7) 30 (100) > 7 Times 2 (7.1) 4 (14.3) 6 (21.4) 9 (32.1) 7 (25.0) 28 (100) Travelling companions Children 0 (.0) 0 (0.0) 2 (16.7) 7 (58.3) 3 (25.0) 12 (100) Partner 1 (4.0) 4 (16.0) 2 (8.0) 11 (44.0) 7 (28.0) 25 (100) Other Relations 3 (15.8) 2 (10.5) 2 (10.5) 9 (47.4) 3 (15.8) 19 (100) 28.92 0.960 Group of Friends 9 (9.5) 18 (18.9) 12 (12.6) 32 (33.7) 24 (25.3) 95 (100) Alone 1 (11.1) 1 (11.1) 1 (11.1) 4 (44.4) 2 (22.2) 9 (100) Partner and Children 1 (5.9) 5 (29.4) 2 (11.8) 5 (29.4) 4 (23.5) 17 (100)
Other 0 (.0) 3 (30.0) 0 (0.0) 6 (60.0) 1 (10.0) 10 (100)
Visited other Resorts?
Yes 8 (7.3) 9 (8.2) 13 (11.8) 42 (38.2) 38 (34.5) 110 (100) 26.16 0.000
No 7 (7.8) 25 (27.8) 9 (10.0) 41 (45.6) 8 (8.9) 90 (100)
Note1: Cluster 1 – Total dissatisfaction; Cluster 2 – Total satisfaction; Cluster 3 – Satisfaction with proximity and other services; Cluster 4 – Moderate satisfaction with everything; Cluster 5 – Satisfaction only with accommodation and other services.
The results obtained can indicate that regarding sex, significant differences were detected (X2 = 10.75, P < .05), with a greater proportion of men in cluster 1 (9/115, 7.8
%); cluster 3 (16/115, 13.9 %); cluster 4 (43/115, 37.4 %); and cluster 5 (33/115, 28.7 %), and only in cluster 2 (total satisfaction) do female consumers predominate (20/85, 23.5 %).
As for the reason for the journey, significant differences were found (X2 = 13.14,
P < .05), and it emerges that the majority of consumers seek out the resort for leisure or holidays, with cluster 4 (64/154, 41.6 %) and cluster 5 (37/154, 24.0 %) standing out particularly.
Concerning the length of stay, significant differences were found between clusters (X2 = 28.72, P < .05), finding a predominance of stays lasting from 1 to 3 days. A stay
of 1 day is most characteristic of consumers in cluster 4 (43/107, 40 %) and cluster 5 (28/107, 26.2 %); and a stay of 2 to 3 days predominates in cluster 4 (39/84, 46 %).
Significant differences were also found between consumers in the different clusters regarding the fact of having already experienced the services of other resorts to participate in winter sports (X2 = 26.16, P < .05), with the number of consumers who
have already done so being greater, despite this figure not being very different from those who have never done so. However, cluster 2 (total satisfaction) stands out with a predominance of consumers indicating they have never been to another resort (25/90, 27.8 %); and at the other extreme is cluster 5 (satisfaction only with the accommodation and other services), with an indication that 34% of this consumer group have already done so (38/110).
No significant differences were found between the clusters obtained in relation to age (X2 = 15.94, P >= .05); frequency of visits to the resort (X2 = 17.23, p >= .05); and
in relation to the type of travelling companions (X2 = 28.92, P >= .05)
From the results presented, it can be seen that cluster 1 (tourists dissatisfied with everything) is made up fundamentally of males, aged between 20 and 30, the reason for
the trip being leisure/holidays and staying only 1 day in the resort. They are also consumers who visit the resort 2 to 3 times a year (Perdue, 2004), in the company of friends. In this cluster, there is no discrimination regarding knowledge of other winter sports destinations.
As for cluster 2 (total satisfaction), female consumers show most satisfaction, being aged between 20 and 30 and travelling to the resort for leisure/holidays for a stay of 2 to 3 days. Their travelling companions are a group of friends and they do not indicate experience of other places, which suggests this total satisfaction with the attributes of this resort could be due to not having a point of comparison.
The consumers in cluster 3 (satisfied with the proximity and other services), are essentially male and aged between 20 and 30, and just as in the previous clusters, leisure/holidays is the reason for travelling. Length of stay is only 1 day and this group indicates they have already visited other ski resorts.
Cluster 4 (moderate satisfaction with everything), is evenly distributed regarding sex and the same occurs between the 20 to 30 age group and the 31 to 40 age group, with the main reason for the trip being leisure/holidays. The length of stay and frequency are also similar, between 1 and 3 days, and between 1 and 3 times per year respectively. Similarly to the previous clusters, travelling companions are friends. This group is also quite balanced with regard to experience of other resorts.
Finally, cluster 5 (satisfaction only with accommodation and other services), is made up of a mainly male sample, with similarities between the 20 to 30 and 31 to 40 age groups. The reason for the trip is leisure/holidays, and the trip to this destination is made 2 to 3 times per year. The group is divided essentially and evenly between those who stay only 1 day and those who stay 2 to3 days. Once again, they come in a group of friends and this set of people show clear experience of other ski resorts.
It is found therefore that the people who are completely satisfied have never experienced other resorts, and this fact should not be ignored, as the absence of other
references can influence assessment of the quality of service. We can also conclude that the tourist who comes to the Serra da Estrela ski resort does not stay more than 1 day or a weekend (Gammon & Robinson, 2003), highlighting the fact that a great many consumers (43,5 %) live around 100 km from the resort and they are not likely to stay several days in the region’s hotels etc.
From the sum between the aggregated means of each factor and the respective classification attributed by the six clusters (Table 6), it could be confirmed that “other resort services” (supermarkets and shops; health and safety services; existence of other recreational activities) is the factor representing greatest satisfaction among the resort’s consumers (mean = 2,72), characteristics which are also mentioned in the study by Hudson (1998).
It is also of note that social life has been quite a valued aspect in destinations of this type, as demonstrated in various studies (Godfrey, 1999; Klenosky, et al., 1993; Konu, et al., 2010), but in this particular case this factor is classified with little satisfaction (mean = 2,35), which may be due to the fact this resort has no nightlife establishments, suggesting that decision-makers should intervene in this area.
Therefore, from analysis of the results of Study I (identification of the attributes that different tourist segments prioritize in choosing a winter sports destination) and Study II (degree of tourists’ satisfaction with the services provided by the ski resort of Serra da Estrela, Portugal), they can be seen to point in opposite directions, indicating that what consumers value in this type of destination is not completely met by what this resort offers. It is of note that when consumers choose a destination, they give great importance to the quality of the slopes (mean = 3.42), but when they assess their satisfaction with the resort services, they show greater satisfaction with the resort’s other services (mean = 2.72) than with the specific services for doing winter sports. It also stands out that the means attributed to the different factors related to level of satisfaction vary between 2.50 and 2.72. This fact suggests the possibility of greater
improvement of a set of attributes that would allow improved consumer satisfaction, with intervention in aspects that can develop the competitiveness of this destination (Eisenhardt & Martin, 2003; Rumelt, 1997). It is also concluded that this is a destination visited mainly by consumers aged between 20 and 40, who live near the resort and stay there only 1 day (Gilbert & Hudson, 2000; Perdue, 2004), indicating the need to attract consumers who stay longer to do winter sports and consequently use the accommodation and restaurant services, contributing in this way to developing tourism in the region.
Conclusions
The objective of this study was to: identify the attributes different tourist segments prioritize in choosing a destination for winter sports (Study I) and analyze their degree of satisfaction with the services provided at Portugal’s only ski resort (Study II).
Regarding the attributes various tourist segments value in choosing a winter sports destination, five factors stood out: accommodation, restaurants and social life; resort facilities and services; quality of the slopes; quantity of slopes; and finally, proximity, access and price. Based on the factors mentioned, consumers were segmented in six clusters: Snow and grooming; passive tourist; complete experience; proximity, access and price; want it all; and finally, ski services, proximity, access and price. The items included in each factor and classified with higher means were respectively: quality of available accommodation; state of facilities and equipment; snow conditions; variety of slopes; and finally, price. When analyzing the six clusters relating to sex, age and knowledge of other winter sports destinations, significant differences were found.
As for the degree of satisfaction of consumers visiting the Serra da Estrela ski resort, 5 factors were also identified: the resort’s winter sports services; accommodation; other resort services; access; and social life. Five clusters were identified to discriminate assessment in terms of tourists’ satisfaction with each of the retained factors: total dissatisfaction; total satisfaction; satisfaction with proximity and other services; moderate satisfaction with everything; satisfaction only with accommodation and other services. The items included in each factor and classified with higher means were respectively: ski-lifts, snow conditions and quality of the slopes; quality and variety of accommodation; health and safety services; snow-clearing; and pleasant atmosphere. It stands out that this classification belongs to cluster 2 (total satisfaction) characterized by a group that largely do not know the situation at other resorts. The five clusters were analyzed in relation to sex; age; reason for the trip; length of stay; frequency of visits to
the resort each year; travelling companions; and if they had been to other destinations to participate in winter sports. Significant differences were found in relation to sex, reason for the trip, length of stay and the fact of having visited other resorts previously.
It is concluded that despite consumers showing moderate satisfaction in relation to the items studied, when comparing these results with the attributes prioritized in choosing a destination for winter sports, the items with highest levels of dissatisfaction are observed to be those pointed out as most relevant when choosing this type of destination. The factor that consumers value most in choosing a winter sports destination is the quality of the slopes, including the items: ski-lift operation; ski-lift maintenance; slope maintenance; snow conditions; and quality of the slopes, aspects classified by consumers as rather unsatisfactory.
Therefore, it is suggested that organizational decision-makers take this type of information into account, identifying the attributes valued by consumers at this type of destination, so as to contribute to raising their level of satisfaction. However, to maintain this consistency over time, it is necessary to monitor permanently if the consumer profile is changing (d'Hauteserre, 2000). In addition, entrepreneurial and innovative spirit should be encouraged, in order to make continuous improvement in the services provided, without ignoring the characteristics of the destination’s differentiating resources, and therefore raising its level of competitiveness (Gilbert, 1993; Poon, 1993; Porter, 1980; Porter, Sachs, & McArthur, 2002; Ritchie & Crouch, 2000).
As limitations of this investigation, the sample size stands out, which could be reflected in the robustness of the data, and also the fact it is a case study. Therefore, generalization of these results should be made with care, and even more so because this organization has different characteristics from others operating in the same sector of activity. In addition, cultural and economic aspects, which should not be ignored in studies of this type, should be considered in its interpretation.
As future lines of investigation, longitudinal application of this investigation model is suggested, in order to clarify the profile of winter sports consumers. Another suggestion is to study the reasons why other tourists travel to the area without taking part in the winter sports on offer.