Universidade do Minho
Escola de Engenharia
Jessica Costa da Silva
outubro de 2019
Development of a novel food application
using mixtures of commercial prebiotics
Jessica Costa da Silva
De
velopment of a no
vel food application using mixtures of commercial prebiotics
UMinho|20
Jessica Costa da Silva
outubro de 2019
Development of a novel food application
using mixtures of commercial prebiotics
Trabalho efetuado sob a orientação da
Professora Doutora Lígia Raquel Marona Rodrigues
e da
Doutora Sara Isabel da Cruz Silvério
Dissertação de Mestrado
Mestrado em Biotecnologia
Universidade do Minho
Escola de Engenharia
ii
DIREITOS DE AUTOR E CONDIÇÕES DE UTILIZAÇÃO DO TRABALHO POR TERCEIROS
Este é um trabalho académico que pode ser utilizado por terceiros desde que respeitadas as regras e boas práticas internacionalmente aceites, no que concerne aos direitos de autor e direitos conexos. Assim, o presente trabalho pode ser utilizado nos termos previstos na licença abaixo indicada.
Caso o utilizador necessite de permissão para poder fazer um uso do trabalho em condições não previstas no licenciamento indicado, deverá contactar o autor, através do RepositóriUM da Universidade do Minho.
Atribuição-NãoComercial CC BY-NC
iii
Agradecimentos
Primeiramente agradeço à minha orientadora, Professora Doutora Lígia Rodrigues pela oportunidade de participar neste projeto, pela ajuda e disponibilidade.
Agradeço à Doutora Sara Silvério e à Doutora Cláudia Amorim por toda a disponibilidade, incentivo, integração, por todos os conselhos e pelo auxílio prontamente prestado durante a elaboração desta dissertação. Agradeço ainda à Beatriz Cardoso pelo apoio no decorrer deste trabalho.
Este estudo recebeu financiamento do projeto NewFood (NORTE-01-0246-FEDER-000043).
Gostaria de agradecer a todos os amigos que de uma forma direta ou indireta, me acompanharam desde o Colégio e durante o percurso académico, pela paciência, atenção e força que prestaram em momentos menos fáceis. Também um agradecimento aos meus colegas de casa, que tornaram a minha passagem por Braga mais divertida.
Agradeço ao meu Padrinho, pelasua amizade e pela inteira disponibilidade em me acompanhar desde sempre.
Por último, mas não menos importante, aosmeus pais, aos meus avós, Maria e António, pela força e pelo carinho que sempre me prestaram ao longo de toda a minha vida, a qual sem o seu apoio teria sido impossível.
iv
STATEMENT OF INTEGRITY
I hereby declare having conducted this academic work with integrity. I confirm that I have not used plagiarism or any form of undue use of information or falsification of results along the process leading to its elaboration.
v
Development of a novel food application using mixtures of commercial
prebiotics
Abstract
The increased consumer awareness of the importance of a healthy lifestyle to prevent diseases and maintain the well-being led to the advance of the functional foods and beverages market, that exhibits an expected revenue of €252.079 million worldwide by 2025. Functional food is described as food consumed as part of the daily diet but has demonstrated physiological benefits beyond basic nutrition. Health and well-being improvement via gut microbiota modulation is an attractive approach to shift composition and metabolic signatures of the microbiota, namely through the ingestion of prebiotics. Prebiotics include non-digestible carbohydrates and non-carbohydrates with proven ability to modulate microbial populations, such as the gut microbiota. Fructooligosaccharides (FOS) and galactooligosaccharides (GOS) are very well-studied prebiotic oligosaccharides with proven health benefits in humans. These compounds can be added to foods and beverages due to their nutritional value and technological properties, being used for instance to improve the mouthfeel, to replace sugar and fat content and to increase the fibre content. In this work, the prebiotic potential of commercial FOS and GOS, individually and in mixtures (GF), was studied using an in vitro model of static batch culture fermentations with human faecal inoculum (48h at 37oC). The production of lactate and short-chain fatty
acids (SCFAs), ammonia and gases was evaluated, as well as the pH variation. The fermentation of GOS led to the highest production of SCFAs, namely acetate and propionate, 125.10±19.62 mM and 18.09±5.08 mM, respectively. PH values and ammonia concentrations decreased with the supplementation of prebiotics, with the mixture GF 3:1 yielding the major ammonia reduction, namely 9-fold. Overall, the production of CO2 increased with the addition of all prebiotics, while the CH4 production
decreased with GOS supplementation. In addition, a healthier traditional Portuguese rice cake containing GOS and GF 3:1, and a 25% sugar reduction, was herein developed. The sensory test results revealed no significant differences in appearance, aroma, taste, texture and overall impression between the original recipe and the 3 modified recipes tested. However, based on market acceptability, recipes 4 (25% sugar reduction) and 5 (25% sugar reduction and 1% GOS addition) were selected as the most accepted ones. Keywords: FOS, functional food, GOS, prebiotics, sensory test,
vi
Desenvolvimento de novas aplicações alimentares com misturas de
prebióticos comerciais
Resumo
O aumento da consciência dos consumidores sobre a importância de um estilo de vida saudável na prevenção de doenças e na manutenção do bem-estar, levou à expansão do mercado de alimentos e bebidas funcionais, que apresenta uma receita mundial expectável de €252.079 milhões até 2025. Alimentos funcionais são alimentos consumidos numa dieta diária normal, mas que apresentam benefícios fisiológicos comprovados além da nutrição convencional. Melhoria da saúde e do bem-estar através da modulação da microbiota intestinal é uma estratégia em crescimento para alterar a composição e assinatura metabólica da mesma, que pode ser obtida pela ingestão de prebióticos. Os prebióticos incluem hidratos de carbono não digeríveis e outros compostos que não são carboidratos. Fruto-oligossacáridos (FOS) e galato-oligossacáridos (GOS), são oligossacáridos prebióticos muito bem estudados com benefícios provados para a saúde humana. Estes substratos podem ser adicionados a alimentos e bebidas funcionais pelo seu valor nutricional e pelas suas propriedades tecnológicas para, por exemplo, melhorar a textura de produtos, substituir o teor de açúcar e gordura e aumentar o teor de fibra. Neste trabalho foi estudado o potencial prebiótico de FOS e GOS, individualmente e em misturas (GF), através de um modelo in vitro de fermentações descontínuas inoculadas com microbiota fecal humana (48h a 37oC). Foi avaliada a produção de lactato e ácidos gordos de cadeia curta (SCFAs),
amónia e gases, assim como a variação de pH. A fermentação com GOS resultou na maior produção de SCFAs, nomeadamente de acetato e propionato com 125.10±19.62 mM e 18.09±5.08 mM, respetivamente. A concentração de amónia e os valores de pH diminuíram como resultado da adição de prebióticos, com a mistura GF na proporção 3:1 a resultar na maior redução de amónia, nomeadamente 9 vezes. De um modo geral, a suplementação com todos os prebióticos causou um aumento na produção de CO2, enquanto que a produção de CH4 diminui como resultado da suplementação com GOS.
Adicionalmente, desenvolveu-se a receita de um bolo de arroz tradicional mais saudável com a incorporação de GOS e GF 3:1 e com uma redução de açúcar de 25%. Os testes sensoriais não revelaram diferenças significativas entre a receita tradicional e as 3 receitas modificadas nos parâmetros de aparência aroma, sabor, textura e impressão global. No entanto, a aceitabilidade do mercado sugere que as receitas 4 (redução de 25% de açúcar) e 5 (redução de 25% de açúcar e adição de 1% de GOS) são as mais aceites.
vii
viii
List of Figures
Figure 1: Main health benefits to the GI tract associated with prebiotic supplementation. ... 6 Figure 2: Lactate and SCFAs’ production during a period of 48h of faecal human microbiota growth from one donor, in the absence of prebiotics (Control) and in a medium supplemented with a prebiotic solution of 10g/L FOS. The results are the average of two independent fermentations ± standard deviation. ... 18 Figure 3: Lactate and SCFAs’ production during a period of 48h of faecal human microbiota growth from one donor, in the absence of prebiotics (Control) and in a medium supplemented with a prebiotic solution of 10g/L GOS. The results are the average of two independent fermentations ± standard deviation. ... 18 Figure 4: Lactate and SCFAs’ production during a period of 48h of faecal human microbiota growth from one donor, in the absence of prebiotics (Control 3) and in a medium supplemented with a prebiotic solution of 10g/L of either GF 1:3, GF 3:1 or GF 1:1. The results are the average of two independent fermentations ± standard deviation. ... 19
Figure 5: CO2, H2 and CH4 production during a period of 48h of faecal human microbiota growth from one donor,
in the absence of prebiotics (control) and in a medium supplemented with a prebiotic solution of FOS (10g/L). The results are the average of two independent fermentations and triplicate analysis of each sample ± standard deviation. ... 23
Figure 6: CO2, H2 and CH4 production during a period of 48h of faecal human microbiota growth from one donor in
the absence of prebiotics (control) and in a medium supplemented with a prebiotic solution of GOS (10g/L). The results are the average of two independent fermentations and triplicate analysis of each sample ± standard deviation. ... 24
Figure 7: CO2, H2 and CH4 production during a period of 48h of faecal human microbiota growth from one donor in
the absence of prebiotics (control) and in a medium supplemented with a prebiotic solution 10g/L of either GF 1:3, GF 3:1 or GF 1:1. The results are the average of two independent fermentations and triplicate analysis of each sample ± standard deviation. ... 25 Figure 8: Lactate and short-chain fatty acids (SCFAs) production during a period of 48h of faecal human microbiota growth from one donor, in the absence of prebiotics (control) and in a medium supplemented with a prebiotic solution of either FOS, GOS, GF 1:3, GF 3:1 or GF 1:1 (10g/L). The results presented in relative percentages compared to the control of each experiment, are the average of two independent fermentations ± standard deviation. ... 27 Figure 9: Ammonia concentration after 48h of faecal human microbiota growth from one donor in the absence of prebiotics (control) and in a medium supplemented with a prebiotic solution of either FOS, GOS, GF 1:3, GF 3:1 or GF 1:1 (10g/L). The results presented in relative percentages compared to the control of each experiment, are the average of two independent fermentations ± standard deviation. ... 27
ix
Figure 10: CO2, H2 and CH4 production during a period of 48h of faecal human microbiota growth from one donor
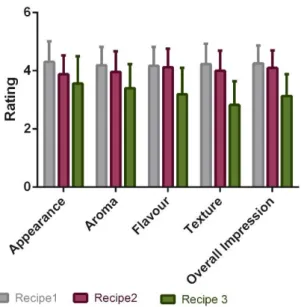
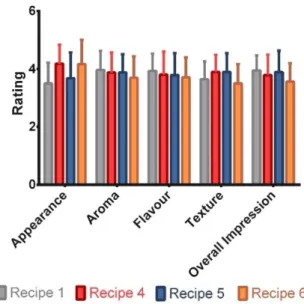
in the absence of prebiotics (control) and in a medium supplemented with a prebiotic solution of either FOS, GOS, GF 1:3, GF 3:1 or GF 1:1 (10g/L). The results presented in relative percentages compared to the control of each experiment, are the average of two independent fermentations and triplicate analysis of each sample ± standard deviation. ... 28 Figure 11: Sensory profiles of the 3 recipes regarding appearance, aroma, flavour, texture and overall impression, rated from 1 to 5 by 33 female panellists and 19 male panellists. The results are presented in average± standard deviation. ... 29 Figure 12: Evaluation of the similarity between recipes 1 and 2 cakes and the traditional Portuguese rice cake. The results are presented in percentages. ... 29 Figure 13: Sensory profiles of the recipes 1, 4, 5 and 6, regarding appearance, aroma, flavour, texture and overall impression, rated from 1 to 5 by 56 panellists. The results are presented in average± standard deviation. ... 30 Figure 14: Representative samples of the traditional Portuguese rice cakes baked according to recipe 1 (A), recipe 4 (B), recipe 5 (C) and recipe (D), under the conditions described in section 3.6. ... 31 Figure 15: Representation of the rejection rates for recipes 1, 4, 5 and 6 upon sensory testing, without the knowledge of the composition of each recipe. The results are presented in percentages. ... 32 Figure 16: Representation of the rejection rates for recipes 1, 4, 5 and 6, upon disclosure of the modification applied to each one. The results are presented in percentages. ... 33
Figure S 1: CO2, H2 and CH4 accumulation after 12h of faecal human microbiota growth from one donor, in a
medium supplemented with either FOS, GOS, GF 1:3, GF 3:1 or GF 1:1 (10g/L). The results presented in relative percentages compared to the control of each experiment, are the average of two independent fermentations and triplicate analysis of each sample. ... 42
x
List of Tables
Table 1: Ingredients and proportions used in the 3 recipes selected for sensory testing. ... 15 Table 2: Ingredients and proportions used in the modified recipes selected for sensory testing. ... 16 Table 3: pH and ammonia concentration after 48h of faecal human microbiota growth from one donor in the absence of prebiotics (control) and in a medium supplemented with one of the following prebiotic mixtures: FOS, GOS, GF 1:3, GF 3:1 or GF 1:1 (10 g/L). The results are the averages of two independent fermentations ± standard deviation. ... 21
xi
List of Abbreviations
GI - GastrointestinalANOVA - Analysis of Variance DNA - Deoxyribonucleic acid DP - Degree of polymerization FOS - Fructooligosaccharides Fru - Fructose
Gal - Galactose GF - GOS and FOS Glc - Glucose
GOS - Galactooligosaccharides
HPLC - High Performance Liquid Chromatography PBS - Phosphate Buffer Saline
rRNA - Ribosomal ribonucleic acid SCFAs - Short Chain Fatty Acids SD - Standard Deviation
xii
Table of Contents
Agradecimentos ... iii
Abstract ... v
Resumo ... vi
List of Figures... viii
List of Tables ... x
List of Abbreviations ... xi
1. Introduction ... 1
1.1. Gut Microbiota ... 1
1.2. Fermentation by gut microbiota ... 2
1.3. Prebiotics: definition and examples... 4
1.4. Prebiotic Potential and Health Benefit ... 7
1.5. Functional Food ... 9
1.5.1 Sensory testing ... 11
2. Project aims ... 12
3. Materials and Methods ... 13
3.1. Materials ... 13
3.2. Faecal human microbiota ... 13
3.3. In vitro batch culture fermentation of oligosaccharides using faecal human microbiota ... 13
3.4. Metabolites analysis ... 14
3.5. Gas production analysis... 14
3.6. Selection of a Portuguese rice cake “bolo-de-arroz” recipe ... 15
3.7. Sugar reduction and prebiotic addition to the rice cake recipe ... 15
3.8. Sensory testing ... 16
3.9. Statistical analysis ... 16
4. Results and Discussion ... 17
4.1. Short-chain fatty acids (SCFAs) production ... 17
4.1.1. Fructooligosaccharides (FOS) ... 17
4.1.2. Galactooligosaccharides (GOS) ... 18
4.1.3. Mixtures of FOS and GOS (GF) ... 19
4.2. pH modification and ammonia accumulation ... 20
4.3. Gas production ... 22
4.3.1. Fructooligosaccharides (FOS) ... 22
xiii
4.3.3. Mixtures of FOS and GOS (GF) ... 24
4.4. Selection of the prebiotic supplementations with higher potential ... 26
4.5. Selection of a recipe of the traditional Portuguese rice cake (“bolo-de-arroz”) ... 28
4.6. Sugar reduction and prebiotic addition to the selected rice cake recipe ... 30
5. General Conclusions and Future Perspectives ... 34
References ... 36
Appendix I – Gas production at 12h ... 42
Appendix II – Sensory test 1 ... 43
Appendix III– Sensory test 2 ... 44
1
1. Introduction
1.1. Gut MicrobiotaThe gastrointestinal (GI) tract is densely populated with microorganisms that modulate metabolic, physiological, nutritional and immunological processes. Throughout its length the diversity and number of microorganisms is variable. The stomach harbours the lowest number of microorganisms, while the distal colon contains the highest with up to 1014 microorganisms from 1100 different species, and a
distribution of at least 160 species per person. The community of microorganisms which colonize the gut is known as gut microbiota. (Power et al. 2014; Valdes et al. 2018).
The distal colon has a pH value close to neutral, the lowest concentration of oxygen in the GI tract and minimal nutrient absorption. Therefore, the maintenance of gut microbiota, among other, is ensured by the characteristics of the proximal intestine, with acidic pH values (∼2-5), high oxygen concentration and constant peristalsis which provides a protective mechanism to the colonization of the gut by exogenous microorganisms (Wexler and Goodman 2017).
The gut microbiota can be thought of as an additional organ since it impacts nutrient absorption, metabolism and disease response. The composition of the gut microbiota is influenced by factors inherent to the host and by external factors. The inherent factors include genetics; age (with a stable composition in adult years); stress; disease; body temperature and composition of the intestinal fluid. On the other hand, the external factors encompass the microorganisms inherited at birth, the use of medication and diet. Diet is an external factor of utmost importance since it determines the type and number of nutrients reaching the large intestine. Changes in the gut microbiota composition have been found to occur in as little as 24 h after an alteration in the diet has been made (Hannah D. Holscher 2017; Sako, Matsumoto, and Tanaka 1999).
The identification of a high diversity of microorganisms colonizing the GI tract has been promoted by DNA-based techniques such as 16S rRNA and whole genome sequencing which also allowed the knowledge of functional characteristics. However, the identification of all species inhabiting the gut is still far due to its high complexity and interindividual diversity (Power et al. 2014). In most healthy adult individuals, the gut microbiota is composed of bacteria belonging to the phylum Firmicutes, which encompasses Gram-positive bacteria of the genera Lactobacillus, Enterococcus, Clostridium, Eubacterium and Ruminococcus, and of Gram-negative bacteria from the phylum Bacteroidetes of which the genera Bacteroides and Prevotella can be highlighted. Methanogenic Archaea, Proteobacteria and
2
Actinobacteria such as Bifidobacterium (Power et al. 2014; Wexler and Goodman 2017) are also found in the gut. It has been established that healthy individuals of the same family will have similar bacterial population in their gut, due to inherited microorganisms (from mother to child), but also due to similar diet patterns, while individuals of different cultures will, most likely have divergent taxa. For example, Europeans’ gut microbiota has an abundance of Firmicutes (≥50%) followed by Bacteroidetes of which Bacteroides is the dominant genera. On the other hand, the Japanese population have the highest incidence of bacteria from the phylum Actinobacteria (Korpela 2018; Wexler and Goodman 2017).
Based on its pathogenic potential, gut microbiota can be organized in three categories: (1) non-pathogenic (e.g. Lactobacillus and Bifidobacterium which are complex carbohydrate-fermenting bacteria), (2) potentially pathogenic, such as some species of clostridia, and (3) commensal bacteria, for example, Bacteroides that can present positive or negative behaviours (Meyer and Stasse-Wolthuis 2009). Therefore, gut microbiota inherently interferes with the host’s health by assisting with digestion, protecting against exogenous microorganisms and regulating metabolism and immunity. In fact, diminished microbial diversity or dysbiosis has been associated with type 1 and type 2 diabetes, obesity and coeliac diseases, while a more complex gut microbiota seems to indicate a healthier gut as it results in resistance to environmental alterations such as the transiently missing species (Valdes et al. 2018).
Bacteria in the gut harbour more than 200 enzymes able to degrade complex carbohydrate linkages making them important to ferment undigested carbohydrates which consequently makes them susceptible to modulation by diet alterations. The modulation via the consumption of non-digestible carbohydrates is a growing field of knowledge which aims to treat and prevent gut related diseases such as colon cancer (Korpela 2018; Sheflin et al. 2017).
1.2. Fermentation by gut microbiota
Gut microbiota ferment undigested dietary substrates that reach the colon to fulfil their biochemical and metabolic requirements. These substrates include resistant starch, oligosaccharides, proteins, amino acids and plant cell wall that the upper GI tract is unable to absorb being degraded by proteolytic or saccharolytic fermentation. Factors that usually influence the dietary carbohydrates’ fermentation are the degree of polymerization (DP), branching and enzymes produced by gut microbiota. Saccharolytic fermentation occurs in the proximal colon where, comparing to the distal colon, there are more fermentable substrates. This fermentation results in the production of short-chain fatty acid (SCFAs). SCFAs are also end-products of proteolytic fermentation which takes place in the distal colon. However,
3
amines and ammonia, which are known to be toxic metabolites, are also produced. (Kolida and Gibson 2007; Power et al. 2014).
SCFAs are carbon-based anions, of which acetate (C2), propionate (C3) and butyrate (C4) make up 95% of the total SCFAs produced in the human gut. Acetate is the most abundant SCFA produced due to the wide distribution of the production pathways amongst several groups of bacteria. This metabolite is essential for the growth of different bacteria but its systemic availability of ∼36%, and ability to cross the blood-brain barrier means acetate can attain peripheral tissues where it can be used for cholesterol metabolism and lipogenesis in the liver. Propionate and butyrate production pathways, as opposed to acetate, are present in a narrower group of bacteria and the production appears to be substrate dependent. Only about 9% of propionate becomes systemically available and can be used for hepatic gluconeogenesis, while the remaining is converted, in the intestine, to glucose via intestinal gluconeogenesis. Butyrate has an estimated systemic availability of about 2%, since it is the preferred energy source for colonocytes and enterocytes. This metabolite is of utmost importance in the maintenance of the hypoxia state in the colon preventing an oxygen imbalance that could lead to dysbiosis (Gill et al. 2018; Hannah D Holscher 2017; Power et al. 2014).
Another fermentation end-product commonly produced by bacteria such as Bifidobacteria and Lactobacilli is lactate. Even though lactate is not considered a SCFAs, it can be converted into SCFAs by different bacteria (e.g. Eubacterium hallii converts lactate into butyrate) due to cross-feeding mechanisms which prevent the excessive acidification of the colon (Flint et al. 2015; Gill et al. 2018; Hannah D. Holscher 2017; Morrison and Preston 2016; Valdes et al. 2018). Due to lactate’s potential as SCFAs precursor, its analysis is relevant to better understand the gut microbiota fermentation of non-digestible food substrates (Vulevic, Rastall, and Gibson 2004). The accumulation of lactate in the distal colon causes acidification resulting in a shift in the composition of the microbiota and their metabolic fingerprint. Louis and collaborators (Louis et al. 2007) reported that decreasing the pH from 6.5 to 5.5 resulted in different SCFAs production profiles caused by shifts in the gut microbiota.
Since the gut microbiota’s modulation is known to influence an individual’s health, multiple in vivo and in vitro studies have been conducted under this topic. These studies include tests on the influence of dietary alterations (increased fibre intake, supplementation with oligosaccharides such as prebiotics) on gut microbiota’s modulation. Lactate and SCFAs evaluation can be performed during an in vitro fermentation of oligosaccharides by analysing the supernatant using high performance liquid chromatography (HPLC). The determination of the overall increase in total lactate and SCFAs is helpful
4
to assess the prebiotic potential of the oligosaccharide under study. The in vitro analysis enables the understanding of the SCFAs produced in comparison to in vivo analysis, since it eliminates the adsorption phenomena occurring in living beings (Coulier et al. 2009).
Hydrogen (H2) and carbon dioxide (CO2) gases are also unavoidable fermentation end-products
produced by gut bacteria such as clostridia and enterobacteria. Some individuals, who harbour methanogenic bacteria such as Methanobrevibacter smithii, can also produce methane (CH4) (Ghoddusi
et al. 2007). The H2 produced may be reused by microbial species in redox reactions during the oxidation
of organic material. CO2 can also be subject to reuse via methanogenesis and acetogenesis. Unlike H2
and CO2, which quantity can be reduced by bacterial metabolism, CH4 is unable to be metabolized any
further and it is expelled with the other gases, causing foul smell (Probert and Gibson 2002).
Gas accumulation in the large intestine is associated with gas distention issues which constitute a clinical disincentive to non-digestible carbohydrate supplementation. These issues may result from the administration of high doses, which highlights the need to determine a recommended daily dose (Gibson et al. 2017). The gas production profiles can be determined using batch fermentation of gut microbiota in response to fermentable carbohydrates.
1.3. Prebiotics: definition and examples
In 1995, prebiotics were defined as “non-digestible food ingredient that beneficially affects the host by selectively stimulating the growth and/or activity of one or a limited number of bacteria already resident in the colon” (Gibson et al. 2017). These bacteria would include bifidobacteria and lactobacilli as preferential targets, since they were extensively studied at the time for their probiotic abilities. In 2004, the same authors updated the definition to “selectively fermented ingredients that allow specific changes, both in composition and/or activity in the gastrointestinal microflora that confers benefits upon host well-being and health” (Gibson et al. 2017). According to this definition, prebiotics were required to fulfil three criteria: (a) resistance to the digestive process, (b) fermentability by gut microbiota and (c) selective stimulation of growth and activity of said microorganisms. In 2010, prebiotics were redefined as “a selectively fermented ingredient that results in specific changes in the composition and/or activity of gastrointestinal microbiota, thus conferring benefit(s) upon host health” (Gibson et al. 2017). This definition accompanied the advances in molecular techniques that allowed a better understanding of the microorganisms comprising the gut microbiota, beyond lactobacilli and bifidobacteria, associated with health benefits.
5
Prebiotics have been recently defined as “a substrate that is selectively utilized by host microorganisms conferring a health benefit” (Gibson et al. 2017). This definition takes into consideration that all microbiologically colonized body sites can benefit from fermentable carbohydrates to improve the composition of the microbiota present by increasing the number of beneficial bacteria. However, when the prebiotic concept was originally introduced by Gibson and Roberfroid, it only considered the effects in the GI tract.
Even though the concept of prebiotic has expanded beyond their application to the GI tract, for the purpose of this dissertation, the term prebiotic will refer only to prebiotic of food grade.
Supplementation with prebiotic is a strategy that promotes the growth of beneficial gut microbiota to restore the normal flora after dysbiosis, for example. It is viable due to the ability of some bacteria to utilize different carbohydrates to obtain energy and thrive. This ability results from the secretion by healthful bacteria of several enzymes, such as hydrolases, glycosyltransferases, polysaccharide lyases, and carbohydrate esterases (Hannah D. Holscher 2017).
Currently, the most well-established prebiotics are inulin-type fructans, such as fructooligosaccharides (FOS), and galactooligosaccharides (GOS) which are substrates that have been regarded as safe, dominating the prebiotic market. Additionally, their prebiotic properties have been recognized, for humans and other animals (e.g. cats and farmed fish), for over 20 years. Both substrates cannot be hydrolysed by digestive enzymes of the upper GI tract, reaching the colon undigested. The prebiotic market is still growing with an expected profit of € 6.743 million by 2023 representing a global growth of 10.4%, with the Asian region presenting the highest expected growth (Amorim et al. 2019; Gibson et al. 2017; Kovács et al. 2013; Mano et al. 2018).
FOS are inulin-type fructans consisting of fructose (Fru) moieties linked to each other through β-(2→1) linkages and to a terminal glucose (Glc) residue by α-linkages. These are the most studied and best implemented prebiotics at the European market and are naturally occurring, although in low quantities, in several biological materials from which they can be extracted including asparagus, sugar beet, agave, honey and Jerusalem artichoke. To fulfil the market’s needs, FOS can be obtained by hydrolysis of inulin or produced via transfructosylation of sucrose (Nobre, Teixeira, and Rodrigues 2015). Inulin-type fructans can differ in the degree of polymerization with inulin varying from 2 to 60 and FOS varying from 2 to 10. Due to its composition FOS are commonly represented as Glc-Frun (n represents
β-6
fructofuranosyl nystose (Glc-Fru4) (Dominguez et al. 2014; Marín-Navarro, Talens-Perales, and Polaina
2015).
Galactooligosaccharides (GOS) are non-digestible oligosaccharides made up of galactose (Gal) moieties linked to each other and linked terminally to a glucose (Glc) residue via β-linkages according to the formula Galn-Glc, with a DP varying from 2 to 8. Similarly to FOS, GOS are considered well-established
prebiotics and are widely used in the food industry. Other oligosaccharides are naturally found in plants such as sugar beet and soya beans. However, the structure of these GOS makes them easily degraded by many bacteria diminishing its specificity. Hence, commercially available GOS are produced via enzymatic transglycosylation of lactose derived from whey, for example, using β-galactosidases from microbial origin which results in GOS with a more complex structure (Kovács et al. 2013; Sangwan et al. 2011; Torres et al. 2010; Wilson and Whelan 2017).
The modulation of the colonic bacteria by prebiotic supplementation results in several health benefits to the GI tract, some of which are represented in Figure 1 (Bali et al. 2015; Kolida and Gibson 2007).
Besides the prebiotic potential, FOS and GOS possess interesting functional properties, such as low sweetness, humectancy and acid stability, thus making them attractive to the functional food industry.
Pathogen inhibition and prevention of infection Growth of probiotic bacteria
Production of beneficial metabolites (SCFAs) and vitamins
Support normal gut functions
Improved bioavailability of essential minerals (Mg2+, Zn2+ and Ca2+)
Reduced antibiotic associated diarrhoea Removal of potentially carcinogenic toxins
7
1.4. Prebiotic Potential and Health Benefit
According to the most recent prebiotic definition, the health benefits linked to the prebiotic activity need to be an outcome of microbiota modulation and metabolism. Moreover, the prebiotic potential must be confirmed on the target host for its designated use (humans and other animals) (Gibson et al. 2017). In order to verify the effectiveness of novel oligosaccharides as prebiotics, experiments to demonstrate that the prebiotic is selectively metabolized by non-pathogenic groups of microorganisms naturally present in the colon is required. These include Bifidobacterium, Eubacterium, Lactobacillus and Roseburia, which increase in number, while reducing the number of potentially pathogenic bacteria, e.g. Escherichia coli. These changes occur because different species of bacteria are, genetically, more capable of using different substrates as energy sources (Gibson et al. 2017; Power et al. 2014). Apart from the adaptability of different microorganisms, the ability to ferment certain oligosaccharides depends on the degree of polymerization and branching, as well as on the glycosidic linkages and synergy between bacteria during fermentation (Al-Sheraji et al. 2013).
To establish the prebiotic potential of a substrate both in vivo and in vitro studies must be carried out. In vitro studies are a cheap and effective screening tool to initially assess the prebiotic potential of different compounds. However, the use of pure cultures, or mixed cultures with a limited number of bacterial genera does not constitute a reliable method to determine the interactions between gut microbiota, as well as their changes in response to prebiotics. Therefore, for a more accurate representation of colonic bacteria, faecal samples should be used as inoculum on batch culture fermentations supplemented with the substrate being tested (Roberfroid 2007). The modulation of gut microbiota and the metabolites’ production profiles should be evaluated to establish if the prebiotic fermentation was selective.
Microbial changes can be assessed by molecular and metagenomic techniques, including next generation 16S rRNA sequencing and whole genome shotgun sequencing (Valdes et al. 2018). 16S rRNA gene sequencing allows taxonomical analysis whether by genus identification or species identification. Genome shotgun sequencing involves the sequencing and the computer assembly of DNA fragments until the information contained in chromosomes is compiled, granting the understanding of the full genetics of different organisms including the genes encoding enzymes (Green 2001; Power et al. 2014; Valdes et al. 2018).
The gut microbiota modulation previously mentioned can occur due to the production of antimicrobial compounds, decrease in luminal pH, competition for nutrients and prebiotics, competitive
8
exclusion, production of growth substrate, production of SCFAs and inherent composition of the host’s microbiota. (Flint et al. 2015).
As previously mentioned, in vivo studies should be conducted afterwards on the intended target host to confirm the suggested health benefits, including benefits to the GI tract (e.g. immune stimulation), on cardiometabolism (e.g. insulin resistance), bones (e.g. mineral bioavailability), among others. These studies must be randomized control trials in order to positively relate changes in health markers/symptoms to the prebiotic at study, and account for interindividual variations on microbiota as a modulator of possible outcomes. From these studies the appropriate dosage to achieve the prebiotic effect while preventing negative side effects such as non-selective utilization, gas accumulation and discomfort or diarrhoea, is expected (Gibson et al. 2017).
Tuohy and collaborators (Tuohy et al. 2001) developed an in vivo double-blind randomize clinical trial (31 participants) to establish the prebiotic effect of biscuits containing FOS. Such experiment revealed that the ingestion of 6g/day of prebiotics, for a controlled period, resulted in the increase of Bifidobacteria in faecal samples, and individuals with lower initial number of Bifidobacteria showed the most significant increase.
Regarding the GI tract and the cardiometabolism, prebiotics have been associated with prevention of bacterial infections, cancer, diabetes and metabolic syndrome (Di Bartolomeo, Startek, and Van den Ende 2012; Genta et al. 2009; Griffin et al. 2003).
Bacterial infection prevention with prebiotics occurs as a result of mucin production and direct immune stimulation. Mucin is one of the main components of the gut epithelium protective mucus layer which forms a gel-like barrier that hinders the colonization by pathogens such as Salmonella spp and Vibrio cholerae. SCFAs production also mediate intestinal epithelial cells defence mechanisms by regulating inflammatory responses. Among the SCFAs, butyrate is the most important for colonic cell’s proliferation and injury repair, since it is the main energy supplier for such cells (Di Bartolomeo et al. 2012).
Colorectal cancer causes thousands of deaths worldwide every year and is associated with wrong dietary habits, among other factors. Prebiotics, via the enhanced production of SCFAs are suggested to neutralize colon carcinogenesis, adjusting tumour cells’ gene expression or reducing the activity of cancer promoting bacteria. The latest can be achieved due to decreased colonic pH that promotes preferential growth of beneficial bacteria to the detriment of pathogenic ones (Di Bartolomeo et al. 2012).
9
Prebiotic consumption can also contribute to the relief of conditions associated to metabolic syndrome. Metabolic syndrome includes ailments such as high blood pressure, obesity, hyperglycaemia and high triglycerides levels, which result in increased risk for cardiovascular diseases and type 2 diabetes. Studies performed in animal models revealed that prebiotic supplementation improved body weight of diabetic rats and increased numbers of Bifidobacteria and Lactobacilli and reduced pH values. Increased SCFAs production resulting from bacterial modulation is known to influence blood glucose and cholesterol levels and lipid metabolism (Di Bartolomeo et al. 2012). Prebiotic supplementation in animal models has been found to modulate gut microbiota and to improve the reduction of body weight, fat and adipocyte size via appetite and food intake modulation, as well as diminished ghrelin production and fatty acid storage. Such supplementation also results in improved gut barrier integrity, glucose tolerance and insulin sensitivity, with similar results attained in human trials. A study performed with oligofructose supplementation during 120 d on obese-dyslipidaemic women revealed reduced body weight, body mass index and low-density lipoprotein cholesterol levels (Genta et al. 2009).
Bone health, among others, is inherently dependent on mineral availability since it is a rigid organ made up of a flexible matrix and minerals such as calcium. Since calcium absorption is mainly gut-regulated, dietary alterations such as the supplementation of prebiotics can improve bone health. Acidic colon pH impairs calcium linkage to negatively charged metabolites increasing mineral absorption which results in increased bone mineralization. Several clinical trials have been conducted on the influence of prebiotic supplementation on mineral absorption, bone health outcomes and intestinal parameters. For example, Van der Heuvel and co-workers (van den Heuvel, Schoterman, and Muijs 2000), in a placebo controlled trial, studied the effect of 20 g/day GOS supplementation, for 5 d, on postmenopausal women and determined a direct increase in calcium absorption. The same pattern was observed in a placebo-controlled study on girls aged 10-15 years after supplementation with 8 g/day of inulin for 3 weeks (Griffin et al. 2003).
1.5. Functional Food
In the past years, food has been seen not only for body nutrition, but also to improve physical well-being and to prevent nutrition related diseases like obesity upon regular consumption. Functional food was described as food which typical appearance and is consumed as part of the daily diet but has demonstrated physiological benefits beyond basic nutrition, of which it can be highlighted the influence on the intestinal microbiota (Sangwan et al. 2011).
10
Functional foods include foods with natural occurring bioactive substances, such as dietary fibre, foodstuffs that have been made functional due to the addition or improvement of the bioavailability of a particular component and derived food ingredients, such as prebiotics. Such food products can be consumed by the general population or can target specific subgroups such as infants, children, women and the elderly (Al-Sheraji et al. 2013; Sangwan et al. 2011).
Prebiotics can be added to dairy products, beverages, baked goods and clinical nutrition with the aim of producing functional foods but also as a fat, sugar and calorie replacement, and to improve the organoleptic properties of said products (Lamsal 2012; Sangwan et al. 2011). FOS and GOS are examples of prebiotics that have been added to a variety of products due to their technological properties since they are low calorie, low sweeteners, hygroscopic, highly soluble, thermo and acid stable and prevent the colouration of foods by Maillard reactions. These properties make FOS and GOS attractive food ingredients to be incorporated on (Dominguez et al. 2014; Nobre et al. 2015; Sangwan et al. 2011; Torres et al. 2010):
− low glycaemic index, low calorie foods, clinical nutrition; − infant nutrition and growing up milk;
− dairy products and beverages (fruit juices); − bakery products;
− frozen foods and meat products; − fruit jams and confectionary products.
Since neither FOS nor GOS have a prominent taste, their addition to food has been highly accepted. Due to their characteristics, prebiotics can be added to dairy products either before or after fermentation, since only a limited number of microorganisms can metabolize them, resulting in smooth and creamy products. In baked goods, since they are heat stable, the addiction of prebiotics allows the incorporation of fibre while maintaining the moisture of low sugar products and preventing browning due to Maillard reactions (Kovács et al. 2013; Nobre et al. 2015; Sangwan et al. 2011).
The market for functional foods and beverages is rapidly growing and is expected to reach €252.079 million worldwide by 2025 (Grand View Research 2019).
11 1.5.1 Sensory testing
The modifications performed to the traditional recipe of a food product, either by incorporating novel components or by changing the amount of specific ingredients, may affect its characteristics and, therefore, its market acceptability. Sensory evaluation methods, developed by sensory science, can be used to analyse differences between product’s characteristics. Sensory science has been described as: “a scientific method used to evoke, measure, analyse and interpret those responses to products perceived through the senses of sight, smell, touch, taste and hearing”(Lawless and Heymann 2010). Appearance, aroma, taste and texture are examples of the properties usually evaluated by a group of panellists when analysing food products. The panellists can be experts, trained panellists or consumers, depending on the sensory testing being used (Teixeira 2009; Yang and Lee 2019).
Sensory evaluation relies on two types of methods: (1) analytical, which includes discriminatory, and descriptive methods and (2) hedonic. Quantitative descriptive analysis aims to provide descriptions of products based on the perception of a group of trained panellists and can result to compare, for example, physical and chemical analysis, products formulations and preferences. Hedonic methods rely on consumers as members of the group of panellists. These methods often use acceptance tests applying scales to translate consumer’s opinion (e.g. scale 1-7, with 1 meaning very bad and 7 meaning excellent) (Canavari et al. 2009; Teixeira 2009).
12
2. Project aims
Due to an increased consumers’ awareness and interest on healthy lifestyle, there are more products available marketed as low calorie and functional food. However, the pastry industry does not offer healthy options for consumers with dietary restrictions due to medical conditions or consumers who follow the healthy lifestyle or trend. Thereby, novel pastry products containing functional ingredients and sugar reduction would improve the industry’s competitiveness in the current market.
This thesis aimed to incorporate functional ingredients into a traditional Portuguese cake, resulting in a healthier option to the current pastry options available. The specific goals were:
− In vitro determination of the prebiotic potential of different mixtures of commercial oligosaccharides;
− Selection and optimization of a traditional Portuguese rice cake recipe;
− Incorporation of the oligosaccharide mixture with the best prebiotic potential in the selected Portuguese rice cake recipe while reducing the refined sugar content;
13
3. Materials and Methods
3.1. MaterialsFOS from agave inulin was purchased from Entelees (Mexico) and GNC Prebiotic GOS from
GNC (USA). All chemicals and media components were of analytical grade and obtained from
Sigma-Aldrich Chemical LTD.
3.2. Faecal human microbiota
Faecal microbiota samples were collected from one healthy human volunteer who did not present any metabolic or gastrointestinal diseases and who did not take any antibiotics, pre- or probiotic supplements for 3 months prior to the study, as well as during the study. The female volunteer, aged 23 was a non-smoker who consumed a non-specific Mediterranean diet. Each sample was collected on site, diluted to a final concentration of 10% (w/w) in phosphate-buffered saline (PBS), 0.1M, pH 7.0, and kept at 4 oC overnight, until inoculation (Gannasin et al. 2015).
3.3.
In vitro
batch culture fermentation of oligosaccharides using faecal human microbiotaStatic batch culture fermentations were performed during 48h at 37 oC, in anaerobic culture
bottles (70mL) sealed with a rubber stopper and a metal cap. The culture bottles were filled with 31.6 mL of growth medium (2 g/L peptone water, 2 g/L yeast extract, 0.1 g/L NaCl, 0.04 g/L K2HPO4, 0.01
g/L MgSO4.7H2O, 0.01 g/L CaCl2.6H2O, 2 g/L NaHCO3, 14.8 mL/L Tween-80, 0.05 g/L haemin, 74.1
μL/L vitamin K1, 0.5 g/L L-cysteine HCl, 0.5 g/L bile salts, 0.001 g/L resazurin (oxygen indicator) and Na2S 0.1 M (oxygen reducer)). The solutions of prebiotics GOS, FOS and mixtures composed of GOS and
FOS in proportions of 1:1, 3:1 and 1:3 were added when required at a final concentration of 10 g/L (4 mL).
With the exception of the filter-sterilized solution of vitamin K1, the medium and the oligosaccharides solutions were sterilized by autoclave (121 oC, 1 atm for 20 min). Each sterilized
medium-filled bottle was inoculated with 4.4 mL of faecal human microbiota previously prepared (section 3.2)
Anaerobic conditions were attained by sparging the bottles with oxygen-free nitrogen gas using a manifold equipment, performing 2 injections of 8 cycles each and reaching a final pressure of 1.6 atm.
14
Medium samples (1 mL) were collected at different time points (0, 12, 24, 36 and 48h) and, centrifuged at 4000 x g for 10 min. The supernatant was further used for HPLC analysis (section 3.4). Headspace samples (0.5 mL) were collected at different time points (12, 24, 36, 48h) and used to determine the gas production profile (section 3.5).
The pH was measured at 48h using a pH electrode and the fermentation broth was drawn from the bottles, centrifuged, washed and resuspended in PBS (0.1 M pH 7.0) and stored at 4oC for future
DNA sequencing analysis (assays to be conducted after this project completion).
Fermentations were run in duplicates using a negative control with no added prebiotics.
3.4. Metabolites analysis
The production of SCFA (acetate, propionate and butyrate) and lactate were analysed using an HPLC fitted with a Jasco-RI detector, a Knauer UV detector and an Aminex HPX 87H column (300 mm x 7.8; Biorad, USA). A 40 μL volume of the supernatant sample was eluted using 5 mM H2SO4 as the mobile
phase, at a flow rate of 0.7 mL/min and a temperature of 60 oC.
Ammonia concentration was determined using an enzymatic kit (LCK 304) from Hach Lange (Düsseldorf, Germany).
3.5. Gas production analysis
Gaseous samples were analysed via gas chromatography (GC) using a Bruker Scion 456-GC (Billerica, MA, USA) equipped with a thermal conductivity detector and two columns: a BR-QPLOT column (30 m length, 0.53 mm internal diameter; film thickness, 20 μm) and a Molsieve packed column (30 x 80/100, 2 m length, 2.1 mm internal diameter). The Molsieve column allowed the measurement of H2
and CH4, using argon as the carrier gas, and the BR-QPLOT column allowed the measurement of CO2, at
a set flow rate of 30 mL/min. The temperatures in the injector, column and detector were 100, 35 and 130 oC, respectively (Arantes et al. 2017).
15
3.6. Selection of a Portuguese rice cake “bolo-de-arroz” recipe
A preliminary search in Portuguese rice cakes recipes online and in culinary books revealed the existence of wide variety of recipes. Therefore, three recipes containing the same ingredients in different proportions, except for milk, were selected (Table 1).
Table 1: Ingredients and proportions used in the 3 recipes selected for sensory testing.
Recipe 1 Recipe 2 Recipe 3
Ingredients % Sugar 23.4 23 22.6 Butter 9.4 15.3 12.7 Eggs 19.1 23.4 27.7 Milk 14 6.9 - Wheat flour 28 15.3 9 Rice flour 5.6 15.3 27.1 Baking soda 0.5 0.8 0.9
Cakes from each recipe were baked at 150 oC for 20 min and left to cool overnight at room
temperature (20-25 oC) prior to the sensory testing (section 3.8).
3.7. Sugar reduction and prebiotic addition to the rice cake recipe
New cakes were produced based on the selected recipe (section 4.6), with two modifications: 1. 25% sugar reduction (recipe 4);
2. 25% sugar reduction and supplementation with 1 % of the selected prebiotic or prebiotic mixtures (section 4.4) (recipe 5).
Cakes from the original and modified recipes were prepared as described in section 3.6. The ingredients for the modified recipes are presented in Table 2.
The addition of 1% of prebiotic mixture took into account the recommended daily dose provided by the manufacturer, assume that an individual would consume up to 3 cakes a day.
16
Table 2: Ingredients and proportions used in the modified recipes selected for sensory testing.
Recipe 4 Recipe 5 Ingredients % Sugar 18.63 18.48 Butter 9.94 9.85 Eggs 20.27 20.10 Milk 14.90 14.78 Wheat flour 29.81 29.56 Rice flour 5.96 5.91 Baking soda 0.50 0.49 Prebiotic - 0.81 Contaminants - 0.72 3.8. Sensory testing
The samples baked according to the recipes described in sections 3.6 and 3.7 were evaluated using acceptance hedonic sensory tests.
In section 3.6 untrained panellists were asked to evaluate appearance, aroma, taste, texture and overall impression of each sample using a hedonic scale with 5 levels: 1 distaste, 2 dislike, 3 neither like nor dislike, 4 like and 5 like very much. The panellists were also asked to indicate which of the samples best resembled a traditional Portuguese rice cake (Appendix II).
In section 3.7 untrained panellists were asked to evaluate appearance, aroma, taste, texture and overall impression of each sample using a hedonic scale with 5 levels: 1 distaste, 2 dislike, 3 neither like nor dislike, 4 like and 5 like very much (Sensory test 2, Appendix III). This sensory test (Sensory test 2, Appendix III) and a second sensory test (Sensory test 3, Appendix IV) also assessed the acceptability of the different recipes before and after the recipe disclaim (Appendix IV).
3.9. Statistical analysis
Results are presented as mean values ± standard deviation (SD). The statistical significance of differences was evaluated by two-way ANOVA test (p<0.05) using the software GraphPad Prism version 6.
17
4. Results and Discussion
The in vitro fermentations were performed with human faecal inoculum to assess and compare the prebiotic potential of commercially available prebiotics, FOS (inulin) and GOS individually and in different mixtures. Both FOS and GOS are well-establish prebiotics with a wide variety of applications for humans and animals (Gibson et al. 2017).
The prebiotic potential was determined through the evaluation of lactate, SCFAs, gas and ammonia production, as well as pH variation.
4.1. Short-chain fatty acids (SCFAs) production
The fermentation of prebiotic oligosaccharides by human gut microbiota results in the production of lactate and SCFAs, such as acetate, propionate and butyrate, among other metabolites (Gill et al. 2018). The production of lactate and the SCFAs was analysed via HPLC for samples taken every 12h from fermentations supplemented with FOS (section 4.1.1.), GOS (section 4.1.2) and mixtures of GOS and FOS in different proportions, namely 1:3, 3:1 and 1:1 (section 4.1.3). The results of each assay are presented below and discussed in detail in section 4.1.3.
4.1.1. Fructooligosaccharides (FOS)
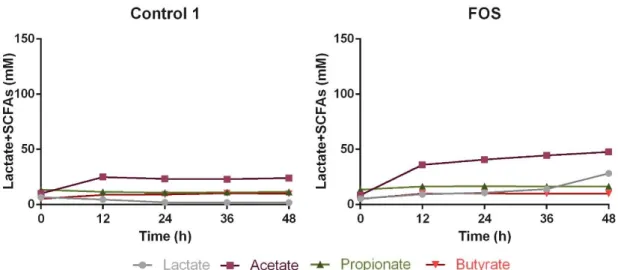
The production of lactate and SCFAs obtained from the fermentation supplemented with FOS is illustrated in Figure 2 together with the negative control fermentation (control 1, no prebiotic addition).
The results showed a significant increase in the accumulation of acetate after 48h (24.00±0.06 mM for control 1 and 47.72±1.75 mM for FOS, p<0.0001) and lactate (1.77±0.01 mM for control 1 and 28.29±0.15 mM for FOS, p<0.0001) for prebiotic supplementation, corresponding to a 99±7% and 1498±8% increase, respectively, when compared to the control fermentation. Propionate showed less statistically significant changes throughout the fermentation period (11.49±1.03 mM for Control 1 and 16.58±1.31 mM for FOS at 48h, p<0.05), with an increase of 44±11% relative to the control. The final accumulation of butyrate for the different conditions revealed no significant variations.
18
4.1.2. Galactooligosaccharides (GOS)
The results obtained for the production of lactate and SCFAs from the fermentation supplemented with GOS and the negative control (no prebiotic addition) are presented in Figure 3.
The GOS supplementation resulted in a higher accumulation of acetate (20.96±0.66 mM for control 2 and 125.10±19.62 mM for GOS, p<0.0001) when compared to the control, corresponding to a 496±93% increase. The production of lactate was also observed in a total amount of (53.94±10.12
Figure 2: Lactate and SCFAs’ production during a period of 48h of faecal human microbiota growth from one donor, in the absence of prebiotics (Control) and in a medium supplemented with a prebiotic solution of 10g/L FOS. The results are the average of two independent fermentations ± standard deviation.
Figure 3: Lactate and SCFAs’ production during a period of 48h of faecal human microbiota growth from one donor, in the absence of prebiotics (Control) and in a medium supplemented with a prebiotic solution of 10g/L GOS. The results are the average of two independent fermentations ± standard deviation.
19
mM, p<0.0001). Similarly to FOS, in the control fermentation the consumption of lactate leading to a null accumulation after 48h was observed. The differences of the final concentration of propionate and butyrate were also statistically significant when compared to the control. The final concentration propionate increased in comparison with the control by 230±93% (5.49±0.30 mM for control 2 and 18.09±5.08 mM for GOS, p<0.001) while the concentration of butyrate decreased by 77±10% (13.80±0.089 mM for control 2 and 3.05±1.41 mM for GOS, p<0.0001).
4.1.3. Mixtures of FOS and GOS (GF)
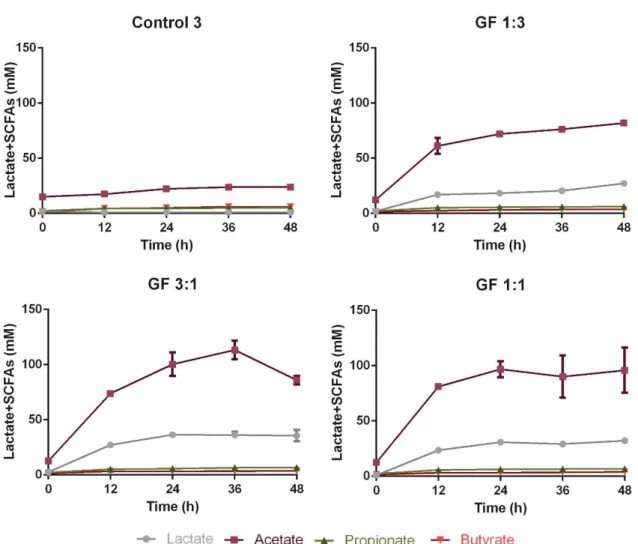
The supplementation with different GOS and FOS mixtures resulted in different lactate and SCFA production profiles, as shown in Figure 4.
Figure 4: Lactate and SCFAs’ production during a period of 48h of faecal human microbiota growth from one donor, in the absence of prebiotics (Control 3) and in a medium supplemented with a prebiotic solution of 10g/L of either GF 1:3, GF 3:1 or GF 1:1. The results are the average of two independent fermentations ± standard deviation.
20
In comparison with the control, the highest lactate accumulation was found for the mixture GF 3:1, with an increase of 3509±520% (0.985 mM for control 3, 35.57±5.12 mM for GF 3:1, p<0.0001) after 48h. However, when compared to the other mixtures the lactate production of GF 3:1 was only significantly higher than GF 1:3 (27.15±0.64 mM for GF 1:3, p<0.001, and 32.13±1.79 mM for GF 1:1, non-significant). In agreement with previous results (section 4.2.1 and 4.2.2), acetate was the major SCFA accumulated after 48h for all mixtures tested, presenting no significant difference amongst the mixtures. Butyrate accumulation slightly increased over time with and without supplementation, however, the final concentrations for each mixture (3.55±0.17 mM for GF 1:3, p<0.01, 3.79±0.17 mM for GF 3:1, p<0.01, and 3.91±0.68 mM for GF 1:1, p<0.01) were lower than the control (5.95±0.51 mM). Furthermore, the propionate accumulation showed no significant differences comparing to the control.
Lactate and SCFAs production profiles presented in sections 4.1.1, 4.1.2 and 4.1.3, showed that acetate was the main SCFAs being produced regardless of the supplementation, followed by the organic acid lactate, with propionate and butyrate being the least SCFAs produced.
Lactate and acetate production were significantly higher in experiments using GOS rather than FOS. Rycroft and co-workers (Rycroft et al. 2001) reported comparable results with increased production of acetate, propionate and lactate resulting from GOS supplementation when compared to inulin, both added at a concentration of 10 g/L.
Since lactate and SCFAs production is related to bacterial metabolism, it is comprehensible that acetate was the most produced metabolite since its production pathways are present in many bacterial groups, while lactate, propionate and butyrate production pathways exhibit a more conserved distribution (Louis et al. 2007; Morrison and Preston 2016). It is also known that FOS and GOS promote the growth of Bifidobacteria which are known to be non-butyrogenic bacteria (Gibson et al. 2017; Louis et al. 2007). The three experiments were carried in three different occasions, with different faecal samples from the same donor, and exhibited the similar lactate and SCFAs production profiles.
4.2. pH modification and ammonia accumulation
As previously discussed, in vitro fermentations also allow a better understanding of ammonia and pH variations comparing to in vivo studies. Even though the culture medium was designed to reproduce the distal colon pH at the baseline, the continuous production and accumulation of SCFAs causes an
21
abrupt decrease in pH which would not occur in vivo due to swift absorption (Macfarlane, Steed, and Macfarlane 2007).
SCFAs accumulation decreases the medium pH, promoting the reduction of pathogenic bacteria and allowing the increase of the population of beneficial bacteria. The shift in microbial population should also lead to alterations in the metabolic pathways, namely the prevalence of saccharolytic fermentation over proteolytic fermentation, which results in the diminished production of ammonia. Ammonia contributes to foul faecal odour and, being a toxic compound, can lead to colon carcinogenesis (Kolida and Gibson 2007; Louis et al. 2007; Power et al. 2014). Table 3 presents the final pH and ammonia concentration after 48h fermentation for the control and the supplemented fermentations.
Table 3: pH and ammonia concentration after 48h of faecal human microbiota growth from one donor in the absence of prebiotics (control) and in a medium supplemented with one of the following prebiotic mixtures: FOS, GOS, GF 1:3, GF 3:1 or GF 1:1 (10 g/L). The results are the averages of two independent fermentations ± standard deviation.
Assay Control Sample p value
FOS pH 7.01±0.03 3.69±0.02 <0.0001 Ammonia (mg/L) 408.98±0.00* 97.75±3.18 <0.0001 GOS pH 6.87±0.04 3.61±0.02 <0.0001 Ammonia (mg/L) 397.49±4.28 73.60±2.40 <0.0001 GF 1:3 pH 7.18±0.06 3.93±0.01 <0.0001 Ammonia (mg/L) 436.0±16.97 78.9±1.98 <0.0001 GF 3:1 pH 7.18±0.06 3.78±0.014 <0.0001 Ammonia (mg/L) 436.0±16.97 47.85±2.05 <0.0001 GF 1:1 pH 7.18±0.06 3.85±0.00* <0.0001 Ammonia (mg/L) 436.0±16.97 61.85±0.64 <0.0001
* Both replicas presented the same experimental measurements, according to the equipment’s precision
22
The results showed a consistent decrease in the pH value of all supplemented cultures, as well as a decrease in ammonia concentration. The highest pH reduction comparing to the control, was achieved by the mixture GF 3:1, with a difference of 3.4. Moreover, the same mixture presented the lowest concentration of ammonia, with a 9-fold reduction in comparison to the control fermentation.
Pompei et al. (2008) reported similar results with a significant decrease of pH value in in vitro static batch fermentations of faecal microbiota supplemented with oligofructose, a well-established prebiotic, in comparison to the control fermentations. These authors also described a lower concentration of ammonia as a result of oligosaccharide supplementation (Pompei et al. 2008).
Moreover, colonic microbiota will favour saccharolytic fermentation over proteolytic fermentation, causing acidification of the proximal colon where it is possible to find non-digested carbohydrates. In the distal colon, where pH is close to neutral, it occurs the majority of proteolytic fermentation due to depletion of fermentable carbohydrates (Korpela 2018). The availability of fermentable carbohydrates and acidic pH resulting from in vitro models, where distal colon conditions are mimicked, promote saccharolytic fermentation and subsequently, the reduction of the ammonia concentration.
4.3. Gas production
The fermentation of prebiotic oligosaccharides by faecal human microbiota can influence the production of gases such as carbon dioxide (CO2), hydrogen (H2) and methane (CH4). CH4 is only produced
in individuals who harbour methanogenic bacteria in their gut microbiota (Ghoddusi et al. 2007). Gas production was analysed by GC of samples taken every 12h during the 48h fermentations supplemented with FOS (section 4.3.1.), GOS (section 4.3.2) and mixtures of GOS and FOS in different proportions, 1:3, 3:1 and 1:1 (section 4.3.3), with a final concentration of 10 g/L. The results of these analysis are presented below and discussed in section 4.3.3.
4.3.1. Fructooligosaccharides (FOS)
Figure 5 presents the CO2, H2 and CH4 production profile during the 48h of fermentation
supplemented with FOS. As expected, larger concentrations of CO2 were obtained when comparing to the
control fermentation with an increase of 85.91 ± 12.12% (6.15 ± 0.30 mmol/L for Control 1 and 11.43 ± 0.75 mmol/L for FOS, p<0.0001). The concentration of CH4 also increased in comparison to the control
23
production, no significant differences were observed comparing to the control fermentation with the supplemented fermentation. Overall, the CO2 production was significantly higher than the other gases
analysed.
4.3.2. Galactooligosaccharides (GOS)
Figure 6 illustrates the CO2, H2 and CH4 production profile during the 48h of fermentation
supplemented with GOS. Similarly to FOS, larger concentrations of CO2 were produced, with the maximum
production occurring after 24h of fermentation (7.54±0.16 mmol/L, p<0.0001), having no significant differences when compared to the 48h, while the CO2 produced in the control fermentation achieved its
maximum at 48h (4.67±0.004 mmol/L, p<0.0001).
CO2 production after 24h resulted in an increase of 151.51 ± 5.47%, comparing to the control,
which decreased to a 67.38 ± 2.96% net difference at the last sample time of 48h. The production of H2
showed no significant alterations throughout the fermentation times comparing to the control fermentation.
Interestingly, the GOS supplementation led to a decrease of 78.76% in the production of CH4
when compared to the control. Furthermore, the supplementation with GOS resulted in no significant alterations in CH4 concentration from 12h to 48h (0.14 ± 0.02 mmol/L and 0.19 ± 0.04 mmol/L,
respectively), while in the control increased amounts of CH4 were produced (0.33±0.04 mmol/L at 12h
and 0.91±0.13 mmol/L at 48h, p<0.0001)
Figure 5: CO2, H2 and CH4 production during a period of 48h of faecal human microbiota growth from one donor,
in the absence of prebiotics (control) and in a medium supplemented with a prebiotic solution of FOS (10g/L). The results are the average of two independent fermentations and triplicate analysis of each sample ± standard deviation.
24
H2 production showed no significant differences as compared to the control fermentation with the
supplemented fermentation.
4.3.3. Mixtures of FOS and GOS (GF)
In accordance with the previous results (section 4.3.1. and 4.3.2.), the supplementation with FOS and GOS mixtures also resulted in a gas production profile with CO2 being the predominant gas
produced regardless of the ratio, as shown in Figure 7. After 48h of fermentation, the highest CO2
production was achieved with GF 3:1 supplementation (9.82±0.16 mmol/L, p<0.0001) when compared to the control fermentation (4.33±0.33 mmol/L), yielding an increase of 126.73 ± 3.77%. Amongst the mixtures, statistical significance only allowed for the distinction between GF 3:1 and GF 1:1, with GF 3:1 being higher than the GF 1:1 (7.41 ± 1.40 mmol/L, p<0.05).
H2 concentrations showed no significant differences after 48h when compared to the control and
amongst the mixtures.
As for CH4, the supplementation with the different mixtures led to significant reductions, when
compared to the control fermentation after 48h (0.781±0.07 mmol/L for control 3, 0.43±0.05 mmol/L for GF 1:3, p<0.05, 0.33±0.02 mmol/L for GF 3:1, p<0.01 and 0.27±0.08 mmol/L for GF 1:1, p<0.01). Even though no significant differences amongst the mixtures were found, there was an overall reduction of 56.26 ± 10.61% when comparing the final concentration of CH4 produced by the supplemented
fermentations to the control fermentation.
Figure 6: CO2, H2 and CH4 production during a period of 48h of faecal human microbiota growth from one donor
in the absence of prebiotics (control) and in a medium supplemented with a prebiotic solution of GOS (10g/L). The results are the average of two independent fermentations and triplicate analysis of each sample ± standard deviation.
25
The gas production profiles presented in sections 4.2.1, 4.2.2 and 4.2.3 relative to the prebiotic supplementation revealed that overall CO2 was the most produced gas, H2 production was not affected by
none of the studied supplementations and CH4 production was significantly reduced in the presence of
GOS supplementation.
The highest total gas production occurred as a result of FOS supplementation while GOS supplementation led to lower overall gas production. Similar results were achieved by Hernot and co-workers (Hernot et al. 2009) and Rycroft and co-co-workers (Rycroft et al. 2001) that compared the effect of different oligosaccharides. Hernot and co-workers, after evaluating the gas production profile of fructans with different chain lengths and DP and other oligosaccharides, such as GOS, concluded that due to its branched structure, agave inulin was more rapidly fermented yielding the highest amounts of gas, while GOS yielded more moderate gas production (Hernot et al. 2009). Similarly, in the results reported by
Figure 7:CO2, H2 and CH4 production during a period of 48h of faecal human microbiota growth from one donor
in the absence of prebiotics (control) and in a medium supplemented with a prebiotic solution 10g/L of either GF 1:3, GF 3:1 or GF 1:1. The results are the average of two independent fermentations and triplicate analysis of each sample ± standard deviation.
26
Rycroft and co-workers, the gas production profiles obtained revealed that FOS and inulin produced the highest amounts of total gas, while GOS resulted in the lowest production. GOS are considered more competent in increasing number of Bifidobacteria than FOS, which could explain the differences found here in gas production, since these bacteria usually generate lower gas volumes.
As mentioned in section 1.3, only some individuals harbour methanogenic bacteria in their gut microbiota. Elevated CH4 production has been associated with obesity, colorectal cancer, irritable bowel
syndrome and chronic constipation. In fact, said gas has been shown to reduce intestinal transit time by 59% (Gaci et al. 2014; Lurie-Weinberger and Gophna 2015). Therefore, further studies on the ability of GOS and GF mixtures to reduce methane production should be carried out.
The three experiments herein performed were carried in three different occasions, with different faecal samples from the same donor, and exhibited the similar gas production profiles.
4.4. Selection of the prebiotic supplementations with higher potential
To select the supplementations with higher prebiotic potential, lactate, SCFA, ammonia and gas production were used as criteria.
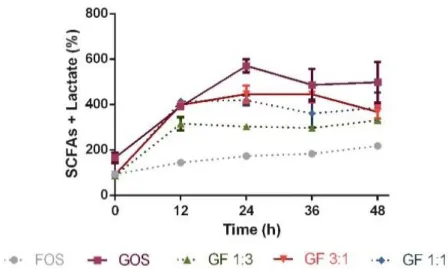
Figure 8 presents the concentration of lactate and total SCFAs overtime in relative percentages compared to the control. The fermentations supplemented with GOS, GF 1:3, GF 3:1 or GF 1:1 showed an increased production of lactate and SCFA at an early time point (12h), having reached maximum values at 24h (570.51 ± 29.02% for GOS, 302.89 ± 6.12% for GF 1:3, 445.72 ± 37.31% for GF 3:1 and 418.97 ± 21.84% for GF 1:1). The supplementation with FOS resulted in non-significant changes in lactate and SCFA production overtime, thus being considered as less promising. The production at 24h with single GOS supplementation was higher than with GF mixtures (p<0.0001 when compared with GF 1:3, p<0.01 when compared with GF 3:1 and GF 1:1). Concerning the mixture supplementation, GF 3:1 showed the highest production (444.67±35.17% at 36h). However, it was only significantly higher when compared to GF 1:3 (296.38±9.75% for GF 1:3, p<0.01, 360.60±60.61% for GF 1:1, non-significant).
The production of lactate and SCFA led to a significant acidification of all culture media regardless of the supplementation.