1. Department of Biomedical Engineering, College of Electronic and Information Engineering, Xi’an Technological University
Keywords: Bioinformatics analysis; Rheumatoid
arthri-tis; Network module; Enrichment analysis
IntroductIon
Rheumatoid arthritis (RA) is a chronic autoimmune di
-sease characterized by inflammation and damage or
des truction of the joints, which can produce a loss of
functionality, reduces quality of life and enhances
mor-bidity and mortality
1. RA affects about 24.5 million
people as of 2015. This is between 0.5 and 1% of adults
in the developed world, with 5 and 50 per 100,000
people newly developing the condition each year
2.
While the cause of RA is not clear, it is believed to
in-volve a combination of genetic and environmental
fac-tors. The underlying mechanism involves the body’s
immune system and inflammation of joints and results
in inflammation and thickening of the synovium. It also
affects the underlying cartilage and bone. Modern stu
-dies have enumerated a positive involvement of
in-flammatory mechanism through synovial cellular
infil-trate, as well as peripheral blood inflammatory cells
3.
Polymorphonuclear neutrophils and lymphocytes play
a pivotal role in synovial inflammation and joint dama
-ge. Moreover, genome-wide analyses have verified that
immune regulatory factors underlie the disease
4.
The main goal of RA treatment is to stop
inflammation, relieve symptoms, prevent joint and organ dama
-ge, improve physical function and reduce long-term
complications
1. The treatment of RA was fully unsolved
over the past decade, with the increased number of
efficacious agents and the development of novel
treat-ment strategies
1. Unfortunately, all of the agents only
ameliorated symptoms and failed to cure the di sease.
Results from many clinical studies conducted to date
have shown benefits and in all cases mentioned signi
-ficant effect on appropriate biological targets
5. Thus,
development of new therapies enables better diagno sis
and treatment of chronic diseases using genetic or
bio-Identification of key genes and pathways in Rheumatoid
Arthritis gene expression profile by bioinformatics
Lu W1, Li G1
ACTA REUMATOL PORT. 2018;43:109-131
AbstrAct
Objective: The aim of this study was to identify
po-tential key candidate genes and uncover their popo-tential
mechanisms in rheumatoid arthritis.
Materials and methods: The gene expression profiles
of GSE12021, GSE55457, GSE55584 and GSE55235
were downloaded from the gene expression omnibus
database, including 45 rheumatoid arthritis and 29
nor-mal samples. The differentially expressed genes
be-tween the two types of samples were identified with the
Linear Models for Microarray Analysis package using R
language. The gene ontology functional and pathway
enrichment analyses of differentially-expressed genes
were performed using the database for annotation,
vi-sualization and integrated discovery software followed
by the construction of a protein–protein interaction
network. In addition, hub gene identification and gene
ontology functional and pathway enrichment analyses
of the modules were performed.
Results: The differentially expressed genes were
mainly involved in immune response, inflammatory res
-ponse, chemokine-mediated signaling pathway for
rheumatoid arthritis patients. The top hub genes such
as interleukin 6, jun proto-oncogene, chemokine
re-ceptor 5 and epidermal growth factor rere-ceptor, were
identified from the protein–protein interaction
net-work. Sub-networks revealed hub genes were involved
in significant pathways, including chemokine
signal-ing pathway, cytokine-cytokine receptor interaction,
tumor necrosis factor signaling pathway. The seed node
gene is tolllike receptor 7 and growth arrest and deoxy
ribonucleicacid damageinducible beta, in the mo
-del-1 and model-2 by module analysis, respectively.
Conclusion: These hub genes may be used as
poten-tial targets for rheumatoid arthritis diagnosis and
treat-ment.
logical approaches. Microarrays are one of the
high-throughput platforms for analysis of gene expression
and served as key tools in medical oncology with great
clinical applications, such as molecular diagno sis and
classification of diseases. In the last decade, a large
number of gene expression profiling researches on RA
have been reported by microarray technology and
re-vealed many differentially expressed genes (DEGs)
in-volved in different pathways, biologi cal processes, or
molecular functions
6,7. Comparative analysis of the
DEGs in independent studies shows a relatively
limit-ed degree of overlap, and no reliable biomarker
pro-file discriminating inflamed from normal tissue has
been identified. However, the integra ted
bioinformat-ics methods combining with expression profiling
tech-niques will be innovative and might solve the
disad-vantages.
This study used microarray gene expression profile
to identify biomarkers and pathways involved in RA.
On the basis of analyzing their biological functions and
pathways, we may show the further insight of RA
de-velopment at molecular level and explored the
poten-tial candidate biomarkers for diagnosis, prognosis, and
drug targets.
mAterIAls And metHods
mIcroArrAy dAtA
The gene expression profiles were downloaded from
the gene expression omnibus (GEO) database. Four
GEO series (GSE) were used in our study, which was
GSE12021, GSE55457, GSE55584 and GSE55235,
res pectively. Criteria for selecting the data sets were
se-lected as follows: (1) the GEO platform (GPL) is GPL96
(Affymetrix Human Genome U133A Array); (2) the
number of samples is greater than 10; (3) the samples
are from synovial membrane patients. They were based
on the GEO platform 96 (Affymetrix Human Genome
U133A Array). The dataset of GSE12021 included
syno vial membrane samples of 12 RA patients and 9
normal controls
8. The dataset of GSE55457 included
synovial membrane samples of 13 RA patients and 10
normal controls
9. The dataset of GSE55584 included
synovial membrane samples of 10 RA patients
9. The
dataset of GSE55235 included synovial membrane
samples of 10 RA patients and 10 normal controls
9.
These 4 datasets were chosen for integrated analysis
in this study including 45 RA samples and 29 normal
samples.
dAtA preprocessIng And degs screenIng
The raw data was preprocessed by Affy package (R/
/Bioconductor) of R language following the three steps:
background adjustment, quantile normalization, loga
-rithmic transformation and finally summarization
10.
Then the expression matrix with probe level was
trans-formed to matrix with gene level based on annotation
files. Multiple Linear Regression limma was applied
for DEGs analysis
11. The ComBat function of sva
pack-age was used to remove known batch effects from
mi-croarray data
12. Similarly, the DEGs of each series was
analyzed by the same method without sva package.
GSE55584 did not include normal samples, and the
DEGs of it was unable to analyze. The degree of
overlap of DEGs between them was showed with venn dia
-gram using VennDia-gram package of R language.
Vol-cano plot was used to display both average fold change
and p-value, which was generated by using ggplots
package of R language. DEGs were identified with
clas-sical t test, statistically significant DEGs were defined
with p<0.01 and log2-fold change (log2FC) > 1 as the
cut-off criterion.
HIerArcHIcAl clusterIng AnAlysIs
After extracting the expression values from the gene
expression profile, a bidirectional hierarchical
cluster-ing heatmap was constructed uscluster-ing gplots package of
R language.
FunctIonAl And pAtHwAy enrIcHment
AnAlysIs
The database for Annotation, Visualization and
Integrated Discovery (DAVID) was used to classify signi
-ficant DEGs by their biological processes, molecular
functions, or cellular components using gene
ontolo-gy consortium reference (GO) and the significant
trans cripts (Benjamini-Hochberg false discovery rate
<0.05) were identified using the Functional
Annota-tion clustering tool
13. The DAVID database was also
used to perform pathway enrichment analysis with re
-fe rence from kyoto encyclopedia of genes and genomes
(KEGG) database website and Benjamini-Hochberg
false discovery rate (FDR) <0.05 as a cut-off point.
proteIn–proteIn InterActIon network
constructIon And module AnAlysIs
In the construction of the protein–protein interaction
(PPI) networks, the search tool for the retrieval of
in-teracting genes (STRING) version 10.5 (http://www.
string-db.org/) was used
14. This is a web biological
database for prediction of known and unknown protein
interaction relationships. The DEGs with required
con-fidence (combined score) >0.4 were selected, and then
the PPI network was constructed and visualized using
cytoscape software version 3.5.0
15. The plug-in
molecu lar complex detection (MCODE) was used to
screen the modules of PPI network in cytoscape
16. The
criteria were set as follows: MCODE scores>5 and
num-ber of nodes>5. Moreover, the function and pathway
enrichment analysis were performed for DEGs in the
modules. p<0.05 was considered to have significant
differences.
results
IdentIFIcAtIon oF degs
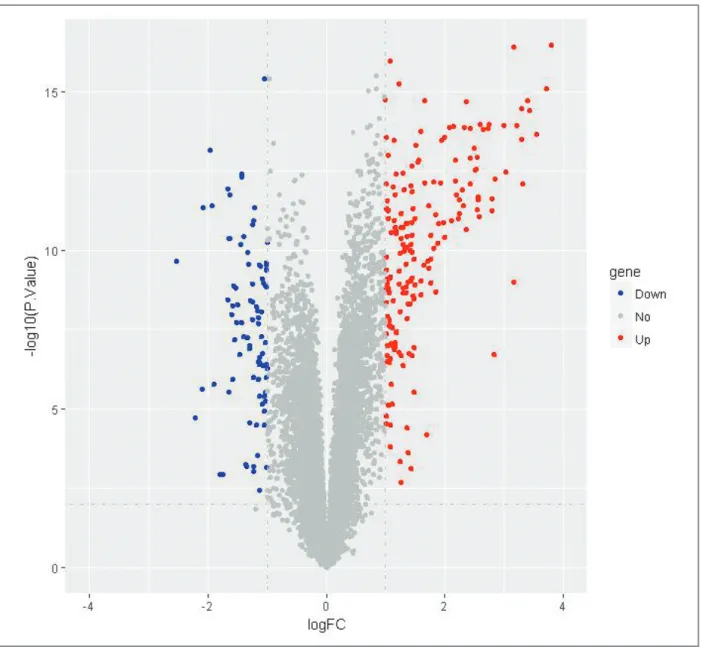
Using p<0.01 and |logFC|>1 as cut-off criterion, a
to-tal of 229 DEGs were identified from the four profile
datasets including 145 up-regulated genes and 84
down-regulated genes in the RA samples compared to
normal samples (supplementary file Table I – online
only), which was showed by volcano plot (Figure 1).
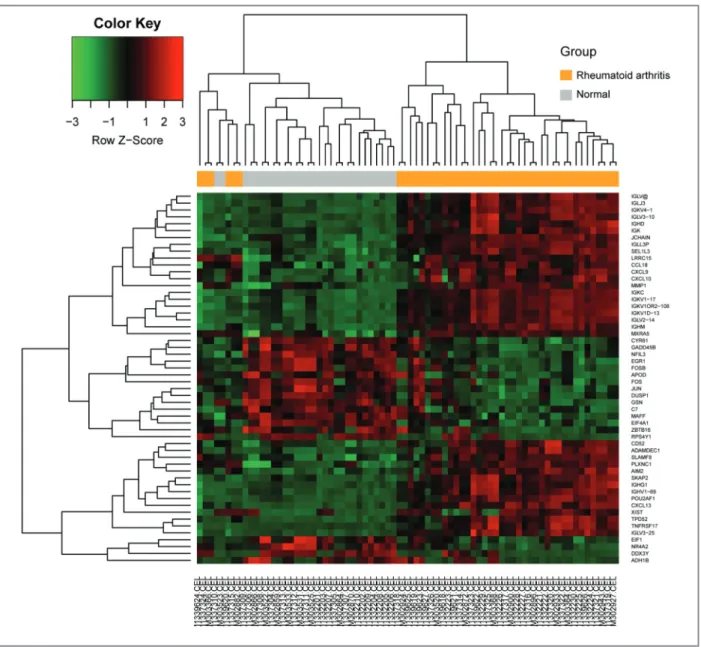
The gene expression values were extracted and a hie
-rarchical clustering heat map was plotted to present the
DEGs (Figure 2). After integrated bioinformatical ana
-FIgure 1. Volcano plot showing all the genes expression change in rheumatoid arthritis compared to the normal samples. Grey represents no change in expression, blue represents down-regulation, and red represents up-regulation.
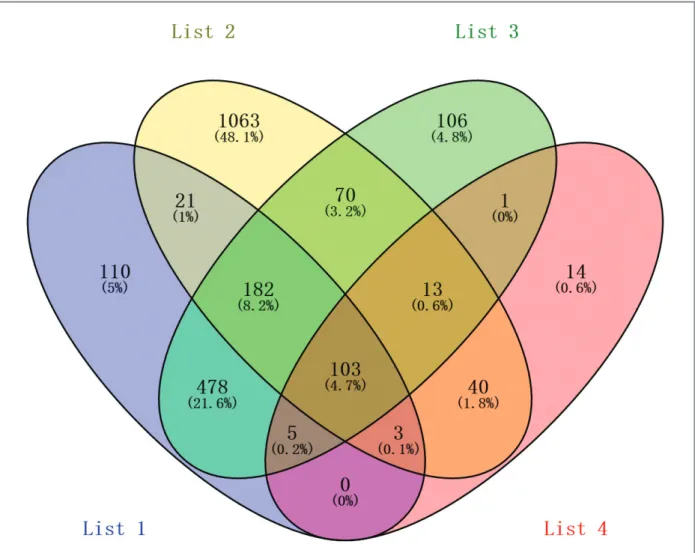
ly sis, total of 103 consistently expressed genes were
identified from the four parts data (Figure 3), inclu
-ding 74 up-regulated genes and 29 down-regulated
genes in the synovial tissue from rheumatoid arthritis
joint, compared to the normal tissue.
go FunctIonAl And pAtHwAy enrIcHment
AnAlysIs
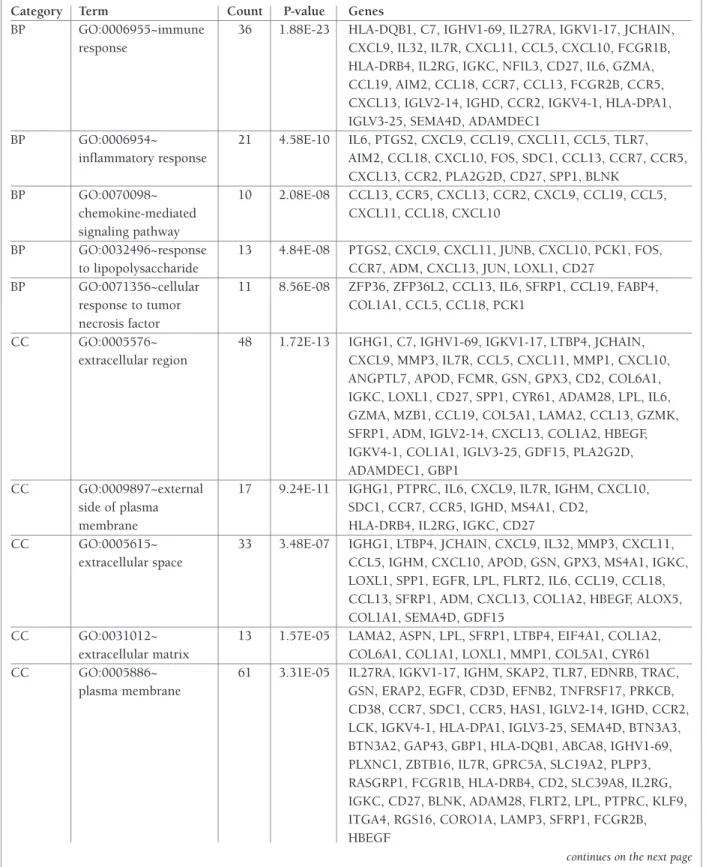
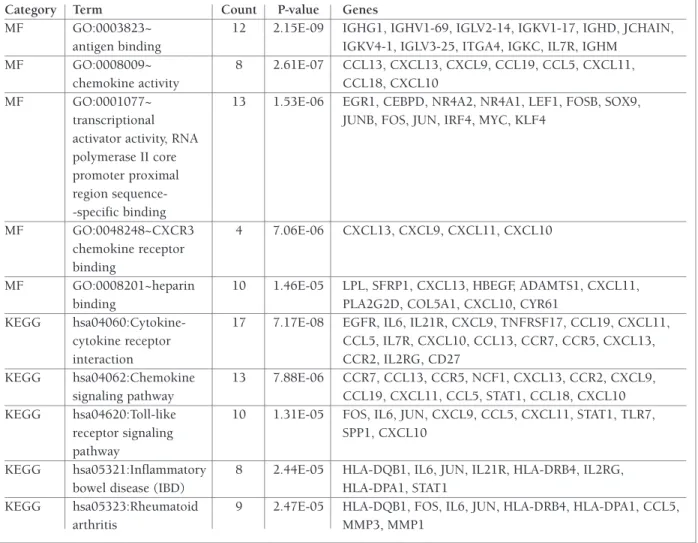
GO analysis results showed that the DEGs were signifi
-cantly enriched in biological processes including
immu ne response, inflammatory response,
chemokine-me diated signaling pathway, response to
lipopolysac-charide and cellular response to tumor necrosis factor.
For cell component, the DEGs were significantly
en-riched in extracellular region, external side of plasma
membrane, extracellular space, extracellular matrix,
and so on. In addition, GO analysis also displayed that
the DEGs were significantly enriched in antigen bin
-ding, chemokine activity and transcriptional activator
activity for molecular function (Table I).
KEGG signaling pathway analysis results showed that
the DEGs were significantly enriched in
cytokine-cy-FIgure 2. Heat map showing up-regulated and down-regulated differentially expressed genes in rheumatoid arthritis compared to the normal samples. The expression values are log2 fold changes (>1 or <−1) between normal tissues and rheumatoid arthritis samples. Green represents down-regulation and red represents up-regulation
tokine receptor interaction, chemokine signaling
path-way, toll-like receptor signaling pathpath-way, inflammatory
bowel disease, and rheumatoid arthritis (Table I).
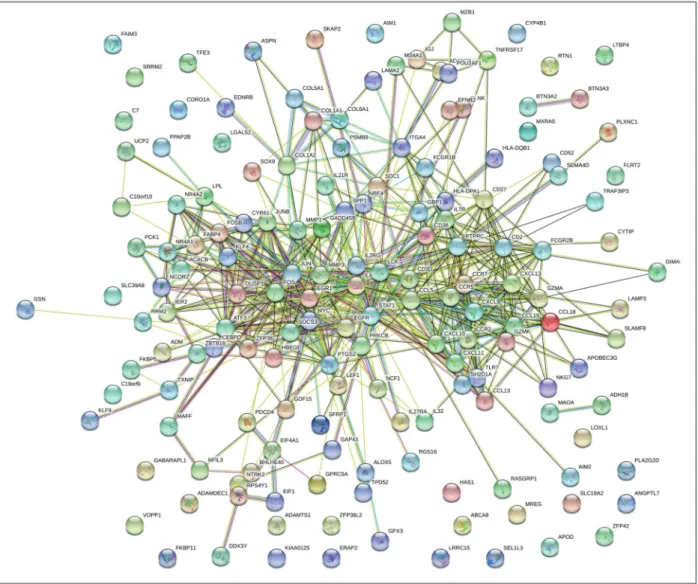
ppI network constructIon And Hub gene
IdentIFIcAtIon
Based on the information in the STRING database, PPI
relationships were obtained and the hub genes or
pro-teins in the networks with connectivity degree >10
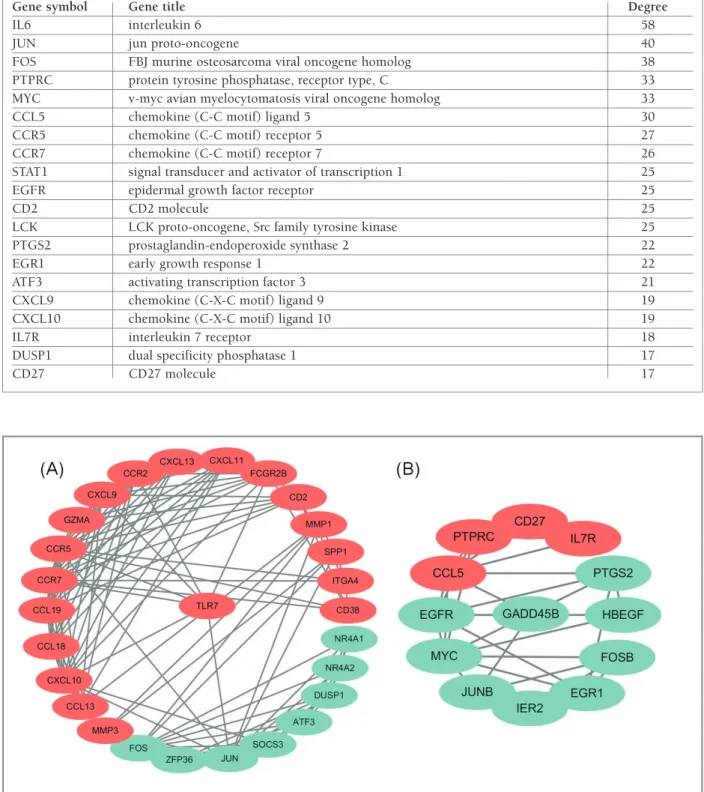
were identified (Figure 4). The top 20 hub nodes with
higher degrees were screened (Table II). These hub
genes included interleukin 6 (IL6), jun proto-oncogene
(JUN), finkel–biskis–jinkins (FBJ) murine
osteosarco-ma viral oncogene homolog (FOS), protein tyrosine
phosphatase receptor type C (PTPRC), v-myc avian
myelocytomatosis viral oncogene homolog (MYC),
chemokine (C-C motif) ligand 5 (CCL5), and so on.
Among these genes, IL6 showed the highest node
de-gree, which was 58.
module AnAlysIs
Two modules with MCODE scores>5 and nodes>5
were selected in the PPI networks. Cluster-1 (MCODE
scores=8.5) was with 27 nodes and 111 edges, and the
seed node was toll-like receptor 7 (TLR7) which was
up-regulated expression. Cluster-2 (MCODE scores=5)
was with 13 nodes and 30 edges, and the seed node was
GADD45B which was downregulated expression (Fi
-gure 5). In addition, the KEGG pathway analysis
revealed that the hub genes in modules were significan
-FIgure 3. Identification of 103 commonly changes differentially expressed genes from the four parts data (List 1: GSE12021; List 2: GSE55235; List 3: GSE55457; List 4: 229 differentially expressed genes by integrating analysis of GSE12021, GSE55235, GSE55457, GSE55584). Different color areas represented different parts.
tAble I. gene ontology And pAtHwAy enrIcHment AnAlysIs oF dIFFerentIAlly expressed genes FunctIon In rHeumAtoId ArtHrItIs (top 5 In eAcH cAtegory)
Category Term Count P-value Genes
BP GO:0006955~immune 36 1.88E-23 HLA-DQB1, C7, IGHV1-69, IL27RA, IGKV1-17, JCHAIN, response CXCL9, IL32, IL7R, CXCL11, CCL5, CXCL10, FCGR1B,
HLA-DRB4, IL2RG, IGKC, NFIL3, CD27, IL6, GZMA, CCL19, AIM2, CCL18, CCR7, CCL13, FCGR2B, CCR5, CXCL13, IGLV2-14, IGHD, CCR2, IGKV4-1, HLA-DPA1, IGLV3-25, SEMA4D, ADAMDEC1
BP GO:0006954~ 21 4.58E-10 IL6, PTGS2, CXCL9, CCL19, CXCL11, CCL5, TLR7, inflammatory response AIM2, CCL18, CXCL10, FOS, SDC1, CCL13, CCR7, CCR5,
CXCL13, CCR2, PLA2G2D, CD27, SPP1, BLNK BP GO:0070098~ 10 2.08E-08 CCL13, CCR5, CXCL13, CCR2, CXCL9, CCL19, CCL5,
chemokine-mediated CXCL11, CCL18, CXCL10 signaling pathway
BP GO:0032496~response 13 4.84E-08 PTGS2, CXCL9, CXCL11, JUNB, CXCL10, PCK1, FOS, to lipopolysaccharide CCR7, ADM, CXCL13, JUN, LOXL1, CD27
BP GO:0071356~cellular 11 8.56E-08 ZFP36, ZFP36L2, CCL13, IL6, SFRP1, CCL19, FABP4, response to tumor COL1A1, CCL5, CCL18, PCK1
necrosis factor
CC GO:0005576~ 48 1.72E-13 IGHG1, C7, IGHV1-69, IGKV1-17, LTBP4, JCHAIN, extracellular region CXCL9, MMP3, IL7R, CCL5, CXCL11, MMP1, CXCL10,
ANGPTL7, APOD, FCMR, GSN, GPX3, CD2, COL6A1, IGKC, LOXL1, CD27, SPP1, CYR61, ADAM28, LPL, IL6, GZMA, MZB1, CCL19, COL5A1, LAMA2, CCL13, GZMK, SFRP1, ADM, IGLV2-14, CXCL13, COL1A2, HBEGF, IGKV4-1, COL1A1, IGLV3-25, GDF15, PLA2G2D, ADAMDEC1, GBP1
CC GO:0009897~external 17 9.24E-11 IGHG1, PTPRC, IL6, CXCL9, IL7R, IGHM, CXCL10, side of plasma SDC1, CCR7, CCR5, IGHD, MS4A1, CD2,
membrane HLA-DRB4, IL2RG, IGKC, CD27
CC GO:0005615~ 33 3.48E-07 IGHG1, LTBP4, JCHAIN, CXCL9, IL32, MMP3, CXCL11, extracellular space CCL5, IGHM, CXCL10, APOD, GSN, GPX3, MS4A1, IGKC,
LOXL1, SPP1, EGFR, LPL, FLRT2, IL6, CCL19, CCL18, CCL13, SFRP1, ADM, CXCL13, COL1A2, HBEGF, ALOX5, COL1A1, SEMA4D, GDF15
CC GO:0031012~ 13 1.57E-05 LAMA2, ASPN, LPL, SFRP1, LTBP4, EIF4A1, COL1A2, extracellular matrix COL6A1, COL1A1, LOXL1, MMP1, COL5A1, CYR61 CC GO:0005886~ 61 3.31E-05 IL27RA, IGKV1-17, IGHM, SKAP2, TLR7, EDNRB, TRAC,
plasma membrane GSN, ERAP2, EGFR, CD3D, EFNB2, TNFRSF17, PRKCB, CD38, CCR7, SDC1, CCR5, HAS1, IGLV2-14, IGHD, CCR2, LCK, IGKV4-1, HLA-DPA1, IGLV3-25, SEMA4D, BTN3A3, BTN3A2, GAP43, GBP1, HLA-DQB1, ABCA8, IGHV1-69, PLXNC1, ZBTB16, IL7R, GPRC5A, SLC19A2, PLPP3, RASGRP1, FCGR1B, HLA-DRB4, CD2, SLC39A8, IL2RG, IGKC, CD27, BLNK, ADAM28, FLRT2, LPL, PTPRC, KLF9, ITGA4, RGS16, CORO1A, LAMP3, SFRP1, FCGR2B, HBEGF
datasets from different groups, utilized bioinformatics
methods to deeply analyze these datasets, and
identi-fied 229 commonly changed DEGs. The number of
up-regulated genes was significantly higher than the
down--regulated genes (145 vs 84). Moreover, total of 103
consistently expressed genes were identified between
the 229 DEGs and the three datasets, including 74
up--regulated genes and 29 downup--regulated genes. In the
hierarchical clustering analysis, we found six GEO
sam-ples (GSM) of RA (GSM1339624, GSM1337324,
GSM1339620, GSM1337315, GSM303366, and
GSM302882) were not classified as the RA group. Since
these patients were diagnosed as RA patients there must
be a reason for the lack of clustering such as joint loca
-lization
18,19, different disease stages and disease
activi-tly enriched in pathways including chemokine
signal-ing pathway, tumor necrosis factor (TNF) signa lsignal-ing
pathway, rheumatoid arthritis, EpsteBarr virus
in-fection and cytokine-cytokine receptor interaction
(Table III).
dIscussIon
Many studies have been performed to disclose the cau
-ses and underlying mechanisms of rheumatoid
arthri-tis formation and progression during the past decades.
RA incidence appeared relatively stable, and mortality
was substantially higher in RA versus the general popu
-lation
17. Our study integrated four cohorts profile
tAble I. contInuAtIon
Category Term Count P-value Genes
MF GO:0003823~ 12 2.15E-09 IGHG1, IGHV1-69, IGLV2-14, IGKV1-17, IGHD, JCHAIN, antigen binding IGKV4-1, IGLV3-25, ITGA4, IGKC, IL7R, IGHM
MF GO:0008009~ 8 2.61E-07 CCL13, CXCL13, CXCL9, CCL19, CCL5, CXCL11,
chemokine activity CCL18, CXCL10
MF GO:0001077~ 13 1.53E-06 EGR1, CEBPD, NR4A2, NR4A1, LEF1, FOSB, SOX9, transcriptional JUNB, FOS, JUN, IRF4, MYC, KLF4
activator activity, RNA polymerase II core promoter proximal region sequence--specific binding MF GO:0048248~CXCR3 4 7.06E-06 CXCL13, CXCL9, CXCL11, CXCL10 chemokine receptor binding
MF GO:0008201~heparin 10 1.46E-05 LPL, SFRP1, CXCL13, HBEGF, ADAMTS1, CXCL11,
binding PLA2G2D, COL5A1, CXCL10, CYR61
KEGG hsa04060:Cytokine- 17 7.17E-08 EGFR, IL6, IL21R, CXCL9, TNFRSF17, CCL19, CXCL11, cytokine receptor CCL5, IL7R, CXCL10, CCL13, CCR7, CCR5, CXCL13,
interaction CCR2, IL2RG, CD27
KEGG hsa04062:Chemokine 13 7.88E-06 CCR7, CCL13, CCR5, NCF1, CXCL13, CCR2, CXCL9, signaling pathway CCL19, CXCL11, CCL5, STAT1, CCL18, CXCL10 KEGG hsa04620:Toll-like 10 1.31E-05 FOS, IL6, JUN, CXCL9, CCL5, CXCL11, STAT1, TLR7,
receptor signaling SPP1, CXCL10
pathway
KEGG hsa05321:Inflammatory 8 2.44E-05 HLA-DQB1, IL6, JUN, IL21R, HLA-DRB4, IL2RG, bowel disease (IBD) HLA-DPA1, STAT1
KEGG hsa05323:Rheumatoid 9 2.47E-05 HLA-DQB1, FOS, IL6, JUN, HLA-DRB4, HLA-DPA1, CCL5,
arthritis MMP3, MMP1
Note: BP, biological process; CC, cell component; MF, molecular function; GO, gene ontology; KEGG, Kyoto Encyclopedia of Genes and Genomes
were significantly enriched in biological processes
in-cluding immune response, inflammatory response,
chemokine-mediated signaling pathway, response to
lipopolysaccharide and cellular response to tumor
necrosis factor. Development and progression of RA is
closely related to the abnormal function of immune
system, which results in inflammatory response in the
joint capsule
24. Moreover, the enriched KEGG
path-ways of DEGs included cytokine-cytokine receptor
in-teraction, chemokine signaling pathway, toll-like
re-ceptor signaling pathway, and inflammatory bowel
disease. Genetic and environmental factors are conside
-red among the important risk factors in RA
2,25. The
chemokine signaling pathway and toll-like receptor
signa ling pathway have been highly focused on RA
26.
ty or disease subtypes
20-22. Moreover, RA pathogenesis
in different individuals may depend to a lesser extent
on common alterations of the expression of specific key
genes, and rather on individual-specific alterations of
different genes
8.
There is an increasing interest in searching for
net-works of genes, instead of single genes, contributing to
the etiology of complex diseases, since changes in
bio-logical characteristics require coordinate variation in
expression of gene sets. Enrichment analysis tools,
which estimate overrepresentation of particular gene
categories or pathways in a gene list, are a useful
ap-proach in this direction
23. In order to better understand
the interactions of DEGs, we further carried out GO
and KEGG pathway analysis. It was showed that DEGs
FIgure 4.Differentially expressed genes protein–protein interaction (PPI) network was constructed and visualized using Cytoscape software
tAble II. tHe top 20 Hub proteIns In tHe proteIn–proteIn InterActIon network
Gene symbol Gene title Degree
IL6 interleukin 6 58
JUN jun proto-oncogene 40
FOS FBJ murine osteosarcoma viral oncogene homolog 38
PTPRC protein tyrosine phosphatase, receptor type, C 33
MYC v-myc avian myelocytomatosis viral oncogene homolog 33
CCL5 chemokine (C-C motif) ligand 5 30
CCR5 chemokine (C-C motif) receptor 5 27
CCR7 chemokine (C-C motif) receptor 7 26
STAT1 signal transducer and activator of transcription 1 25
EGFR epidermal growth factor receptor 25
CD2 CD2 molecule 25
LCK LCK proto-oncogene, Src family tyrosine kinase 25
PTGS2 prostaglandin-endoperoxide synthase 2 22
EGR1 early growth response 1 22
ATF3 activating transcription factor 3 21
CXCL9 chemokine (C-X-C motif) ligand 9 19
CXCL10 chemokine (C-X-C motif) ligand 10 19
IL7R interleukin 7 receptor 18
DUSP1 dual specificity phosphatase 1 17
CD27 CD27 molecule 17
FIgure 5. Modular analysis of differentially expressed genes protein–protein interaction network. (A) Module-1; (B) Module-2. Middle node as for the seed node in the module by module analysis. Red nodes represent up-regulated genes and baby blue nodes represent down-regulated genes in rheumatoid arthritis compared to the normal samples
It was reported that the majority of the identified
path-ways in RA compared with normal people are involved
in the regulation of inflammation, cytokine–cytokine
receptor interactions, and so on
8.
IL6 and JUN were selected with the high connective
degree after analyzing the hub genes from the DEGs
PPI network. This is consistent with the previous stu
-dies
27,28. Many activated cell types contribute to the
deve lopment and progression of RA. Monocytes,
macrophages, dendritic cells, T and B cells, endothelial
cells, and synovial fibroblasts are major components of
the pannus and contribute to the pathogenesis of
rheumatoid arthritis and other inflammatory
condi-tions
29-31. IL6 was first described as a cytokine
indu-cing B lymphocytes to produce immunoglobulin or
stimulating hepatocytes and it was named Bstimula
-ting factor-2 or hepatocyte growth factor. IL6 is an
in-flammatory cytokine involved in various biologic
proces ses, including dysimmune diseases and
can-cers
32,33. Increased production of IL-6 is associated
with rheumatoid arthritis that acts through its receptor,
interleukin 6 receptor (IL-6R). Various single
nu-cleotide polymorphisms in the IL-6R gene conferring
susceptibility to RA have been identified in various
populations
34,35. A positive correlation was evident
be-tween the disease activity score (28) and IL6 levels in
patients with rheumatoid arthritis
36. Tocilizumab is an
immunosuppressive drug against the IL-6R and used
for the treatment of moderate to severe rheumatoid
arthritis, applied in combination with methotrexate.
The drug slows down the activity of the disease and
can improve physical function of patients
37. Abatacept
targeted T cells and rituximab targeted B cells, are
appro ved for use in RA patients after TNF inhibitor
have failed
38. JUN proto-oncogene is a normal gene that
could become an oncogene due to mutations or
in-creased expression. Proto-oncogenes code for proteins
that help to regulate cell growth and differentiation.
Proto-oncogenes are often involved in signal
transduc-tion and executransduc-tion of mitogenic signals, usually
through their protein products
39. Both JUN and its
dimerization partners in activator protein 1 (AP-1)
for-mation are subject to regulation by diverse
extracellu-lar stimuli, which include peptide growth factors,
pro-inflammatory cytokines, oxidative and other forms of
cellular stress
40. AP-1 dependent genes, e.g.,
matrix-metalloproteinase, are involved in the pathogenesis of
RA. Therefore, the transcriptions factor AP-1 and its
subunits, proteins of the JUN and FOS proto-oncogene
families, are interesting targets for analysis in RA
41.
Simi larly, JUN and MYC were also identified as hub
gene in the study from other laboratories
42. Signal
trans-ducer and activator of transcription 1 (STAT1) was also
identified as hub genes in our study. Signal transducer
and activator of transcriptions (STATs) and Janus
kinases (JAKs) are critical in cytokine intracellular si
-gnalling and strongly involved in many inflammatory
disease. JAK activation phosphorylates the STAT
inducing the expression of many genes that several stu
-dies have shown to be crucial in the pathogenesis of
RA
43,44. Many cytokines involved in the pathogenesis
of autoimmune and inflammatory diseases use JAKs
and STATs to transduce intracellular signals. Then,
small-molecule inhibitors of JAKs have gained traction
as safe and efficacious options for the treatment of
in-flammation-driven pathologies such as rheumatoid
tAble III. tHe kegg pAtHwAy enrIcHment AnAlysIs In tHe top 2 modules genesCategory Term Count P-value Genes
hsa04062:Chemokine signaling 10 9.4E-09 CCL13, CCR7, CCR5, CXCL13, CCR2,
pathway CXCL9, CCL19,CXCL11, CCL18, CXCL10
hsa04060:Cytokine-cytokine receptor 9 0.0016 CCL13, CCR7, CCR5, CXCL13, CCR2, Cluster-1
interaction CXCL9, CCL19,CXCL11, CXCL10
hsa04620:Toll-like receptor 7 0.0038 FOS, JUN, CXCL9, CXCL11, TLR7,
signaling pathway SPP1, CXCL10
hsa04668:TNF signaling pathway 5 0.0061 FOS, SOCS3, JUN, MMP3, CXCL10 hsa04060:Cytokine-cytokine 4 0.0049 EGFR, CCL5, IL7R, CD27
Cluster-2 receptor interaction
hsa04012:ErbB signaling pathway 3 0.0080 EGFR, HBEGF, MYC Note: KEGG: Kyoto Encyclopedia of Genes and Genomes, P<0.01
arthritis
45. For example, tofacitinib primarily inhibits
Janus kinase 1 (JAK-1) and Janus kinase 3 (JAK-3) for
the treatment of moderate to severe RA
46. Baricitinib is
a new promising therapy for RA by selectively and
re-versibly inhibiting JAK-1 and Janus kinase 2 (JAK-2)
47.
Therefore, JAK-STAT signaling blockade may be a key
target therapy for RA.
Module analysis of the PPI network revealed that the
development of RA was associated with chemokine
signa ling pathway, cytokine-cytokine receptor
interac-tion, toll-like receptor signaling pathway, TNF signa ling
pathway, rheumatoid arthritis, and so on. The first
module or cluster consisting of 27 genes, including
toll--like receptor 7 (TLT7), C-X-C Motif Chemokine
Ligend (CXCL) family members (CXCL9, CXCL10,
CXCL11, CXCL13), beta chemokine receptors (CCR2,
CCR5, CCR7) were listed at the top of the most
changed genes, and their biological functions are
mainly involved in cell inflammation response. It was inte
-resting that TLT7 is identified as the seed node in the
cluster-1. TLR7 is an endosomal innate immune
sen-sor capable of detecting single-stranded ribonucleic
acid
48. TLR7-mediated induction of type I interferon
and other inflammatory cytokine production is
im-portant in antiviral immune responses. Altered TLR7
expression levels are implicated in various autoimmune
disorders, indicating a key role for this receptor in mo
-dulating inflammation. Moreover, triggering receptor
expressed on myeloid cells like 4, a protein associated
with antigen presentation and apoptosis in immune
cells, has been implicated in the amplification of TLR7
signaling
49. There is a growing interest in the targeting
of toll-like receptors (TLRs) for the prevention and
treatment of cancer, rheumatoid arthritis,
inflammato-ry bowel disease and systemic lupus einflammato-rythematosus
(SLE). Several new compounds are now undergoing
preclinical and clinical evaluation, with a particular
fo-cus on TLR7 and TLR9 activators as adjuvants in
in-fection and cancer, and inhibitors of TLR2, TLR4,
TLR7 and TLR9 for the treatment of sepsis and
in-flammatory diseases
50. Earlier investigations have
high-lighted the importance of TLR2 and TLR4 function in
RA pathogenesis; however more recent studies have
also revealed a significant impact of TLR7 in RA patho
-lo gy
51. TNF signaling pathway included three hub
genes (JUN, FOS, CXCL10) in the Cluster-1. Previous
report focused on TNF-inhibitors to treat RA, which
showed to significantly improve clinical and functio nal
scores
52. Moreover, the chemokine signaling pathway
included 10 genes, and four is part of the hub genes
(Table II-III). Similarly, cytokine-cytokine receptor
in-teraction also included 9 genes of it (Table III). The RA
synovial compartment contains several ligands for
CCR1, CCR2, and CCR5 as well as other chemokines
and receptors involved in monocyte recruitment to the
site of inflammation. Some researchers concentrated
on inhibiting chemokines and its receptors to treat RA.
CCR5 antagonists failed to demonstrate clinical
effica-cy, CCR5 appeared not to be a desirable target in RA
treatment
53. CCR2 and CCR5 were not critical for the
migration of monocytes towards the synovial
com-partment in RA. In contrast, blockade of CCR1 may be
effective
54. Chemokine (C-C motif) ligand 5 (CCL5)
induced collagen degradation by activating Matrix me
-talloproteinase 1 (MMP-1) and matrix
metallopro-teinase 13 (MMP-13) expression by partly utilizing
heparan sulfate proteoglycans in human rheumatoid
arthritis synovial fibroblasts
55. Encouragingly,
com-bined blockade of TNF alpha and interleukin 17
(IL17) was more effective than single blockade in
inhibiting cytokine, chemokine, and matrix enzyme res
-ponses from human mesenchymal cells and in blo cking
tissue destruction associated with RA, and additiona
lly showed a positive impact on rebalance of bone ho
-meostasis
56. Bispecific anti-TNF alpha/IL-17 antibodies
may have superior efficacy in the treatment of RA.
The second module consisting of 13 genes, inclu
-ding growth arrest and DNA-damage-inducible beta
(GADD45B) and epidermal growth factor receptor
(EGFR) were listed at the top of the most changed
genes, and their biological functions are mainly invol
-ved in regulation of cell growth and apoptosis.
GADD45B is identified as the seed node in the cluster-2.
GADD45B is a member of a group of genes whose
tran-script levels are increased following stressful growth
arrest conditions and treatment with DNA-damaging
agents. The function of these genes or their protein
products is involved in the regulation of growth
and apoptosis. These genes are regulated by different
mechanisms, but they are often coordinately expressed
and can function cooperatively in inhibiting cell
growth. Previous study has suggested a novel
mecha-nism by which specific cytokines in the RA synovial
fluid elevate GADD45B expression in local Th1 cells
and subsequently leading to the enhanced T cell
sur-vival
57. Deficient GADD45B expression in RA can
con-tribute to activation of JNK, exacerbate clinical
arthri-tis, and augment joint destruction. This process can be
mitigated by enhancing GADD45B expression or by
in-hibiting the activity of JNK or its upstream regulator,
dual specificity mitogen-activated protein kinase
ki-nase 7 (MKK-7)
58. GADD45B immunostaining was si
-gnificantly higher in the sub-group of RA patients with
poor-response to methotrexate therapy
20. It is reasona
-ble to believe GADD45B are probably involved in RA
pathogenesis. Activation of EGFR signaling is
responsible for synovial fibroblast proliferation in RA. Further
-more, in addition to its role in proliferation, EGFR and
its ligands can induce cytokine production of synovial
fibroblasts during the pathogenesis of RA. Agents
tar-geted EGFR have yielded promising results in animal
experiments involving RA, pharmacologic modulations
targeting EGFR, or its ligands may give rise to new the
-rapeutic approaches for RA
59. On the basis on
integra-tion of gene expression profiles, p53 was involved in
the progression of RA via targeting EGFR
42.
conclusIon
In conclusion, we have identified 49 mostly changed
hub genes, which significant enriched in several
pathways, mainly associated with cytokinecytokine rece
-ptor interaction, chemokine signaling pathway,
Toll-like receptor signaling pathway and TNF signaling
pathway in RA. These findings may contribute to
im-prove our understanding of the cause and underlying
molecular events in RA, these candidate genes and
pathways could be therapeutic targets for RA but must
be confirmed by other studies.
correspondence to
Wen-Zong Lu
Department of Biomedical Engineering,
College of Electronic and Information Engineering Xi’an Technological University
Xi’an, Shaanxi Province 710021 People’s Republic of China E-mail: [email protected]
reFerences
1. Ferro F, Elefante E, Luciano N, Talarico R, Todoerti M. One year in review 2017: novelties in the treatment of rheumatoid arthri-tis. Clin Exp Rheumatol. 2017;35:721-734.
2. Smolen JS, Aletaha D, McInnes IB. Rheumatoid arthritis. Lancet. 2016;388:2023-2038.
3. Bala A, Chetia P, Dolai N, Khandelwal B, Haldar PK. Cat’s whiskers flavonoid attenuated oxidative DNA damage and acute inflammation: its importance in lymphocytes of patients with rheumatoid arthritis. Inflammopharmacology. 2014;22:55-61. 4. Marquez A, Vidal-Bralo L, Rodriguez-Rodriguez L, et al. A com-bined large-scale meta-analysis identifies COG6 as a novel shared risk locus for rheumatoid arthritis and systemic lupus erythematosus. Ann Rheum Dis. 2017;76:286-294.
5. Bala A, Mondal C, Haldar PK, Khandelwal B. Oxidative stress in inflammatory cells of patient with rheumatoid arthritis: cli -nical efficacy of dietary antioxidants. Inflammopharmacology. 2017; 25:595-607.
6. Takeshita M, Kuno A, Suzuki K, et al. Alteration of matrix me -talloproteinase-3 O-glycan structure as a biomarker for disease activity of rheumatoid arthritis. Arthritis Res Ther. 2016;18:112. 7. Lu C, Xiao C, Chen G, et al. Cold and heat pattern of rheuma-toid arthritis in traditional Chinese medicine: distinct molecu-lar signatures indentified by microarray expression profiles in CD4-positive T cell. Rheumatol Int. 2012;32:61-68.
8. Huber R, Hummert C, Gausmann U, et al. Identification of in-tra-group, inter-individual, and gene-specific variances in mRNA expression profiles in the rheumatoid arthritis synovial membrane. Arthritis Res Ther. 2008;10:R98.
9. Woetzel D, Huber R, Kupfer P, et al. Identification of rheuma-toid arthritis and osteoarthritis patients by transcriptome-based rule set generation. Arthritis Res Ther. 2014;16:R84. 10. Gautier L, Cope L, Bolstad BM, Irizarry RA. affy—analysis of
Affymetrix GeneChip data at the probe level. Bioinformatics. 2004;20:307-315.
11. Phipson B, Lee S, Majewski IJ, Alexander WS, Smyth GK. Ro-bust hyperparmeter estimation protects against hypervariable genes and improves power to detect differential expression. Ann Appl Stat. 2016;10:946-963.
12. Leek JT, Johnson WE, Parker HS, Jaffe AE, Storey JD. The sva package for removing batch effects and other unwanted varia-tion in high-throughput experiments. Bioinformatics. 2012;28:882-883.
13. Dennis G, Jr., Sherman BT, Hosack DA, et al. DAVID: Database for Annotation, Visualization, and Integrated Discovery. Genome Biol. 2003;4:P3.
14. von Mering C, Huynen M, Jaeggi D, Schmidt S, Bork P, Snel B. STRING: a database of predicted functional associations be-tween proteins. Nucleic Acids Res. 2003;31:258-261. 15. Shannon P, Markiel A, Ozier O, et al. Cytoscape: a software
en-vironment for integrated models of biomolecular interaction networks. Genome Res. 2003;13:2498-2504.
16. Bader GD, Hogue CW. An automated method for finding molec-ular complexes in large protein interaction networks. BMC Bioinformatics. 2003;4:2.
17. Jean S, Hudson M, Gamache P, et al. Temporal trends in preva-lence, incidence, and mortality for rheumatoid arthritis in Que-bec, Canada: a population-based study. Clin Rheumatol. 2017;36: 2667-2671.
18. Ai R, Hammaker D, Boyle DL, et al. Joint-specific DNA methy-lation and transcriptome signatures in rheumatoid arthritis identify distinct pathogenic processes. Nat Commun. 2016;7:11849.
19. Frank-Bertoncelj M, Trenkmann M, Klein K, et al. Epigenetical-ly-driven anatomical diversity of synovial fibroblasts guides joint-specific fibroblast functions. Nat Commun. 2017;8: 14852. 20. De Groof A, Ducreux J, Humby F, et al. Higher expression of
TN-Falpha-induced genes in the synovium of patients with early rheumatoid arthritis correlates with disease activity, and pre-dicts absence of response to first line therapy. Arthritis Res Ther. 2016;18:19.
21. Pitzalis C, Kelly S, Humby F. New learnings on the pathophys-iology of RA from synovial biopsies. Curr Opin Rheumatol. 2013;25:334-344.
au-toreactive antibodies in rheumatoid arthritis. Semin Im-munopathol. 2014;36:313-325.
23. Huang Q, Wu LY, Wang Y, Zhang XS. GOMA: functional en-richment analysis tool based on GO modules. Chin J Cancer. 2013;32:195-204.
24. Venuturupalli S. Immune mechanisms and novel targets in rheu matoid arthritis. Immunol Allergy Clin North Am. 2017; 37:301-313.
25. Firestein GS, McInnes IB. Immunopathogenesis of rheumatoid arthritis. Immunity. 2017;46:183-196.
26. Zhang M, Mu H, Lv H, et al. Integrative analysis of genome-wide association studies and gene expression analysis identifies pathways associated with rheumatoid arthritis. Oncotarget. 2016;7:8580-8589.
27. Zhang X, Yuan Z, Cui S. Identifying candidate genes involved in osteoarthritis through bioinformatics analysis. Clin Exp Rheumatol. 2016;34:282-290.
28. Gang XK, Sun Y, Li F, et al. Identification of key genes associa -ted with rheumatoid arthritis with bioinformatics approach. Medicine. 2017;96:e7673.
29. Mellado M, Martinez-Munoz L, Cascio G, Lucas P, Pablos JL, Rodriguez-Frade JM. T Cell Migration in Rheumatoid Arthritis. Front Immunol. 2015;6:384.
30. Fearon U, Canavan M, Biniecka M, Veale DJ. Hypoxia, mito-chondrial dysfunction and synovial invasiveness in rheumatoid arthritis. Nat Rev Rheumatol. 2016;12:385-397.
31. Veale DJ, Orr C, Fearon U. Cellular and molecular perspectives in rheumatoid arthritis. Semin Immunopathol. 2017;39:343-354. 32. Tanaka T, Narazaki M, Kishimoto T. IL-6 in inflammation,
im-munity, and disease. Cold Spring Harb Perspect Biol. 2014;6:a016295.
33. Dmitrieva OS, Shilovskiy IP, Khaitov MR, Grivennikov SI. In-terleukins 1 and 6 as Main Mediators of Inflammation and Can-cer. Biochemistry (Mosc). 2016;81:80-90.
34. Ahmed S, Hussain S, Ammar A, Jahan S, Khaliq S, Kaul H. In-terleukin 6 Receptor (IL6-R) Gene Polymorphisms Underlie Susceptibility to Rheumatoid Arthritis. Clin Lab. 2017;63:1365--1369.
35. Ruiz-Larranaga O, Uribarri M, Alcaro MC, et al. Genetic variants associated with rheumatoid arthritis patients and serotypes in European populations. Clin Exp Rheumatol. 2016;34:236-241. 36. Tekeoglu I, Harman H, Sag S, Altindis M, Kamanli A, Nas K. Levels of serum pentraxin 3, IL-6, fetuin A and insulin in pa-tients with rheumatoid arthritis. Cytokine. 2016;83:171-175. 37. Atsumi T, Fujio K, Yamaoka K, et al. Safety and effectiveness of
subcutaneous tocilizumab in patients with rheumatoid arthri-tis in a real-world clinical setting. Mod Rheumatol. 2017:1-21. 38. Schiotis RE, Buzoianu AD, Muresanu DF, Suciu S. New phar-macological strategies in rheumatic diseases. J Med Life. 2016;9:227-234.
39. Todd R, Wong DT. Oncogenes. Anticancer Res. 1999;19:4729--4746.
40. Wisdom R, Johnson RS, Moore C. c-Jun regulates cell cycle pro-gression and apoptosis by distinct mechanisms. EMBO J. 1999;18:188-197.
41. Huber R, Kunisch E, Gluck B, Egerer R, Sickinger S, Kinne RW. Comparison of conventional and real-time RT-PCR for the quan-titation of jun protooncogene mRNA and analysis of junB mRNA expression in synovial membranes and isolated synovial fibroblasts from rheumatoid arthritis patients. Z Rheumatol. 2003;62:378-389.
42. Xu Y, Huang Y, Cai D, Liu J, Cao X. Analysis of differences in the molecular mechanism of rheumatoid arthritis and os-teoarthritis based on integration of gene expression profiles. Im-munol Lett. 2015;168:246-253.
43. Wu S, Li Y, Yao L, et al. Interleukin-35 inhibits angiogenesis through STAT1 signalling in rheumatoid synoviocytes. Clin Exp Rheumatol. 2017;36:234.
44. Banerjee S, Biehl A, Gadina M, Hasni S, Schwartz DM. JAK-STAT Signaling as a Target for Inflammatory and Autoimmune Diseases: Current and Future Prospects Drugs. 2017;77:521--546.
45. Schwartz DM, Kanno Y, Villarino A, Ward M, Gadina M, O’Shea JJ. JAK inhibition as a therapeutic strategy for immune and in-flammatory diseases. Nat Rev Drug Discov. 2017;16:843-862. 46. Yamanaka H, Tanaka Y, Takeuchi T, et al. Tofacitinib, an oral Janus kinase inhibitor, as monotherapy or with background methotrexate, in Japanese patients with rheumatoid arthritis: an open-label, long-term extension study. Arthritis Res Ther. 2016;18:34.
47. Genovese MC, Kremer J, Zamani O, et al. Baricitinib in Patients with Refractory Rheumatoid Arthritis. N Engl J Med. 2016;374:1243-1252.
48. Fletcher S, Steffy K, Averett D. Masked oral prodrugs of toll-like receptor 7 agonists: a new approach for the treatment of infec-tious disease. Curr Opin Investig Drugs. 2006;7:702-708. 49. Petes C, Odoardi N, Gee K. The Toll for Trafficking: Toll-Like
Receptor 7 Delivery to the Endosome. Front Immunol. 2017; 8:1075.
50. Hennessy EJ, Parker AE, O’Neill LA. Targeting Toll-like receptors: emerging therapeutics? Nat Rev Drug Discov. 2010;9:293-307. 51. Elshabrawy HA, Essani AE, Szekanecz Z, Fox DA, Shahrara S. TLRs, future potential therapeutic targets for RA. Autoimmun Rev. 2017;16:103-113.
52. Boubouchairopoulou N, Flouri I, Drosos AA, et al. Treatment with the first TNF inhibitor in rheumatoid arthritis patients in the Hellenic Registry of Biologic Therapies improves quality of life especially in young patients with better baseline functional status. Clin Exp Rheumatol. 2016;34:999-1005.
53. Takeuchi T, Kameda H. What is the future of CCR5 antagonists in rheumatoid arthritis? Arthritis Res Ther. 2012;14:114. 54. Lebre MC, Vergunst CE, Choi IYK, et al. Why CCR2 and CCR5
blockade failed and why CCR1 blockade might still be effective in the treatment of rheumatoid arthritis. Plos One. 2011;6: e21772. 55. Agere SA, Akhtar N, Watson JM, Ahmed S. RANTES/CCL5 in-duces collagen degradation by activating MMP-1 and MMP-13 expression in human rheumatoid arthritis synovial fibroblasts. Front Immunol. 2017;8:1341.
56. Fischer JAA, Hueber AJ, Wilson S, et al. Combined inhibition of tumor necrosis factor alpha and interleukin-17 as a thera-peutic opportunity in rheumatoid arthritis development and characterization of a novel bispecific antibody. Arthritis & Rheumatology. 2015;67:51-62.
57. Du F, Wang L, Zhang Y, et al. Role of GADD45 beta in the re -gulation of synovial fluid T cell apoptosis in rheumatoid arthri-tis. Clin Immunol. 2008;128:238-247.
58. Svensson CI, Inoue T, Hammaker D, et al. Gadd45beta defi-ciency in rheumatoid arthritis: enhanced synovitis through JNK signaling. Arthritis Rheum. 2009;60:3229-3240.
59. Yuan FL, Li X, Lu WG, Sun JM, Jiang DL, Xu RS. Epidermal growth factor receptor (EGFR) as a therapeutic target in rheuma-toid arthritis. Clin Rheumatol. 2013;32:289-292.
supplementAry FIle tAble I. IdentIFIed 229 commonly cHAnged dIFFerentIAlly expressed genes
Gene Gene Title logFC P. Value
IGHM immunoglobulin heavy constant mu 3.79637 3.46817E-17
IGKV1-17 immunoglobulin kappa variable 1-17 3.54868 2.12861E-14
CXCL13 chemokine (C-X-C motif) ligand 13 3.42935 4.0109E-15
IGKC immunoglobulin kappa constant 3.32314 8.04864E-13
POU2AF1 POU class 2 associating factor 1 3.03310 3.47536E-13
IGKV4-1 immunoglobulin kappa variable 4-1 2.84279 5.73483E-13
MMP1 matrix metallopeptidase 1 2.83171 2.03581E-07
IGKC immunoglobulin kappa constant 2.80131 2.40114E-12
IGHM immunoglobulin heavy constant mu 2.80030 5.54553E-12
IGKV1D-13 immunoglobulin kappa variable 1D-13 2.75749 1.06203E-14
IGKC immunoglobulin kappa constant 2.60157 1.06282E-14
JCHAIN joining chain of multimeric IgA and IgM 2.58630 8.56313E-12 IGKV1OR2-108 immunoglobulin kappa variable 1/OR2-108 (non-functional) 2.54490 1.10701E-13
IGLJ3 immunoglobulin lambda joining 3 2.52939 2.66384E-13
FOSB FBJ murine osteosarcoma viral oncogene homolog B -2.52522 2.16049E-10
CXCL9 chemokine (C-X-C motif) ligand 9 2.50734 6.00129E-14
IGLV2-14 immunoglobulin lambda variable 2-14 2.44207 7.77896E-13 IGLV3-10 immunoglobulin lambda variable 3-10 2.36913 2.09075E-11 IGHV1-69 immunoglobulin heavy variable 1-69 2.31449 3.73935E-12
IGLJ3 immunoglobulin lambda joining 3 2.30430 1.20106E-12
IGLV@ immunoglobulin lambda variable cluster 2.25398 2.42369E-12
CCL18 chemokine (C-C motif) ligand 18 2.25206 6.64655E-12
IGHD immunoglobulin heavy constant delta 2.24095 1.0078E-11
RPS4Y1 ribosomal protein S4, Y-linked 1 -2.22014 1.93619E-05
IGLJ3 immunoglobulin lambda joining 3 2.19847 1.70408E-12
ADAMDEC1 ADAM-like, decysin 1 2.18802 6.22369E-13
SLAMF8 SLAM family member 8 2.14532 1.24076E-14
DDX3Y DEAD (Asp-Glu-Ala-Asp) box helicase 3, Y-linked -2.09899 2.51843E-06
EGR1 early growth response 1 -2.08191 4.37873E-12
CXCL10 chemokine (C-X-C motif) ligand 10 2.00281 2.683E-14
IGLV3-25 immunoglobulin lambda variable 3-25 1.98090 1.27926E-11
GSN gelsolin -1.96302 7.01793E-14
LRRC15 leucine rich repeat containing 15 1.95529 3.44061E-14
JUN jun proto-oncogene -1.92380 3.90605E-12
APOD apolipoprotein D -1.89568 1.71088E-06
TNFRSF17 tumor necrosis factor receptor superfamily, member 17 1.84507 2.03149E-09 ADH1B alcohol dehydrogenase 1B (class I), beta polypeptide -1.79312 0.001194373
CCL18 chemokine (C-C motif) ligand 18 1.76918 3.25046E-11
MXRA5 matrix-remodelling associated 5 1.76787 1.04619E-09
ADH1B alcohol dehydrogenase 1B (class I), beta polypeptide -1.74572 0.001195825
CD52 CD52 molecule 1.71635 2.17128E-10
XIST X inactive specific transcript (non-protein coding) 1.70152 6.78346E-05
AIM2 absent in melanoma 2 1.67030 1.95329E-15
NR4A2 nuclear receptor subfamily 4, group A, member 2 -1.66559 3.49386E-09
PLXNC1 plexin C1 1.66349 7.19577E-13
NFIL3 nuclear factor, interleukin 3 regulated -1.66134 1.13642E-12 continues on the next page
supplementAry FIle tAble I. contInuAtIon
Gene Gene Title logFC P. Value
IGHG1 immunoglobulin heavy constant gamma 1 (G1m marker) 1.64496 2.85142E-10 EIF4A1 eukaryotic translation initiation factor 4A1 -1.64414 4.08629E-11 FOS FBJ murine osteosarcoma viral oncogene homolog -1.64125 2.99621E-06 GADD45B growth arrest and DNA-damage-inducible, beta -1.63815 1.80263E-12
DUSP1 dual specificity phosphatase 1 -1.62714 4.27648E-11
SEL1L3 sel-1 suppressor of lin-12-like 3 (C. elegans) 1.60942 1.8277E-14
IGK immunoglobulin kappa locus 1.60537 2.55067E-09
EIF1 eukaryotic translation initiation factor 1 -1.59734 1.02638E-08 SKAP2 src kinase associated phosphoprotein 2 1.59613 8.77389E-10 NR4A2 nuclear receptor subfamily 4, group A, member 2 -1.58119 5.44362E-09 ZBTB16 zinc finger and BTB domain containing 16 -1.57686 1.22926E-06 IGLL3P immunoglobulin lambda-like polypeptide 3, pseudogene 1.57129 1.40164E-13 CYR61 cysteine-rich, angiogenic inducer, 61 -1.56394 1.32864E-09 MAFF v-maf avian musculoaponeurotic fibrosarcoma oncogene homolog F -1.54699 6.81405E-08 SEL1L3 sel-1 suppressor of lin-12-like 3 (C. elegans) 1.54513 1.6732E-13
C7 complement component 7 -1.53231 1.51637E-09
TPD52 tumor protein D52 1.52320 4.87719E-14
NR4A2 nuclear receptor subfamily 4, group A, member 2 -1.50039 5.0075E-09 GBP1 guanylate binding protein 1, interferon-inducible 1.49320 9.4905E-12 ERAP2 endoplasmic reticulum aminopeptidase 2 1.48996 1.21875E-07
COL1A1 collagen, type I, alpha 1 1.48436 3.07621E-06
ATF3 activating transcription factor 3 -1.46809 2.0212E-07
CD27 CD27 molecule 1.46376 4.82384E-12
ADAM28 ADAM metallopeptidase domain 28 1.45884 1.31965E-11
MS4A1 membrane-spanning 4-domains, subfamily A, member 1 1.45716 2.15158E-07 LCK LCK proto-oncogene, Src family tyrosine kinase 1.45708 3.28282E-11 IGHV1-69 immunoglobulin heavy variable 1-69 1.45394 1.16892E-10
CCL5 chemokine (C-C motif) ligand 5 1.45338 1.41419E-12
EGR1 early growth response 1 -1.44956 6.52987E-11
TPD52 tumor protein D52 1.44506 2.13562E-13
HLA-DRB4 major histocompatibility complex, class II, DR beta 4 1.44257 0.000781705
KLF4 Kruppel-like factor 4 (gut) -1.43653 1.85403E-08
PLPP3 phospholipid phosphatase 3 -1.43537 3.77057E-13
BLNK B-cell linker 1.42913 9.13386E-13
NCF1 neutrophil cytosolic factor 1 1.42861 9.26941E-10
JUNB jun B proto-oncogene -1.42808 4.82279E-13
FLRT2 fibronectin leucine rich transmembrane protein 2 1.42767 6.36697E-11
GZMK granzyme K 1.41918 1.0105E-10
HLA-DQB1 major histocompatibility complex, class II, DQ beta 1 1.41738 9.15386E-10 MS4A1 membrane-spanning 4-domains, subfamily A, member 1 1.40354 1.8884E-07 NEAT1 nuclear paraspeckle assembly transcript 1 (non-protein coding) -1.40096 5.37953E-08 GADD45B growth arrest and DNA-damage-inducible, beta -1.39250 3.46637E-11 SLC39A8 solute carrier family 39 (zinc transporter), member 8 1.38781 9.69833E-10
IGK immunoglobulin kappa locus 1.38602 4.87683E-09
XIST X inactive specific transcript (non-protein coding) 1.38056 0.000234691
COL1A1 collagen, type I, alpha 1 1.37494 4.04885E-05
supplementAry FIle tAble I. contInuAtIon
Gene Gene Title logFC P. Value
CD52 CD52 molecule 1.37486 3.48155E-11
CCL5 chemokine (C-C motif) ligand 5 1.37027 7.73558E-11
IGHM immunoglobulin heavy constant mu 1.36835 1.41335E-08
FABP4 fatty acid binding protein 4, adipocyte -1.36683 0.000556824 GBP1 guanylate binding protein 1, interferon-inducible 1.36620 1.39096E-11
SDC1 syndecan 1 1.35850 1.41547E-11
CD3D CD3d molecule, delta (CD3-TCR complex) 1.35238 2.61161E-10 CYP4B1 cytochrome P450, family 4, subfamily B, polypeptide 1 -1.34545 0.000672344 GUSBP11 glucuronidase, beta pseudogene 11 1.34538 1.43182E-09 HLA-DPA1 major histocompatibility complex, class II, DP alpha 1 1.34432 2.1606E-09 SOCS3 suppressor of cytokine signaling 3 -1.33484 1.16668E-10 SLC19A2 solute carrier family 19 (thiamine transporter), member 2 -1.33060 5.96653E-08
SDC1 syndecan 1 1.32730 7.79801E-11
GZMA granzyme A 1.32518 1.0315E-10
IL32 interleukin 32 1.31860 1.1976E-12
SFRP1 secreted frizzled-related protein 1 -1.30861 2.69121E-10
CCL13 chemokine (C-C motif) ligand 13 1.30591 4.28168E-07
PTGS2 prostaglandin-endoperoxide synthase 2 (prostaglandin G/H -1.30127 1.32375E-07 synthase and cyclooxygenase)
CCR2 chemokine (C-C motif) receptor 2 1.30016 6.15755E-11
CYTIP cytohesin 1 interacting protein 1.29969 3.67021E-13
CYR61 cysteine-rich, angiogenic inducer, 61 -1.29621 1.03304E-07
IL2RG interleukin 2 receptor, gamma 1.29348 1.81739E-11
MAOA monoamine oxidase A -1.29126 2.71252E-05
FKBP5 FK506 binding protein 5 -1.28534 3.68818E-09
LAMP3 lysosomal-associated membrane protein 3 1.27313 2.11817E-07 PTPRC protein tyrosine phosphatase, receptor type, C 1.26653 7.09761E-12
TPD52 tumor protein D52 1.26652 1.92053E-11
CD2 CD2 molecule 1.26328 4.01639E-11
MMP3 matrix metallopeptidase 3 1.26266 0.002130295
FKBP11 FK506 binding protein 11 1.25837 8.11804E-09
PTPRC protein tyrosine phosphatase, receptor type, C 1.25687 1.23421E-10
HAS1 hyaluronan synthase 1 -1.25478 1.47737E-08
NR4A1 nuclear receptor subfamily 4, group A, member 1 -1.25396 4.11625E-09
SPP1 secreted phosphoprotein 1 1.24967 0.000473153
KLF9 Kruppel-like factor 9 -1.24826 1.15373E-09
TRAC T-cell receptor alpha constant 1.24620 1.19539E-10
GADD45B growth arrest and DNA-damage-inducible, beta -1.24091 1.48306E-11 RASGRP1 RAS guanyl releasing protein 1 (calcium and DAG-regulated) 1.23704 1.14798E-09
ALOX5 arachidonate 5-lipoxygenase 1.23379 4.46849E-10
LPL lipoprotein lipase -1.23117 0.000661638
IL7R interleukin 7 receptor 1.23095 1.68925E-07
PSMB9 proteasome subunit beta 9 1.23060 5.59139E-16
PCK1 phosphoenolpyruvate carboxykinase 1 (soluble) -1.23043 0.000974441 NTRK2 neurotrophic tyrosine kinase, receptor, type 2 -1.22624 1.04493E-06 SFRP1 secreted frizzled-related protein 1 -1.22193 1.15832E-11
supplementAry FIle tAble I. contInuAtIon
Gene Gene Title logFC P. Value
EGFR epidermal growth factor receptor -1.21176 4.60672E-12
MZB1 marginal zone B and B1 cell-specific protein 1.18883 3.63884E-08 ABCA8 ATP binding cassette subfamily A member 8 -1.18698 3.35654E-05 SLC39A8 solute carrier family 39 (zinc transporter), member 8 1.18603 3.98197E-08
SLAMF8 SLAM family member 8 1.18572 3.89028E-13
SEMA4D sema domain, immunoglobulin domain (Ig), transmembrane 1.18346 2.56735E-11 domain (TM) and short cytoplasmic domain, (semaphorin) 4D
NKG7 natural killer cell granule protein 7 1.18286 2.93599E-11 SFRP1 secreted frizzled-related protein 1 -1.17324 5.8595E-09
CXCL11 chemokine (C-X-C motif) ligand 11 1.16545 1.11702E-07
BTN3A2 butyrophilin, subfamily 3, member A2 1.16439 8.46517E-08 GPRC5A G protein-coupled receptor, class C, group 5, member A -1.16401 7.70006E-09
PRKCB protein kinase C, beta 1.16385 1.93576E-11
IL6 interleukin 6 -1.16337 0.000300705
APOBEC3G apolipoprotein B mRNA editing enzyme, catalytic polypeptide-like 3G1.16188 1.69685E-12
MREG melanoregulin 1.15386 3.45361E-14
CXCL11 chemokine (C-X-C motif) ligand 11 1.15249 1.41005E-07
NTRK2 neurotrophic tyrosine kinase, receptor, type 2 -1.15246 1.97168E-08
IL21R interleukin 21 receptor 1.15196 1.1175E-11
ZFP36L2 ZFP36 ring finger protein-like 2 -1.14723 1.27567E-08 STAT1 signal transducer and activator of transcription 1 1.14302 3.71731E-09
ITGA4 integrin alpha 4 1.14277 9.65725E-13
LGALS2 lectin, galactoside-binding, soluble, 2 1.14270 1.08754E-07
TXNIP thioredoxin interacting protein -1.14259 1.18547E-06
GDF15 growth differentiation factor 15 -1.14225 3.18477E-07
RGS16 regulator of G-protein signaling 16 -1.13658 3.60513E-07
EDNRB endothelin receptor type B -1.13280 2.44157E-07
ACACB acetyl-CoA carboxylase beta -1.12266 4.15701E-06
IER2 immediate early response 2 -1.12217 2.85335E-10
ZFP36 ZFP36 ring finger protein -1.11590 3.13697E-10
HLA-DQB1 major histocompatibility complex, class II, DQ beta 1 1.11336 7.37695E-06
FCMR Fc fragment of IgM receptor 1.11065 2.7113E-08
LOXL1 lysyl oxidase-like 1 1.10364 8.96737E-08
BTN3A3 butyrophilin, subfamily 3, member A3 1.09959 2.60965E-11 FCGR1B Fc fragment of IgG, high affinity Ib, receptor (CD64) 1.09934 1.672E-06
KLF4 Kruppel-like factor 4 (gut) -1.09611 8.51904E-09
MYC v-myc avian myelocytomatosis viral oncogene homolog -1.09237 5.29361E-08
TRAF3IP3 TRAF3 interacting protein 3 1.09201 7.41785E-10
CCR7 chemokine (C-C motif) receptor 7 1.09028 2.72631E-07
TMEM259 transmembrane protein 259 -1.08688 7.59164E-10
AIM1 absent in melanoma 1 1.08684 1.0799E-16
LEF1 lymphoid enhancer-binding factor 1 1.08486 9.72693E-08
RRM2 ribonucleotide reductase M2 1.08396 6.86025E-10
COL1A2 collagen, type I, alpha 2 1.08188 3.27941E-05
CCL19 chemokine (C-C motif) ligand 19 1.07969 0.000157238
C10orf10 chromosome 10 open reading frame 10 -1.07895 7.23965E-06 continues on the next page
supplementAry FIle tAble I. contInuAtIon
Gene Gene Title logFC P. Value
TRAC T-cell receptor alpha constant 1.07766 2.4944E-08
RGS16 regulator of G-protein signaling 16 -1.07765 1.83779E-07
ADM adrenomedullin -1.06997 4.41635E-07
6-Sep septin 6 1.06620 2.14515E-09
SRRM2 serine/arginine repetitive matrix 2 -1.06615 1.0144E-09 CCR5 chemokine (C-C motif) receptor 5 (gene/pseudogene) 1.05497 9.65202E-14
ACACB acetyl-CoA carboxylase beta -1.05348 3.9297E-06
STAT1 signal transducer and activator of transcription 1 1.05271 5.39006E-12
IRF4 interferon regulatory factor 4 1.05067 1.61555E-09
TLR7 toll-like receptor 7 1.04917 1.37634E-08
LAMA2 laminin, alpha 2 -1.04766 3.23459E-05
COL6A1 collagen, type VI, alpha 1 -1.04679 1.22401E-05
COL5A1 collagen, type V, alpha 1 1.04667 7.95563E-06
GABARAPL1 GABA(A) receptor-associated protein like 1 -1.04483 3.85938E-16
FKBP11 FK506 binding protein 11 1.03875 3.29947E-07
JUN jun proto-oncogene -1.03810 3.01712E-06
GAP43 growth associated protein 43 1.03732 1.20917E-09
FCGR2B Fc fragment of IgG, low affinity IIb, receptor (CD32) 1.03445 9.71398E-10 CORO1A coronin, actin binding protein, 1A 1.03370 1.01189E-07
JUN jun proto-oncogene -1.03265 1.29134E-09
ADAMTS1 ADAM metallopeptidase with thrombospondin type 1 motif 1 -1.03221 8.42819E-08
CD38 CD38 molecule 1.03153 7.6747E-10
UCP2 uncoupling protein 2 (mitochondrial, proton carrier) 1.02995 2.60854E-12 HLA-DQB1 major histocompatibility complex, class II, DQ beta 1 1.02966 2.08442E-07
PLA2G2D phospholipase A2, group IID 1.02914 8.69083E-10
PRKCB protein kinase C, beta 1.02786 1.20628E-08
KIAA0125 KIAA0125 1.02667 1.05264E-07
HLA-DQB1 major histocompatibility complex, class II, DQ beta 1 1.02658 4.37368E-08 HBEGF heparin-binding EGF-like growth factor -1.02295 5.69213E-06
IL27RA interleukin 27 receptor, alpha 1.02008 4.67763E-12
SH2D1A SH2 domain containing 1A 1.01810 4.24267E-10
EFNB2 ephrin-B2 -1.01714 4.01051E-10
RTN1 reticulon 1 1.01618 7.87927E-13
GIMAP6 GTPase, IMAP family member 6 1.01568 4.32297E-09
GPX3 glutathione peroxidase 3 -1.01444 4.10754E-07
RRM2 ribonucleotide reductase M2 1.01389 1.59469E-09
ASPN asporin 1.01285 3.07941E-05
STAT1 signal transducer and activator of transcription 1 1.01134 2.78174E-14
COL5A1 collagen, type V, alpha 1 1.01122 1.65935E-05
EDNRB endothelin receptor type B -1.01027 2.50944E-10
SOX9 SRY box 9 -1.00907 2.77275E-10
BHLHE40 basic helix-loop-helix family, member e40 -1.00792 1.05421E-06 LTBP4 latent transforming growth factor beta binding protein 4 -1.00713 1.38558E-09 VOPP1 vesicular, overexpressed in cancer, prosurvival protein 1 1.00709 1.79056E-15
ANGPTL7 angiopoietin like 7 -1.00675 0.000706608
EDNRB endothelin receptor type B -1.00250 5.5363E-11
supplementAry mAterIAls. AnnotAtIon oF gene symbol In FIgures And tAbles Gene symbol Gene title
IGHM immunoglobulin heavy constant mu IGKV1-17 immunoglobulin kappa variable 1-17 CXCL13 chemokine (C-X-C motif) ligand 13 IGKC immunoglobulin kappa constant POU2AF1 POU class 2 associating factor 1 IGKV4-1 immunoglobulin kappa variable 4-1 MMP1 matrix metallopeptidase 1
JCHAIN joining chain of multimeric IgA and IgM IGLJ3 immunoglobulin lambda joining 3
FOSB FBJ murine osteosarcoma viral oncogene homolog B CXCL9 chemokine (C-X-C motif) ligand 9
IGLV2-14 immunoglobulin lambda variable 2-14 IGHV1-69 immunoglobulin heavy variable 1-69 IGLJ3 immunoglobulin lambda joining 3 IGLV@ immunoglobulin lambda variable cluster CCL18 chemokine (C-C motif) ligand 18 IGHD immunoglobulin heavy constant delta RPS4Y1 ribosomal protein S4, Y-linked 1 IGLJ3 immunoglobulin lambda joining 3 ADAMDEC1 ADAM-like, decysin 1
DDX3Y DEAD (Asp-Glu-Ala-Asp) box helicase 3, Y-linked EGR1 early growth response 1
CXCL10 chemokine (C-X-C motif) ligand 10 IGLV3-25 immunoglobulin lambda variable 3-25
GSN gelsolin
LRRC15 leucine rich repeat containing 15 JUN jun proto-oncogene
APOD apolipoprotein D
TNFRSF17 tumor necrosis factor receptor superfamily, member 17 ADH1B alcohol dehydrogenase 1B (class I), beta polypeptide CCL18 chemokine (C-C motif) ligand 18
MXRA5 matrix-remodelling associated 5
ADH1B alcohol dehydrogenase 1B (class I), beta polypeptide
CD52 CD52 molecule
XIST X inactive specific transcript (non-protein coding) AIM2 absent in melanoma 2
NR4A2 nuclear receptor subfamily 4, group A, member 2
PLXNC1 plexin C1
NFIL3 nuclear factor, interleukin 3 regulated IGHG1 immunoglobulin heavy constant gamma 1 EIF4A1 eukaryotic translation initiation factor 4A1
FOS finkel–biskis–jinkins murine osteosarcoma viral oncogene homolog GADD45B growth arrest and deoxyribonucleic-acid-damage-inducible, beta DUSP1 dual specificity phosphatase 1
SEL1L3 sel-1 suppressor of lin-12-like 3 (C. elegans) IGK immunoglobulin kappa locus
supplementAry mAterIAls. contInuAtIon Gene symbol Gene title
EIF1 eukaryotic translation initiation factor 1 SKAP2 src kinase associated phosphoprotein 2
NR4A2 nuclear receptor subfamily 4, group A, member 2 ZBTB16 zinc finger and BTB domain containing 16
IGLL3P immunoglobulin lambda-like polypeptide 3, pseudogene CYR61 cysteine-rich, angiogenic inducer, 61
MAFF v-maf avian musculoaponeurotic fibrosarcoma oncogene homolog F SEL1L3 sel-1 suppressor of lin-12-like 3 (C. elegans)
C7 complement component 7 TPD52 tumor protein D52
NR4A2 nuclear receptor subfamily 4, group A, member 2 GBP1 guanylate binding protein 1, interferon-inducible ERAP2 endoplasmic reticulum aminopeptidase 2 COL1A1 collagen, type I, alpha 1
ATF3 activating transcription factor 3
CD27 CD27 molecule
ADAM28 ADAM metallopeptidase domain 28
MS4A1 membrane-spanning 4-domains, subfamily A, member 1 LCK LCK proto-oncogene, Src family tyrosine kinase IGHV1-69 immunoglobulin heavy variable 1-69
CCL5 chemokine (C-C motif) ligand 5 EGR1 early growth response 1 TPD52 tumor protein D52
HLA-DRB4 major histocompatibility complex, class II, DR beta 4 KLF4 Kruppel-like factor 4 (gut)
PLPP3 phospholipid phosphatase 3 BLNK B-cell linker
NCF1 neutrophil cytosolic factor 1 JUNB jun B proto-oncogene
FLRT2 fibronectin leucine rich transmembrane protein 2
GZMK granzyme K
HLA-DQB1 major histocompatibility complex, class II, DQ beta 1 MS4A1 membrane-spanning 4-domains, subfamily A, member 1 NEAT1 nuclear paraspeckle assembly transcript 1 (non-protein coding) GADD45B growth arrest and DNA-damage-inducible, beta
SLC39A8 solute carrier family 39 (zinc transporter), member 8 XIST X inactive specific transcript (non-protein coding) COL1A1 collagen, type I, alpha 1
CD52 CD52 molecule
IGHM immunoglobulin heavy constant mu FABP4 fatty acid binding protein 4, adipocyte
GBP1 guanylate binding protein 1, interferon-inducible
SDC1 syndecan 1
CD3D CD3d molecule, delta (CD3-TCR complex)
CYP4B1 cytochrome P450, family 4, subfamily B, polypeptide 1 GUSBP11 glucuronidase, beta pseudogene 11
supplementAry mAterIAls. contInuAtIon Gene symbol Gene title
HLA-DPA1 major histocompatibility complex, class II, DP alpha 1 SOCS3 suppressor of cytokine signaling 3
SLC19A2 solute carrier family 19 (thiamine transporter), member 2
SDC1 syndecan 1
GZMA granzyme A
IL32 interleukin 32
SFRP1 secreted frizzled-related protein 1 CCL13 chemokine (C-C motif) ligand 13
PTGS2 prostaglandin-endoperoxide synthase 2 (prostaglandin G/H synthase and cyclooxygenase) CCR2 chemokine (C-C motif) receptor 2
CYTIP cytohesin 1 interacting protein CYR61 cysteine-rich, angiogenic inducer, 61 IL2RG interleukin 2 receptor, gamma MAOA monoamine oxidase A FKBP5 FK506 binding protein 5
LAMP3 lysosomal-associated membrane protein 3 PTPRC protein tyrosine phosphatase, receptor type, C TPD52 tumor protein D52
CD2 CD2 molecule
MMP3 matrix metallopeptidase 3 FKBP11 FK506 binding protein 11
PTPRC protein tyrosine phosphatase, receptor type, C HAS1 hyaluronan synthase 1
NR4A1 nuclear receptor subfamily 4, group A, member 1 SPP1 secreted phosphoprotein 1
KLF9 Kruppel-like factor 9 TRAC T-cell receptor alpha constant
GADD45B growth arrest and DNA-damage-inducible, beta
RASGRP1 RAS guanyl releasing protein 1 (calcium and DAG-regulated) ALOX5 arachidonate 5-lipoxygenase
LPL lipoprotein lipase IL7R interleukin 7 receptor PSMB9 proteasome subunit beta 9
PCK1 phosphoenolpyruvate carboxykinase 1 (soluble) NTRK2 neurotrophic tyrosine kinase, receptor, type 2 SFRP1 secreted frizzled-related protein 1
EGFR epidermal growth factor receptor
MZB1 marginal zone B and B1 cell-specific protein ABCA8 ATP binding cassette subfamily A member 8 SLC39A8 solute carrier family 39 (zinc transporter), member 8 SLAMF8 SLAM family member 8
SEMA4D sema domain, immunoglobulin domain (Ig), transmembrane domain (TM) and short cytoplasmic domain, (semaphorin) 4D
NKG7 natural killer cell granule protein 7 SFRP1 secreted frizzled-related protein 1 CXCL11 chemokine (C-X-C motif) ligand 11
supplementAry mAterIAls. contInuAtIon Gene symbol Gene title
BTN3A2 butyrophilin, subfamily 3, member A2
GPRC5A G protein-coupled receptor, class C, group 5, member A PRKCB protein kinase C, beta
IL6 interleukin 6
APOBEC3G apolipoprotein B mRNA editing enzyme, catalytic polypeptide-like 3G
MREG melanoregulin
CXCL11 chemokine (C-X-C motif) ligand 11
NTRK2 neurotrophic tyrosine kinase, receptor, type 2 IL21R interleukin 21 receptor
ZFP36L2 ZFP36 ring finger protein-like 2 ITGA4 integrin alpha 4
LGALS2 lectin, galactoside-binding, soluble, 2 TXNIP thioredoxin interacting protein GDF15 growth differentiation factor 15 RGS16 regulator of G-protein signaling 16 EDNRB endothelin receptor type B ACACB acetyl-CoA carboxylase beta IER2 immediate early response 2 ZFP36 ZFP36 ring finger protein
HLA-DQB1 major histocompatibility complex, class II, DQ beta 1 FCMR Fc fragment of IgM receptor
LOXL1 lysyl oxidase-like 1
BTN3A3 butyrophilin, subfamily 3, member A3
FCGR1B Fc fragment of IgG, high affinity Ib, receptor (CD64) KLF4 Kruppel-like factor 4 (gut)
MYC v-myc avian myelocytomatosis viral oncogene homolog TRAF3IP3 TRAF3 interacting protein 3
CCR7 chemokine (C-C motif) receptor 7 TMEM259 transmembrane protein 259 AIM1 absent in melanoma 1
LEF1 lymphoid enhancer-binding factor 1 RRM2 ribonucleotide reductase M2 COL1A2 collagen, type I, alpha 2
CCL19 chemokine (C-C motif) ligand 19 TRAC T-cell receptor alpha constant RGS16 regulator of G-protein signaling 16
ADM adrenomedullin
6-Sep septin 6
SRRM2 serine/arginine repetitive matrix 2
CCR5 chemokine (C-C motif) receptor 5 (gene/pseudogene) ACACB acetyl-CoA carboxylase beta
STAT1 signal transducer and activator of transcription 1 IRF4 interferon regulatory factor 4
TLR7 toll-like receptor 7 LAMA2 laminin, alpha 2
COL6A1 collagen, type VI, alpha 1
supplementAry mAterIAls. contInuAtIon Gene symbol Gene title
COL5A1 collagen, type V, alpha 1
GABARAPL1 GABA(A) receptor-associated protein like 1 FKBP11 FK506 binding protein 11
JUN jun proto-oncogene
GAP43 growth associated protein 43
FCGR2B Fc fragment of IgG, low affinity IIb, receptor (CD32) CORO1A coronin, actin binding protein, 1A
ADAMTS1 ADAM metallopeptidase with thrombospondin type 1 motif 1
CD38 CD38 molecule
UCP2 uncoupling protein 2 (mitochondrial, proton carrier) HLA-DQB1 major histocompatibility complex, class II, DQ beta 1 PLA2G2D phospholipase A2, group IID
PRKCB protein kinase C, beta
HLA-DQB1 major histocompatibility complex, class II, DQ beta 1 HBEGF heparin-binding EGF-like growth factor
IL27RA interleukin 27 receptor, alpha SH2D1A SH2 domain containing 1A
EFNB2 ephrin-B2
RTN1 reticulon 1
GIMAP6 GTPase, IMAP family member 6 GPX3 glutathione peroxidase 3 RRM2 ribonucleotide reductase M2
ASPN asporin
COL5A1 collagen, type V, alpha 1 EDNRB endothelin receptor type B
SOX9 SRY box 9
BHLHE40 basic helix-loop-helix family, member e40
LTBP4 latent transforming growth factor beta binding protein 4 VOPP1 vesicular, overexpressed in cancer, prosurvival protein 1 ANGPTL7 angiopoietin like 7
EDNRB endothelin receptor type B