DETERMINANTS OF PUBLISING IN EUROPEAN SCIENTIFIC JOURNALS INDEXED IN SCOPUS: AN APPROACH TO ACCOUNTING
Ana Catarina Fernandes Saldanha
Dissertation submitted as partial requirement for the conferral of Master in Accounting
Supervisor:
Prof. Ana Isabel Lopes, Assistant Professor, ISCTE Business School, Accounting Department
IN
D
E
X
IN
G
D
E
T
E
R
M
IN
A
N
T
S
IN
S
C
O
PE
S
R
A
N
K
IN
G
E
U
R
O
PE
A
N
SC
IE
N
T
IFI
C
J
O
U
R
N
A
L
: A
N
A
P
PR
O
A
C
H
T
O
A
C
C
O
U
N
T
IN
G
A
na
C
at
ar
ina
F
er
na
nde
s
S
al
da
nha
DEDICATION
ABSTRACT
The objective of this dissertation is to identify some determinants that could explain the probability of a paper is published in a journal that is indexed in SCimago Journal Rank, also well known as Scopus. The analysis only covers the category of “Accounting” and includes journals from the European geographic region between 2010 and 2015. The sample comprises 8 326 articles, 44 different scientific journals.
The determinants are the number of pages, number of authors, average number of different affiliations and average number of different countries per article. Four hypotheses were descripted, each one related to each determinant. These hypotheses are tested to all the journals together and tested for the upper (Q1 versus Q2) and lower quarters (Q3 versus Q4), using those quartiles as proxy. To test the hypotheses, a binary Logistic regression model is applied.
The conclusions are different according with the sample chosen. When all the sample is pooled, an article with more pages and a higher diversity of academic affiliations but lower number of authors and less diversity of country has a bigger probability to be published in a journal from Q1 or Q2 quarter. If the sample considers only Q1 and Q2, an article with more pages and more diversity in affiliations has more probability to be published in a journal from Q1. If the sample considers only Q3 and Q4, an article with less pages and authors but more different affiliations have more probability to be published in a Q3 quarter.
RESUMO
O objetivo desta dissertação é identificar alguns determinantes que podem explicar a probabilidade de um artigo ser publicado numa revista indexada no SCimago Journal Rank, também conhecido como Scopus. A análise abrange apenas a categoria de “Contabilidade” e inclui revistas da região geográfica Europeia entre 2010 e 2015. A amostra totaliza 8 326 artigos, de 44 revistas científicas diferentes.
Os determinantes testados são o número de páginas, número de autores, número médio de filiações diferentes e número médio de países diferentes por artigo. Foram descritas quatro hipóteses, cada uma relacionada com cada determinante. Essas hipóteses são testadas para todas as revistas em conjunto e depois testadas para os quartis superiores (Q1 versus Q2) e inferiores (Q3 versus Q4), usando esses quartis como proxies. Para testar as hipóteses, é aplicado um modelo de regressão logística binária.
As conclusões são diferentes de acordo com a amostra escolhida. Quando toda a amostra é agrupada, um artigo com mais páginas e uma maior diversidade de afiliações acadêmicas, mas um número menor de autores e menos diversidade de países, tem uma maior probabilidade de ser publicado numa revista do primeiro ou segundo quartil. Se a amostra for Q1 e Q2, um artigo com mais páginas e mais diversidade de filiações terá mais probabilidade de ser publicado numa revista de Q1, de acordo com o ranking Scopus. Se a amostra considerar apenas Q3 e Q4, um artigo com menos páginas e autores, mas com filiações diferentes, terá mais probabilidade de ser publicado no trimestre Q3.
2. LITERATURE REVIEW 5
2.1. Rankings 5
2.2. Determinants of being ranked according to past research 6
3. RESEARCH QUESTIONS AND HYPOTHESES DEVELOPED 9
4. RESEARCH DESIGN 10
4.1. Data and methodology 10
4.1.1. Data 10
4.1.2. Methodology 15
4.2. Research model 16
5. RESULTS AND DISCUSSION 18
5.1. Descriptive results and discussion 18
5.2. Analysis of the Logit regression model and discussion 24
6. CONCLUSIONS AND FUTURE RESEARCH 28
1. INTRODUCTION
Publications in scientific journals have increased and the importance of being part of a ranking has amplified over the years. Several studies have been carried out about the importance of this status. Some of them analyze the elite degree and elite affiliation (Chan et al., 2007), or the international accounting researchers performance (Prather-Kinsey et al., 2004), which justified the importance that some attributes can have when researchers show to all the academia the output of their work.
According with Chan et al. (2013) and Altbach (2015) these rankings bring important information for national governments (for granting purposes), directors of companies (for financing research), faculties (for prestige), students (for competition) and donors (for specific reasons). These can be extremely valued to different organizations, especially to universities, who use their position on important rankings to present and advertise their programs and highlight their quality capturing the attention of the best researchers and the best students.
Particularly in the Accounting field, there are some studies analyzing the importance of rankings with some specific attributes, namely, the ranking of accounting programs and the elite effect in accounting (Chan et al., 2007) and the placement (Stammerjohan and Hall, 2002), the region where research is conducted (Hasselback and Reinstein, 1995), the level of citation (Brown, 1996; Prather-Kinsey et al., 2004; Chan et al., 2013).
One of the types of rankings more important to academics is the one that capture the quality of the papers where they publish the outputs of the researches they are doing. So, the majority of the academics and the respective universities desire to publish in the best quality journals, and the journals are indexed in prestigious rankings. So, one easy and direct way to value the quality of one published paper is to know in which journal is published based on the ranking where that journal is (not) ranked. There are some attributes of the papers that can be related or not with the probability of contribute to higher positions in rankings. In fact, when a person downloads a paper for the first time
the information that is immediately captured is who are the authors, where are they working and if it is a long or a short paper. However, these attributes are not usually included in the past researches about determinants of the rankings covering published papers. As such, and in order to contribute to the debate around the importance of publish in an outlet indexed in a recognized ranking, this dissertation intends to identify and evaluate indexing determinants that may influence a ranking position. To do this, the dissertation is supported in papers indexed in Scopus, in the field of accounting, covering the period from 2010 to 2015, totalizing 6 years of analysis. Thus, the sample includes a total of 8 326 papers comprising 44 different scientific journals.
The determinants under the analyses include the number of pages, the number of authors, the average of number of different affiliations and the average of number of different countries per article. Two different analyses are performed. Firstly, the analysis considers all the papers together to identify which determinants may influence the probability of being tanked in upper indexes (Q1 and Q2) as compared to the lower indexes (Q3 and Q4) as a proxy for the best quality. There is a positive relation between all determinants and the probability of being indexed in Q1 and Q2 quarters, when analyzed one by one. However, all together, results suggest that the higher the number of pages and the higher number of different affiliations per article, the higher the probability of being on a higher quality paper. The opposite occurs for number of authors and the number of different countries per article. All the determinants are considered as statistically significant to this analysis.
Secondly, the sample is divided into two groups: one group only with the upper levels (Q1 and Q2), and another group just with the lower ones (Q3 and Q4). The model was repeated separately for each group, given that within each one the quality of the paper also could be compared using the upper and lower quarter. Taking these results into account, the probability of an articled be published in a Q1 quarter (as compared to Q2) is larger when the article has more pages and a more diversity regarding different affiliation. On the contrary, the probability of an article be indexed in a Q3 quarter increases (as compared to Q4) when have less pages and authors but with different
affiliations.
This paper is organized in 5 sections. The first one provides a literature review. The second is the research questions and hypotheses that will be analyzed. Third is the research design – presenting the data that was the origin of this analysis and the methodology where it is listed all the steps done. Section 4 is the results and discussions of them, followed by section 5, the last, where the conclusions are presented, some limitations and future topics.
2. LITERATURE REVIEW 2.1. Rankings
A ranking is a list in which there is an order based on the evaluation of one or more attributes. These rankings are meant to help understand the course and direction of an institution, can it be academic, government or even the private sector.
According with Altbach (2015) and regardless of its purpose, they are useful in different ways. For example, they are used by a number of third parties like Governments who want to know how best to invest their resources and need to be able to differentiate among a large number of institutions. Also for academic rankings, the attributes used to constitute a ranking are, normally, external funding, number of articles and books written by faculty members with advanced degrees, and quality of students. Journals publication also can lead to promotion and tenure to money rewards. “Publishing in a journal that is on a journal list does provide some weight or legitimacy to the publication and thereby assists in promoting the academic’s career, yields monetary awards, or is in other ways beneficial to the academic” (Black and Stainbank, 2017:1).
Vogel et al. (2017) concludes that journal rankings reflect the preferences of its members from the scientific community that review the quality of a research, influenced by the policies and journal’s criteria implemented. This kind of behavior can conduct to a less diversity to innovation and different perspectives.
There are several journal rankings (e.g., SCImago Journal Ranking, ISI web of Knowledge, ASB rankings,), all of them with different degrees of interest according to the type of user of that information. One of the most important is the SCImago Journal Ranking, also known as Scopus, that has a publicly available portal that includes the journals and country scientific indicators developed from the information contained in the Scopus® database (Elsevier B.V.). SCImago Journal and Country Rank do not only have journals ranks, as also have country ranks and viz tools. This ranking have some indicators like the type of document (that does not count to evaluate the journals, only to separate between all), total of documents in the specific year, total of documents in 3
years, total of references, total of references in 3 years, total of cites in 3 years, the relation between cites and documents in 2 years and the relation between references and documents. This information is possible to verify on the website, including downloading.
The SCImago Journal and Country Rank, intends to rank the scientific journals with a measure of journal’s impact, influence or prestige. It expresses the average number of weighted citations received in the selected year by the documents published in the journal in the three previous years. Some information about the papers indexed includes the publisher country, the subject area and category, the publisher, the publication type (in this case: Type Journals), ISSN, coverage and scope - a short presentation about the journal. The research supported by this dissertation is based on the papers in SCImago journal ranking as a major source to identify attributes that may influence the probability of that indexation.
2.2. Determinants of being ranked according to past research
In this section some possible determinants that may explain the probability of a higher indexation in one ranking are going to be presented based on past research. However, this earlier research is scarce because the majority presents descriptive information about top authors and top universities, but not exactly the findings on the relationship between those, or others, indicators and the rankings. However, when an academic download a paper for the first time the information that is immediately captured is who are the authors, where are they working and if it is a long or a short paper. The next paragraphs explain the potential importance of this information.
Authors’ affiliation
Authors’ affiliation is the institution to which an author appears associated. This may be a university the author graduated, where teaches or were works.
According with Voger et al. (2017) the distribution of scientific journals is not equally for all geographical areas or educational institutions. Hodgson and Rothman (1999) concluded that most authors’ publications are mostly from U.S. or U.K. based, which can be explained with the fact, among others, that English has become one of the main languages of publications.
The author’s affiliation not only contributes to promotions and tenure to money rewards (Black and Stainbank, 2017) but also to empowerment an educational institutions name.
Co-authorship
It is not important just the author’s affiliation but also the co-authorship of the articles. Macdonald and Kam (2007) and Mingers and Xu (2010) suggest that the number of authors and their institutional affiliations are related to the quality of journals in which their work is published.
Co-authorship means more expert knowledge, intellectual abilities, writing skills, and overall publishing experience as compared to single authors, which contributes to a bigger impact in terms of contributions (Voget et al., 2017). The co-authorship is considered as a sign of socialinteraction and strives for visibility and status (Voget et al. 2017), contributing also to enhance the network, increasing the possibility to be cited in more articles (Leimu and Koricheva, 2005).
Prather-Kinsey et al (2004) state that between 1981 and 200 there was a growing trend of authorship jointing foreign authored articles, being a significant competition from non-U.S. authors publishing in academic scientific journals. As well, almost 65% of the international accounting research is single or joint a foreign author.
According with Macdonald and Kam (2007), co-authorship is highly recommended if the authors intend to be published in a high-quality journal. This conclusion was based on the positive impact of co-authorships on the ratings of journals “from a bibliometric study
by Aksnes (2003) who found that highly cited papers are more often the result of collaborative research than papers with lower citation frequencies” (Voget et al., 2017).
Number of pages
The determinant number of pages is not usually used to performed researches analysis regarding the quality, influence or even the impact that some articles may have in Accounting field. However, several journals require a maximum number of words, and authors must have this in mind when they are choosing the style of the written text and when they are effectively writing the paper before submission, and that may influence.
Countries where universities are located
There are some past research using the geographic zone to rank the higher education institutions, due to the importance of be well succeed in the competition for funding for governments (e.g., Chan et al., 2013). Other studies focus in regions to evaluate the performance of researchers (e.g., Prather-Kinsey and Rueschhoff, 2004). These researches concluded, for the study period, that the co-authorship between domestic and foreign authors is increasing and this behavior will inspire a grown in foreign research instead of single domestic authorship.
There are also some studies that focus only in one country but compared with all the other countries. Bukowska et al. (2014) study the trend in international co-authorship and compare with the tendencies in Poland. Through this analysis, it is possible to verify that co-authorship is increase but between Polish co-authors and not with international authors.
Voget et al. (2017) affirm that the number of journals is not the same for all countries and institutions. Hudgson and Rothman (1999) found that the institutions with more publications were essentially U.S.-based – a phenomenon which they refer to as “institutional oligopoly”.
3. RESEARCH QUESTIONS AND HYPOTHESES DEVELOPED
In order to analyze determinants of being ranking in a recognized Index system, using the SCImago Ranking, some descriptive questions are formulated, specifically:
1) Which country is most and less often mentioned in the authors' affiliation?
2) How many educational Institutions in each country are engaged in the authorship of a paper?
3) Which Education Institution is the most and less mentioned in the authors' affiliation?
After having the answers for these three descriptive questions, the following hypotheses are tested to identify determinants of indexation in Scopus, particularly in the Accounting area:
1) H1: The number of authors affects the probability of being indexed in a higher quarter ranking;
2) H2: The number of pages affects the probability of being indexed in a higher quarter ranking;
3) H3: The number of affiliations per article affects the probability of being indexed in a higher quarter ranking;
4) H4: The number of countries per article affects the probability of being indexed in a higher quarter ranking.
4. RESEARCH DESIGN 4.1. Data and methodology
4.1.1. Data
The objective of this dissertation is to identify and evaluate indexing determinants of the probability of indexation in one of the most important journal rankings: the SCImago, or Scopus, ranking of scientific journals, specifically in the area of Accounting, and published only in the European geography.
The data is collected from different electronic sources. The articles ranking is available on SCImago Lab1, the articles (papers) are available on B-on website2 and the affiliation is collected from Scopus Preview3 or directly from the paper or the curriculum vitae of the authors when necessary.
The reason for choosing the SCImago Lab. ranking was due to the fact that is trustable, including “the journals and country scientific indicators developed from the information contained in the Scopus database (Elsevier B.V.)”4. With this information it is possible to
classify the accounting journals based on a quality ranking, on a scale of quarters from Q1 to Q4, where Q1 means that the scientific journal is better rated that Q4.
B-on website5 is an online library of knowledge that provides unlimited and permanent access to scientific journals and related articles. With this information it was possible get data such as article name, authors and number of pages.
Since SCImago Lab. database uses information contained in the Scopus® database (Elsevier B.V.), and information about affiliation of the authors of the page is directly collected from this database.
In this thesis, thus, information is collected for the 52 accounting journals ranked from Q1 to Q4 for a period of 6 years, from 2010 to 2015, for the category of “Accounting” on
1 See http://www.scimagojr.com/. 2 See http://www.b-on.pt/. 3 See https://www.scopus.com/.
the subject area of “Business, Management and Accounting” in the Western and Eastern Europe. Data about titles, names, authors’ names, data source, number of pages, number of authors and the respective affiliation of each one is collected.
The first set of journals collect is the following:
1. Journal of Finance
2. Review of Financial Studies 3. Journal of Financial Economics 4. Journal of Accounting and Economics 5. Journal of Accounting Research
6. Journal of Financial and Quantitative Analysis 7. Mathematical Finance
8. Journal of Industrial Economics
9. Accounting, Organizations and Society 10. World Bank Economic Review
11. ASTIN Bulletin
12. Journal of Risk and Uncertainty 13. Real Estate Economics
14. Journal of Risk and Insurance 15. European Financial Management
16. Journal of Real Estate Finance and Economics 17. Journal of Technology Transfer
18. Fiscal Studies
19. Work, Employment and Society 20. European Accounting Review 21. World Economy
22. Accounting, Auditing and Accountability Journal 23. Journal of Financial Research
24. Journal of Accounting Education
26. Journal of Business Finance and Accounting 27. Accounting Education
28. Journal of International Accounting, Auditing and Taxation 29. Accounting and Business Research
30. International Journal of Banking, Accounting and Finance 31. Accounting History
32. Journal of Financial Services Research
33. Geneva Papers on Risk and Insurance: Issues and Practice 34. International Journal of Accounting
35. GENEVA Risk and Insurance Review 36. Risk Management and Insurance Review
37. Journal of International Financial Management and Accounting 38. Journal of European Real Estate Research
39. Accounting History Review 40. Australian Accounting Review
41. International Journal of Accounting, Auditing and Performance Evaluation 42. Zeitschrift für die gesamte Versicherungswissenschaft
43. Journal of Contemporary Accounting and Economics 44. Revista Espanola de Financiacion y Contabilidad 45. International Journal of Disclosure and Governance 46. Intangible Capital
47. Afro-Asian Journal of Finance and Accounting 48. Accounting Research Journal
49. International Journal of Managerial and Financial Accounting 50. Asian Review of Accounting
51. Revista de Contabilidad
52. Journal of Business Valuation and Economic Loss Analysis
However, for eight journals was not possible to collect data regarding articles name, authors and number of pages because some of them were pay-for-view, or the download
basis for the research of this dissertation. Additionally, to select the previously journals to analyze, identify and evaluate indexing determinants, some criteria were used, namely:
• Only scientific journals included during the 6 years in Scopus ranking are being analyzed;
• The journal ranking is extracted from SCImago Lab6 - Scopus ranking source, selecting area (“Business, Management and Accounting”), subject categories (“Accounting”), region (Western Europe) and type (journals). This extraction was made 6 times, one for each year, since 2010 to 2015.
For this type of analysis, some comments must be highlighted. Regarding the authors’ affiliation, and as in Chan et al. (2007), one of the caveats identify to a similar study was the fact “that not all the authors belong to an accounting faculty”, which does not invalidate the fact that “accounting faculty members write a vast majority of the articles published in these journals”. Another one is that not all of the authors are from the accounting area. They may also be from similar areas such as finance, economics, auditing, among others. Regarding the number of pages, this criterion is not completely practical once some scientific journals have a limit of pages and/or number of words. Another reason is the fact that the layout of the pages may be different between journals, which does not make possible an accurate comparison (for example, one page can have more than one column). However, these comments do not have a direct influence in the results afterwards.
Table 1 presents information about the name of the journal, the name of publisher and the respective country of all the journals that are included in the research. As shown, the country with the most publishers is England with a total of 12 publishers, including 30 journals.
Table 1 List of scientific journals by country and by publisher.
Country Publisher Journal
Germany
Walter de Gruyter GmbH & Co. KG
Journal of Business Valuation and Economic Loss Analysis
Springer Verlag Zeitschrift für die gesamte Versicherungswissenschaft
Netherlands
Elsevier BV
Journal of Financial Economics Journal of Accounting and Economics
Journal of Contemporary Accounting and Economics
Elsevier Espana Revista de Contabilidad
Kluwer Academic Publishers
Journal of Risk and Uncertainty
Journal of Real Estate Finance and Economics Journal of Financial Services Research Technology Transfer Society Journal of Technology Transfer
Spain
Intangible Capital Intangible Capital Asociacion Espanola de
Contabilidad y Administracion de Empresas, AECA
Revista Espanola de Financiacion y Contabilidad
Switzerland Inderscience Publishers
International Journal of Banking, Accounting and Finance International Journal of Managerial and Financial Accounting
England
Blackwell Publishing Inc.
Journal of Finance
Journal of Accounting Research Mathematical Finance
Journal of Risk and Insurance Real Estate Economics World Economy
Journal of Industrial Economics
Journal of Business Finance and Accounting
Geneva Papers on Risk and Insurance: Issues and Practice Journal of Financial Research
Australian Accounting Review
Journal of International Financial Management and Accounting
Emerald Group Publishing Ltd.
Journal of European Real Estate Research Accounting Research Journal
Asian Review of Accounting
International Journal of Accounting, Auditing and Performance Evaluation
Institute of Chartered Accountants in England an Wales
Accounting and Business Research
John Wiley & Sons Inc. International Journal of Finance and Economics Oxford University Press Review of Financial Studies World Bank Economic Review
Pergamon Press Ltd.
Journal of International Accounting, Auditing and Taxation Journal of Accounting Education
International Journal of Accounting
Routledge Accounting History Review
SAGE Publications Work, Employment and Society Accounting History Taylor and Francis Inc. Accounting Education
Tieto, Ltd ASTIN Bulletin
University of Washington Journal of Financial and Quantitative Analysis
4.1.2. Methodology
Once the objective of this dissertation is to identify and evaluate indexing determinants in the Scopus Ranking, it is necessary to examine each article in the scientific journals. Thus, the relevant data to collect is the article name, the authors’ name, dates of publications (year and month), and number of pages, number of authors and the respective affiliation. These data is manually extracted from B-on website, article-by-article. All this data is separated in an Excel file, one file for each scientific journal and one year per sheet. This kind of frame was important in terms of organization. This part of the process was done 44 times, giving 44 files.
In a second phase, the only data that was missing was the authors’ affiliation. This data is collected from Scopus database for authors’ profile – Scopus Preview. During this phase of the process, some problems need to be solved. The authors that have the same affiliation, but in SCImago Lab database appears with different denominations for the
same university, were identified in order to conciliate. The authors that did not have their affiliations on Scopus Authors Preview, were added based on their online curriculum vitae or directly collected from a footnote on the article. The authors whose affiliation was based in their current education institutions remain, but if the affiliation was not an academic institution, the paper was not considered. In a third phase, all the excel files were compiled in one single excel file.
4.2. Research model
To test our hypotheses, a binary Logistic regression model is applied. Multivariable regression analysis allows studying multiple independent variables at the same time, with adjustment of their regression coefficients for possible relation between variables.
To identify how the probability of some attributes does affect the probability of be indexed in a higher quarter and, thus, the quality of the journal, the following model is going to be tested:
𝑃 𝑄 = 𝛽0 + 𝛽1 𝐿𝑛 𝑁𝑃 + 𝛽2 𝑁𝐴 + 𝛽3 𝐴𝐴 + 𝛽4 𝐴𝐶 + 𝑌𝑒𝑎𝑟 + 𝜀0 (1)
Where:
● Q is the dependent variable, assuming the value of 1 or 0 according to the type of quarter (1 for upper levels and 0 otherwise);
● NP is the independent variable that measures the number of pages, and it is measured using the natural logarithm of this number;
● NA is the independent variable that measure the number of authors;
● AA is the independent variable that measures the average of different authors’ affiliations, per article;
● AC is the independent variable that measures the average of different countries authors’ affiliations, per article.
each year of observations, for the period between 2010 and 2015;
The coefficients 𝛽i (where i is equal to 1, 2, 3 and 4) are real constants of the independent variables. In case the value of 𝛽i is positive it means that when the value of the independent variable is positive, there is positive influence on the probability of be indexed in an upper Q. If the value of 𝛽(𝑖) decreases, the value of Log (i) also decreases; 𝜀0 is the marginal error.
So, the coefficient of determination describes the overall relationship between the independent variables Xi (number of pages, number of authors, the average of affiliation per article and the average of countries per article) and the dependent variable Q. It corresponds to the square of the multiple correlation coefficients, which is the correlation between Q and NP, NA, AA and AC.
5. RESULTS AND DISCUSSION
5.1. Descriptive results and discussion
The first analysis to be performed is general, taking into account the whole sample, which means, the scope of the 5 years (from 2010 to 2015), the 44 scientific journals and a total of 8 326 articles.
Table 2 Descripted analysis of determinants Number of pages Number of authors Number of different affiliations Number of different countries Average 24,19 2,28 1,86 1,40 Median 23,00 2,00 2,00 1,00 Error deviation 12,150 0,952 0,846 0,600 Variance 147,628 0,906 0,716 0,360
Table 2 provides information about descriptive results of the determinants. The average of number of pages is 24,19. The most of the articles have around 2,28 authors, with 1,86 average of different affiliations and 1,40 different countries.
Table 3 Pearson correlation.
Q NP NA AA AC Q 1 NP 0,168** 1 NA 0,048** 0,145** 1 AA 0,144** 0,150** 0,720** 1 AC 0,059** 0,087** 0,424** 0,611 1
** Statistical significant at 0.01 level
Table 3 presents the Pearson correlations between the variables. All of them are positively related at 0,01 level. However, the coefficient of correlation is always lower
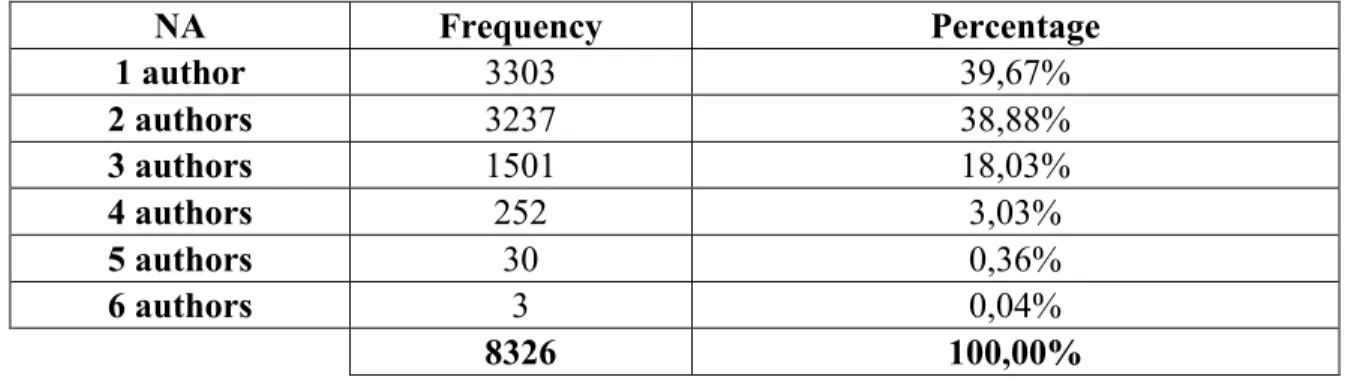
Several descriptive information about number of authors and number of pages is presented. According with table 4, most of the articles in this sample have up to 3 authors. However, about a half is just 1 or 2 authors (48,55%). Number of authors greater than 3 are not so common, with only the percentage of 3,42%.
Table 4 Summary analyses for Number of authors (NA)
NA Frequency Percentage 1 author 3303 39,67% 2 authors 3237 38,88% 3 authors 1501 18,03% 4 authors 252 3,03% 5 authors 30 0,36% 6 authors 3 0,04% 8326 100,00%
Table 5 Summary analyses for Number of countries (NC)
NC Frequency Percentage 1 country 5467 66% 2 countries 2399 29% 3 countries 396 5% 4 countries 62 0% 5 countries 2 0% 8326 100%
According to Table 5, most of the articles have only one country between the author´s affiliations (66%). This means that even that a paper has more than one authors from more than one academic institution, about 2/3 of the papers have authors from universities of the same county. The sample does not include any paper where authors from 4 or more countries are engaged.
the following.
Question 1: Which country is most and less often mentioned in the authors' affiliation? Table 6 shows that country most often mentioned in the author’s affiliation is the United States of America (USA) with 7 669 papers, followed by England (1 951), and Australia (1 350). If we compare to a total of 18 986 authors in the entire sample, USA corresponds to 40,39%, England to 10,28% and Australia to 7,11%. It is interesting to note that even in Journals published in Europe, the great majority of authors are affiliated in USA’s academic institutions. Other countries belonging to this top 10 most often mentioned includes Germany, Spain, Canada, Italy, France, the Netherlands and China.
There are some countries only mentioned once along the period of 2010 to 2015, namely, Ecuador, Estonia, Ethiopia, Indian Ocean, Iraq, Kyrgyzstan, Monaco, Morocco, Nepal, Philippines, Porto Rico, Sierra Leone, Uganda, Ukraine, Venezuela and Yemen. Table 5 details this information.
Table 6 Summary analyses for the most mentioned Countries
Countries Nr. of references Nr. of universities Nr. of references/ nr. of univers.
USA 7 669 359 21 England 1 951 88 22 Australia 1 350 37 36 Germany 872 88 10 Spain 860 71 12 Canada 655 38 17 Italy 433 54 8 France 421 54 8 Netherlands 404 15 27 China 386 55 7
Table 6 also shows information about the number of universities that are mentioned in the total number of papers analyzed. This information is useful for the second question,
answered afterwards.
Question 2: How many educational Institutions in each country are engaged in the authorship of a paper?
Table 6 also shows that the country most often mentioned in the authors’ affiliation (USA) also has the higher number of different universities engaged in the publication (359 different universities), followed by England and Germany both with 88 (6,11%) and Spain with 71 (4,93%). The number of universities for the top 10 countries varies. But the last column presents the number of times that a country is refereed in paper divided by the number of universities of that country. This indicator reveals that Australia, Netherlands, and England have a higher number of references by university. So, even if the number of universities is lower, authors of those universities are being well succeeded in the number of publications.
Table 6 and Table 7 presents detailed information for every country. While Table 7 shows the number of times that a country in mentioned in the authors’ affiliation in all the articles, with a total of 18 986 times, Table 7 evidences that a total of 1440 different educational institutions are mentioned in the sample considering the total of 8 326 papers. These educational institutions are located in different countries. So, these two tables help to understand if the countries more often mentioned in the papers have a big or a small number of universities mentioned in the authors’ affiliation.
Table 7 Number of times a country is mentioned (2010-2015) Countries Nr. of references References (%) Countries Nr. of references References (%) Countries Nr. of references References (%) (alphabetical order) (alphabetical order) (alphabetical order)
Argentina 9 0,05% Iraq 1 0,01% Qatar 17 0,09%
Australia 1 350 7,11% Ireland 102 0,54% Romania 15 0,08%
Austria 79 0,42% Israel 85 0,45% Russia 12 0,06%
Bahrain 6 0,03% Italy 433 2,28% Saudi Arabia 42 0,22%
Bangladesh 11 0,06% Jamaica 3 0,02% Scotland 48 0,25%
Belgium 139 0,73% Japan 140 0,74% Serbia 4 0,02%
Brazil 45 0,24% Jordan 5 0,03% Sierra Leone 1 0,01%
Canada 655 3,45% Jordanian 3 0,02% Singapore 236 1,24%
Chile 25 0,13% Kazakhstan 6 0,03% Slovakia 3 0,02%
China 386 2,03% Kenya 4 0,02% Slovenia 19 0,10%
Colombia 12 0,06% Kuwait 2 0,01% South Africa 54 0,28%
Cyprus 18 0,09% Kyrgyzstan 1 0,01% South Korea 161 0,85%
Czech Republic 14 0,07% Latvia 4 0,02% Spain 860 4,53%
Denmark 113 0,60% Lithuania 2 0,01% Sri Lanka 11 0,06%
Ecuador 1 0,01% Luxembourg 10 0,05% Sudan 2 0,01%
Egypt 9 0,05% Malaysia 268 1,41% Sweden 139 0,73%
England 1 951 10,28% Malta 2 0,01% Switzerland 365 1,92%
Estonia 1 0,01% Mexico 15 0,08% Taiwan 330 1,74%
Ethiopia 1 0,01% Monaco 1 0,01% Thailand 17 0,09%
Fiji 7 0,04% Morocco 1 0,01% Tunisia 86 0,45%
Finland 87 0,46% Nepal 1 0,01% Turkey 67 0,35%
France 421 2,22% Netherlands 404 2,13% Uganda 1 0,01%
Germany 872 4,59% New Zeland 179 0,94% Ukraine 1 0,01%
Ghana 10 0,05% Nigeria 15 0,08% United Arab Emirates 47 0,25%
Greece 103 0,54% Norway 58 0,31% Uruguay 6 0,03%
Hong Kong 359 1,89% Oman 2 0,01% USA 7 669 40,39%
Hungary 14 0,07% Pakistan 13 0,07% Venezuela 1 0,01%
Iceland 10 0,05% Peru 3 0,02% Vietnam 5 0,03%
India 90 0,47% Philippines 1 0,01% Yemen 1 0,01%
Indian Ocean 1 0,01% Poland 31 0,16% Zambia 3 0,02%
Indonesia 22 0,12% Porto Rico 1 0,01% Zimbabwe 2 0,01%
Iran 9 0,05% Portugal 135 0,71% TOTAL 18 986 100,00%
Table 8 Number of times an education institution is mentioned, by county (2010-2015)
Countries Nr. of educational institutions per country Nr. of educational institutions per country (%) Countries Nr. of educational institutions per country Nr. of educational institutions per country (%) Countries Nr. of educational institutions per country Nr. of educational institutions per country (%)
Argentina 6 0,42% Iraq 1 0,07% Qatar 1 0,07%
Australia 37 2,57% Ireland 7 0,49% Romania 4 0,28%
Bahrain 1 0,07% Italy 54 3,75% Arabia Saudi 15 1,04%
Bangladesh 6 0,42% Jamaica 1 0,07% Scotland 4 0,28%
Belgium 10 0,69% Japan 35 2,43% Serbia 2 0,14%
Brazil 15 1,04% Jordan 4 0,28% Sierra Leone 1 0,07%
Canada 38 2,64% Jordanian 1 0,07% Singapore 6 0,42%
Chile 5 0,35% Kazakhstan 2 0,14% Slovakia 1 0,07%
China 55 3,82% Kenya 3 0,21% Slovenia 2 0,14%
Colombia 5 0,35% Kuwait 3 0,21% Africa South 8 0,56%
Cyprus 4 0,28% Kyrgyzstan 1 0,07% South Korea 38 2,64%
Czech Republic 4 0,28% Latvia 2 0,14% Spain 71 4,93%
Denmark 6 0,42% Lithuania 2 0,14% Sri Lanka 6 0,42%
Ecuador 1 0,07% Luxembourg 1 0,07% Sudan 1 0,07%
Egypt 6 0,42% Malaysia 20 1,39% Sweden 20 1,39%
England 88 6,11% Malta 1 0,07% Switzerland 13 0,90%
Estonia 1 0,07% Mexico 8 0,56% Taiwan 39 2,71%
Ethiopia 1 0,07% Monaco 1 0,07% Thailand 8 0,56%
Fiji 2 0,14% Morocco 2 0,14% Tunisia 10 0,69%
Finland 12 0,83% Nepal 1 0,07% Turkey 24 1,67%
France 54 3,75% Netherlands 15 1,04% Uganda 1 0,07%
Germany 88 6,11% New Zeland 8 0,56% Ukraine 1 0,07%
Ghana 3 0,21% Nigeria 9 0,63% United Arab Emirates 10 0,69%
Greece 13 0,90% Norway 13 0,90% Uruguay 2 0,14%
Hong Kong 10 0,69% Oman 2 0,14% USA 359 24,93%
Hungary 4 0,28% Pakistan 7 0,49% Venezuela 2 0,14%
Iceland 2 0,14% Peru 1 0,07% Vietnam 3 0,21%
India 42 2,92% Philippines 1 0,07% Yemen 1 0,07%
Indian Ocean 1 0,07% Poland 8 0,56% Zambia 1 0,07%
Indonesia 8 0,56% Porto Rico 1 0,07% Zimbabwe 1 0,07%
Iran 4 0,28% Portugal 20 1,39% TOTAL 1 440 100,00%
Question 3: Which Education Institution is the most mentioned in the authors' affiliation?
After knowing the country most often mentioned, and the number of universities of each country, it is important to identify the academic institutions more often mentioned in the author’s affiliation. Table 9 evidences the top 10 universities from the total of 1 440, considering the number of times they are mentioned in the 8 326 papers of the sample. University of California (USA), University of London (England) and University of Texas (USA) are the three most refereed universities from the top 10 presented.
Table 9 Summary analyses for the most mentioned educational institutions
Educational Institutions Nr. of references
University of California 406
University of London 313
University of Texas 267
Harvard University 217
University of Pennsylvania 193
New York University 179
University of Chicago 175
Columbia University 148
University of North Carolina 147
Stanford University 134
Other universities 16 794
Total number of universities 1 444
5.2. Analysis of the Logit regression model and discussion
Results for the logit regression model are presented subsequently. The hypotheses under test are related with the identification of a possible determinants of the probability of be indexed in an upper quarter of quality in the Scopus, compared with the lower ones.
Firstly, the Equation (1) is run in a step-by-step basis to the full sample. In this first analyze, the independent variable Q assumes 1 if the journals belong to Q1 and Q2 (the upper quality) and 0 if they belong to Q3 and Q4. Table 11 presents the results. The table has a double column for each of the 4 hypotheses created (with the value and the statistical significance of each coefficient), one for each determinant, and at the end all the independent variables are included.
Table 10 Results for logit regression model
H1 H2 H3 H4 ALL
B Sig B Sig B Sig B Sig B Sig
Constant -0,842 0,000 0,908 0,000 0,391 0,000 0,845 0,000 -0,937 0,000
NP 0,676 0,000 0,634 0,000
NA 0,125 0,000 -0,326 0,000
AA 0,447 0,000 0,731 0,000
AC 0,252 0,000 -0,243 0,000
Year YES YES YES YES YES
Nr. Observation 8326 8326 8326 8326 8326 R2 Nagerlkerke 0,043 0,04 0,033 0,006 0,078
Q is the dependent variable, assuming the value of 1 or 0 according to the type of quarter (1 for upper levels and 0 otherwise); NP is logarithm of the number of pages; NA is the independent variable that measure the number of authors; AA is the average of different authors’ affiliations, per article; AC is the average of different countries authors’ affiliations, per article.𝑌𝑒𝑎𝑟 is a dummy variable to control the year effects.
Considering hypothesis 1 (H1), results show that the higher the number of pages, the higher the probability of be indexed in journals from Q1 and Q2. The same relation appears to all the other determinants when tested one by one, revealing a positive relation with the probability of being indexed to Q1 and Q2 quarters.
However, all together, results suggest that the higher number of pages and the higher the number of different affiliations per article, the higher the probability of be a higher quality paper. The opposite occurs for the number of authors and the number of different countries per article. All the determinants are statistically significant at 1% level in all the analysis. Because of different relations between dependent and independent variables occurs, additionally analysis is done.
So, secondly, the sample is split into two different groups, and the Equation (1) is run separately in each group: Journals belonging to Q1 and Q2, and Journal belonging to Q3 and Q4.
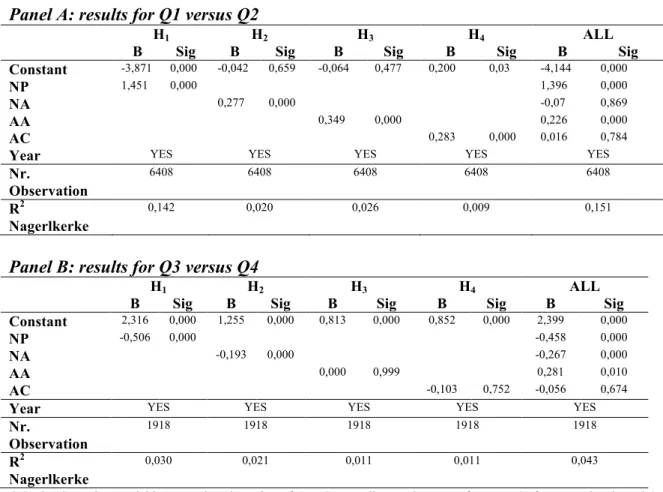
Considering the group of upper quality, the Equation (1) is run considering that Q assumes 1 when the journals belong to Q1 and 0 when the journals belong to Q2. Results are presented in Panel A of Table 10. The same positive relationship is found on the
previous analysis is also evident when the independent variables are added one-by-one. However, the last column reveals that when all the independent are added at the same time, only the number of pages and the average number of different academic institutions engaged in the paper contributes to the higher probability of be indexed on the best level quality (when compared to Q2), while the number of authors (NA) and the number of different countries per article are not statistically significant. Taking these results into account, the probability of an articled be published in a Q1 quarters is larger when the article has more pages and a more diversity regarding different affiliation.
These results contribute to reinforce that the co-authorship between domestic and foreign authors is increasing and this behavior will inspire a grown in foreign research instead of single domestic authorship (Prather-Kinsey and Rueschhoff, 2004).
Table 11 Logit regression – sample split Panel A: results for Q1 versus Q2
H1 H2 H3 H4 ALL
B Sig B Sig B Sig B Sig B Sig
Constant -3,871 0,000 -0,042 0,659 -0,064 0,477 0,200 0,03 -4,144 0,000
NP 1,451 0,000 1,396 0,000
NA 0,277 0,000 -0,07 0,869
AA 0,349 0,000 0,226 0,000
AC 0,283 0,000 0,016 0,784
Year YES YES YES YES YES
Nr. Observation 6408 6408 6408 6408 6408 R2 Nagerlkerke 0,142 0,020 0,026 0,009 0,151
Panel B: results for Q3 versus Q4
H1 H2 H3 H4 ALL
B Sig B Sig B Sig B Sig B Sig
Constant 2,316 0,000 1,255 0,000 0,813 0,000 0,852 0,000 2,399 0,000
NP -0,506 0,000 -0,458 0,000
NA -0,193 0,000 -0,267 0,000
AA 0,000 0,999 0,281 0,010
AC -0,103 0,752 -0,056 0,674
Year YES YES YES YES YES
Nr. Observation 1918 1918 1918 1918 1918 R2 Nagerlkerke 0,030 0,021 0,011 0,011 0,043
Q is the dependent variable, assuming the value of 1 or 0 according to the type of quarter (1 for upper levels and 0 otherwise); NP is logarithm of the number of pages; NA is the independent variable that measure the number of
Considering the group of lower quality, the Equation (1) is run considering that Q assumes 1 when the journals belong to Q3 and 0 when the journals belong to Q4. Results are presented in Panel B of Table 11. Now, the relation between the determinants and the probability of be indexed in a upper level quartile, but now the Q3 (when compared to Q4) is negative, except for the number of different affiliations per article that has no statistical significance. When all the determinants are added one-by-one, the relation between the number of pages and the number of authors is negative, but positive for the number of different affiliations. Thus, the probability of an article be indexed in a Q3 quarter increases, when compared to Q4, when the paper has less pages and a lower number of authors, but with different affiliations.
These results contribute to underline Macdonald and Kam (2007) and Mingers and Xu (2010) suggest that the number of authors and their institutional affiliations are related to the quality of journals in which their work is published. Also reinforce Prather-Kinsey et al (2004) concluding that there was a growing trend of authorship jointing foreign-authored articles.
6. CONCLUSIONS AND FUTURE RESEARCH
The objective of this dissertation is to identify some determinants that could explain the probability of a paper be published in a journal that is indexed in a prestigious ranking. Thus, the SCimago Journal Rank, also well known as Scopus, is chosen. The analysis only covers the category of “Accounting” and includes journals from the European geographic region between 2010 and 2015. The sample comprises 8 326 papers from 44 different scientific journals.
To achieve this objective, a sample with 8 326 articles from 44 different scientific journals in the category of "accounting" is used. A descriptive analysis permits to conclude that country most often mentioned in the author’s affiliation is the United States of America (USA) with 7 669 papers, followed by England (1 951), and Australia (1 350). If we compare to a total of 18 986 authors in the entire sample, USA corresponds to 40,39%, England to 10,28% and Australia to 7,11%. It is interesting to note that even in Journals published in Europe, the great majority of authors are affiliated in USA’s academic institutions. Also concludes that that the country most often mentioned in the authors’ affiliation (USA) also has the higher number of different universities engaged in the publication (359 different universities), followed by England and Germany both with 88 (6,11%) and Spain with 71 (4,93%). The number of universities for the top 10 countries varies. But the last column presents the number of times that a country is refereed in paper divided by the number of universities of that country. This indicator reveals that Australia, Netherlands, and England have a higher number of references by university. The last descriptive conclusion is that, from the total of 1 440, considering the number of times they are mentioned in the 8 296 papers of the sample, University of California (USA), University of London (England) and University of Texas (USA) are the three most refereed universities from the top 10 presented
To identify the ability of some factors to influence the probability of a paper be included in a journal that is ranked in upper levels of quality, a Logit regression model is applied
average number of country on the author's affiliation and the average number of different universities on the author's affiliation. Two analyses are performed. In the first analysis, for the full sample, results show that that an article with more pages and a higher diversity of affiliations but lower number of authors and less diversity of country, has a bigger probability to be published in a journal from Q1 or Q2 quarter from Scopus ranking. In the second analysis, the sample is divided into two different groups. In the first group, joining together only the papers that belong to Q1 and Q2, results suggest that
all together, results suggest that the higher number of pages and the higher the number of different affiliations per article, the higher the probability of be a higher quality paper. The opposite occurs for the number of authors and the number of different countries per article. All the determinants are statistically significant at 1% level in all the analysis. Because of different relations between dependent and independent variables occurs, additionally analysis is done.
In the second group, joining together only the papers that belong to Q3 and Q4, results seems to indicate that less pages and lower number of authors but from more different affiliations, have a higher probability to be published in a Q3 (when compared to Q4) quarter from Scopus
REFERENCES
Albach, Philip G. 2015. The dilemma of Ranking. International Higher Education. Aksnes, D.W. 2003. Characteristics of highly cited papers. Res. Eval 12: 159.170.
B-ON. http://www.b-on.pt. Retrieved on 21 July, 2015.
Black, Ervin L. and Stainbank, Lesley. 2017. Usage of Journal Rankings: An International Perspective. Journal of International Accounting Research 16: 1-15.
Brown, L. D. 1996. Influential accounting articles, individuals, PhD granting institutions and faculties: a citational analysis. Accounting, Organizations and Society 21:723-754.
Bukowska, Grazyna; Falkowski, Jan and Lopaciuk-Gonczaryk, Beata. 2014. Teaming u por writing alone – Authorship strategies in leading polish economic journals. Working Papers 29: 1-23.
Chan, Kam C., Tong, Jamie Y. and Zhang, Frank F. 2013 . Accounting research in the Asia-Pacific region: an update. Rev Quant Finan 41: 675-694.
Chan, KC, Chen, CR, Chen, LTW. 2007. A global ranking of accounting programs and the elite effect in accounting research. Acc Financ Acc 28(4): 417-439.
Gujarati, D.N. and Porter, D.C. 2009. Basic Econometrics. 5th ed. Mc Graw-Hill, New York Pp 320-351.
Hasselback, J.R., Reinstein, A. And Schwan, Edward S. 1995. Prolific authors of accounting literatures. Advances in Accounting 20:95-125.
Hudson, J. and Laband, D. 2013. Using and interpreting journal rankings: introduction. Econ. J. 123: 199-201.
Leimu, R., and Koricheva, J. 2005. What determines the citation frequency of ecological papers?. Trends Ecol. Evol. 20: 28-32.
Macdonald, S. and Kam, J. 2011. The skewed few: people and papers of quality in management studies. Organization 18: 467-475.
Mingers, J. And Xu, F. 2010. The drivers of citations in management science journals. Eur. J. Oper. Res 205: 422-430.
Prather-Kinsey, Jenice J., Rueschhoff, Norlin. 1996. An Analysis of International Accounting Research in U.S. And Non-U.S. Based Academic Accounting Journals. Journal of International Accounting Research 3:63-81.
SCIMAGO. Description of Scimago Country Rank Indicator. Retrieved 21 July, 2015 from https://www.scimagojr.com/countryrank.php.
SCIMAGO. Description of Scimago Journal Rank Indicator. Retrieved 21 July, 2015 from https://www.scimagojr.com/journalrank.php.
SCOPUS. Description of SCOPUS Rank https://www.scopus.com/. Retrived 21 July, 2015.
Stammerjohan, William W and Hall, Steven C. 2002. Evaluation of doctoral programs in accounting: an examination of placement. Journal of Accounting
Education 20: 1-27.
Vogel, Rick, Hattke, Fabian and Petersen, Jessica. 2017. Journal rankings in management and business studies: What rules do we play by?. Research Policy 46: 1707-1722.