Cave chamber data modeling and 3D Web visualization
Ivo Silvestre
1, Jos´e I. Rodrigues
1,2, Mauro Figueiredo
1,2, Cristina Veiga-Pires
1,31Centro de Investigac¸˜ao Marinha e Ambiental – CIMA 2Instituto Superior de Engenharia – Universidade do Algarve 3Faculdade de Ciˆencias e Tecnologia – Universidade do Algarve
{imsilvestre,jirodrig,mfiguei,cvpires}@ualg.pt
Abstract
Underground caves and its specific structures are im-portant for geomorphological studies. In this paper we present tools to identify and map speleothems by survey-ing cave chambers interiors.
The cave chamber was surveyed using Terrestrial Laser Scanning to acquire point clouds with high level of detail for 3D model generation. This data with 45 million points is useful for either reconstruction, geomorphological stud-ies or virtual visits of caves.
With this point cloud we generated a 3D-mesh to repre-sent the surface model of the cave chamber, which is impor-tant to study its geomorphological features. A topological structure of the 3D-mesh was also implemented to get an efficient algorithm to help identifying stalactites.
The possibility to publish 3D data on the Web is of par-ticular interest for the geospatial field. For this reason, it was decided to make the cave model available in the Web by developing a 3D graphical interface where users can navigate and interact with the three-dimensional models of the cave. For this Web3D framework it was used X3D, WebGL and X3DOM. Such solution does not require any additional plug-ins or components.
Keywords— Cave surveying, TLS, 3D-mesh, MeshLab, X3D, X3DOM
1 Introduction
In the context of project SIPCLIP1, which is concerned
with the global warming, it aims to provide information on past regional climates, to better constrain their complex in-teractions with global climate and acquire new information to document past climatic conditions in the South-western Iberian Peninsula. This information is based on the analy-sis of cave speleothems, which are useful records for pale-oclimatic reconstruction.
1PTDC/AAC-CLI/100916/2008 – Temperature, precipitation regime
and soil conditions in Southwestern Iberian Peninsula under a warmer climate - Insight from the past
The present paper describes a framework for the genera-tion of a 3D model and a Web3D visualizagenera-tion of the karst cave Algar do Penico located in the southernmost region of Portugal (Algarve). This model was used by our imple-mented system to enable the identification and mapping of geomorphological structures inside a cave.
Section 2 briefly presents the surveying process of the cave chambers with high level of detail by using a Terres-trial Laser Scan. Chambers have a lot of irregular surfaces. The obtained point cloud from laser scan presents a high level of data density with about 45 million points.
Identifying geomorphological structures is one of the goals of this research project. Point clouds by itself do not provide enough information about the cave chamber surface. Section 3 presents approaches to generate a 3D-mesh from the point cloud using an open source tool.
In the Section 4 we present algorithms for the study of geomorphological features of caves. Such approaches al-low the recognition and positioning of cave stalactites that can provide information on hidden features responsible for cave geomorphology. We also implemented a topological structure for the 3D-mesh to get an efficient algorithm to help determining stalactites.
Web3D sites that include three-dimensional models where users navigate and interact through a 3D graphical interface, are increasingly employed in different domains.
Section 5 presents our approach to make the cave model available in a Web3D site. It provides a 3D graphical inter-face where users can navigate and interact with the three-dimensional model of the cave. To this purpose, it was used X3D, WebGL and X3DOM. Such solution does not require any additional plug-ins or components.
2 Terrestrial Laser Scanning survey
The selected cave, known by the local speleologists as Algar do Penico, is located in the southernmost region of Portugal (Algarve), to the west of the city of Loul´e. This cave has an extension of about 80 meters, a gap of 14 me-ters and a depth of approximately 20 meme-ters. It is com-posed by two chambers connected by a vertical narrow
gallery of about 5 meters.
In the context of this project and with the objective of mapping the cave and its geomorphological structures for environmental and geological studies, it was decided to survey its interior chambers. Each chamber was sur-veyed independently due to its morphological characteris-tics. The work presented in this paper is focused in the main chamber. In order to survey the cave with high levels of data density for close range applications a laser scanner was used. The process of data acquisition in the interior of the cave was a very complex task due to the difficult accesses and the working environment, which has a lot of irregular surfaces.
Terrestrial Laser Scanning is a relatively new technol-ogy that offers high resolution surveys. The scanner’s pulsed laser ranging device, coupled with beam deflection mechanisms, facilitates rapid acquisition of a huge number of three-dimensional point measurements. One of the great advantage of this surveying method is the high-resolution surface geometry that permits accurate and detailed surface reconstruction and modeling as well as superior visualiza-tion relative to existing measurement technologies [1].
The main chamber of the cave Algar do Penico was surveyed with a Terrestrial Laser Scanner (TLS), more specifically, the Leica ScanStation C10 laser scanner sys-tem mounted on a tripod. The specifications of this unit include a 360◦ horizontal field of view and a maximum
of 270◦ vertical field of view. The scanner emits pulses
of green laser light that sweeps across the chamber sur-faces and sends back measurements with precise x, y and z coordinates, each having an associated intensity value and color. The scanner enables point cloud to be captured that correspond to true point positions where the laser pulse hits the object. The point cloud represents the shape and position of scanned surfaces relative to the position of the scanner.
The 3D laser scanner point cloud data was collected with a point spacing of 20 seconds of arc. Distance be-tween closest points may varying according distance from station. Due to the dimensions of the cave chamber the maximum distance between closest points is less than one centimeter. Thus, a total of 45 × 106point raw data arrays,
which is a massive data set.
3 3D-mesh generation
Identifying geomorphological structures is one of the goals of this research project. In the previous section, a point cloud with about 45 million points was obtained from laser scan surveys. Point cloud do not provide enough in-formation about the cave chamber surface. For this reason it is necessary to generate a surface model.
Computational representation of surfaces is a widely studied problem, with a vast bibliography of reference.
Surfaces are usually represented by a collection of vertices, edges and faces, known as a polygonal mesh or polygo-nal soup, defining the shape of a polyhedral object. In the present work, a triangular 3D-mesh was adopted which is more appropriate for visualization. The faces of the mesh consist of triangles, where each face corresponds to a set of three vertices [2].
We used the Meshlab software [3] for the 3D-mesh gen-eration of the cave chamber. MeshLab2is a free and open
source software for mesh processing and editing. Further-more, it works with a huge number of common 3D file formats, such as, PLY, STL, OBJ, 3DS, COLLADA, PTX, PTS, XYZ, ASC, X3D and VRML. There are several algo-rithms to do the surface reconstruction from point clouds. MeshLab has several methods for surface reconstruction. We explored a ball pivoting variant and Poisson’s recon-struction.
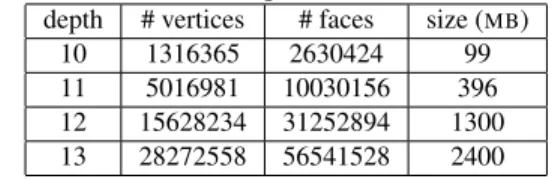
The Poisson Surface Reconstruction is based on the ob-servation that the normal field of the boundary of a solid can be interpreted as the gradient of the solid’s indicator function. Therefore, given a set of oriented points sam-pling the boundary of a solid, a 3D-mesh can be obtained by transforming the oriented point samples into a continu-ous vector field in 3D. This is performed finding a scalar function whose gradients best match the vector field, and extracting the appropriate isosurface [4]. Although it is be-yond the scope of this paper a thorough analysis of this al-gorithm, it is useful to note that the vertices of the faces of these meshes do not coincide with the points of the survey. The surface obtained with Poisson Surface Reconstruc-tion has a variable detail level depending on the input pa-rameter of the octree depth. The octree depth papa-rameter is the maximum depth of the tree that will be used for the surface reconstruction. Increasing the depth, the surface gets more details. The number of faces and vertices also increases as it is shown in Table 1. This table presents the number of vertices, faces and the file size for several 3D-meshes generated with octree depths of 10, 11, 12 and 13. Three dimensional meshes are stored in PLY file format. High values of octree depth increase the amount of data from 100MB to 2.4GB.
Table 1: 3D-meshes generated from Poisson Surface Re-construction with octree depths of 10, 11, 12 and 13.
depth # vertices # faces size (MB)
10 1316365 2630424 99
11 5016981 10030156 396
12 15628234 31252894 1300 13 28272558 56541528 2400
A compromise has to be achieved between the com-2http://meshlab.sourceforge.net/
plexity of the 3D-mesh, the realistic visualization of the chamber and real time interaction. For these reasons, we used the Poisson Surface Reconstruction method with an octree depth of 11 to generate a 3D-mesh with about 5 mil-lion vertices and 10 milmil-lion faces. This method returned a closed surface even where the point cloud is more sparse. Figure 1 shows the 3D-mesh of the cave chamber, where we can navigate in real time, in a desktop computer with an Intel Core i7 3.40GHz, 8GB of memory RAM and a NVIDIA Quadro 4000 graphic card (with 2GB of dedi-cated memory) using MeshLab. The operating system is the 64-bit Ubuntu 12.04 LTS.
Figure 1: Cave chamber 3D-mesh image obtained with Poisson Surface Reconstruction with a depth of 11.
4 Identification of geomorphological
struc-tures from 3D-mesh
The speleogenetic studies aimed deciphering the ori-gin of caves and details of specific processes which led to the existing cave structures, by studying cave morphology and its meso- and micro-morphological features. These smaller-scale features are typically not represented on the standard cave map obtained, for example, by electronic distance measurements [1].
One of the main objectives of this work is to identify and map the geomorphological structures existent inside the cave Algar do Penico.
The polygon mesh previously referred (see Section 3) is a mesh that consists of a collection of triangles with no particular ordering and without any kind of topological in-formation associated. This type of structures are the de-fault output format when geometry is exported from a 3D modeling software such as MeshLab, Blender or Maya [5]. In order to identify geomorphological structures, the avail-ability of explicit topological information helps the imple-mentation of efficient algorithms to traverse the huge data surface model of the cave chamber. That can be imple-mented using graphs.
A graph consists of a finite set of vertices, V , and a set of edges, E, where each e ∈ E is a pair of vertices. Given
an edge, e = {u, v}, vertices u, v ∈ V are adjacents. A path is a sequence of pairwise adjacent vertices without repetition of any vertex except possibly the first and the last which can be the same. When the first and the last vertices of a path are the same, the closed path is also called a cycle. Graphs are often sketched as node-link diagrams in which the vertices are represented as points and the edges as lines. When a graph draw can be embedded in the plane with no edge crossing except at their common vertices the graph is called planar. Let G = (V, E) be a plane graph. The plane regions bounded by the edges of G are called faces.
Figure 2: Planar graph with 5 vertices and 7 edges. Figure 2 presents a planar graph G with 5 vertices and 7 edges and 4 faces (3 triangles and the exterior face). Vertex v1is adjacent to all other vertices, {v3, v4} is an edge of G,
{v1, v2, v3, v4} is a path and {v1, v2, v3, v1} is a face.
There are several data structures to store graphs. For computational purposes, we adopt the adjacency list data structure where for each vertex correspond the list of adja-cent vertices.
For the graph in Figure 2, the adjacency list is as fol-lows:
(1) Adj ={v1: [v2, v3, v4, v5], v2: [v1, v3]
v3: [v1, v2, v4], v4: [v1, v3, v5], v5: [v1, v4]}
From a 3D-mesh polygonal soup a definition of a graph G = (V, E)is a straight process. The vertices set V is the vertices set of the mesh and edges of G are the edges of the mesh. The advantage of the graph structure is that it includes explicit topological information which allows the implementation of an efficient algorithm to determine local minima in the mesh (see Algorithm 1).
The information of vertex adjacencies was organized with the help of Python3 dictionaries. These data types
are sometimes found in other languages as associative ar-rays or hash tables. A Python dictionary is an unordered collection of key-value pairs, with the requirement that the keys are unique. A pair of braces {} creates an empty dic-tionary. Placing a comma-separated list of key-value pairs
within the braces adds initial key-value pairs to the dictio-nary.The dictionary example with the graph in Figure 2 is presented in (1).
Stalactite extremities correspond to local minima in the 3D-mesh. A local minimum in the 3D-mesh surface is one point P of the mesh such that its z coordinate is less than zcoordinates of all points in a chosen neighborhood of P . A local minimum P is a vertex of the 3D-mesh because the faces of this surface are triangles. Thus, given a vertex v ∈ V to decide if it corresponding point on the 3D-mesh is local minimum it is sufficient to check if its z-coordinate is less than the z-coordinates of all adjacent vertices of v.
Data: G = (V, E) initialization; Lm← empty list;
for v ∈ V do
N (v)← list of adjacent vertices to v; if zv ≤ zvifor all vi∈ N(v) then
append v to Lm;
end end
Algorithm 1: Local minimum algorithm.
Regarding the fact that if u is adjacent to v and zu< zv
than v is not a local minimum, Algorithm 1 can be imple-mented without need to check the minimum condition for all vertices of V .
Algorithm 1 was used to compute local minima of the chamber using the 3D-mesh model obtained with octree depth of 11 (see Figure 4).
Other important case study from the 3D-mesh, evolv-ing the graph was the extraction of contour lines. Contour lines, also known as contours, are lines that join all points of equal elevation (z-coordinate). Contours are used to de-note elevation and depth.
In the context of the present work, contours allow to denote topographic surface of the chamber and are useful structures for water run-off studies. Figure 5 shows 5cm equidistant contours of a specific region of stalactites in the interior of Algar do Penico chamber.
5 3D data visualization on the Web
As a consequence of advances in computer hardware and internet connection speed, Web3D sites that include three-dimensional models where users navigate and inter-act through a 3D graphical interface, are increasingly em-ployed in different domains. The possibility to publish 3D data on the Web is of particular interest for the geospa-tial field. This enables researchers to visualize, navigate and interact with three-dimensional data on a simple Web browser. In addition to the 3D-mesh publishing, we want to map geomorphological structures of the cave interior.
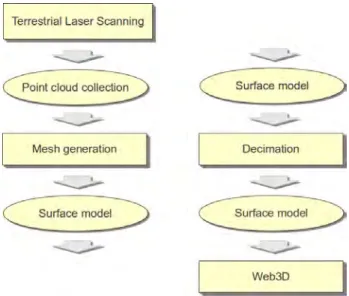
Figure 3 presents the adopted tasks sequence. The
inte-rior of the chamber was surveyed using a Terrestrial Laser Scanner to collect a point cloud data (see Section 2). To produce surface models, the point clouds collections was interpolated using the Poisson Surface Reconstruction (see Section 3). Surface models obtained present high level of detail (Figures 1 and 4) with millions of vertices and faces. For Web visualization with X3DOM, in real time, the surface model was simplified by a decimation process. The following paragraphs describe the decimation and the Web3D implementation. To be included in Web, surface models are converted to X3D format or other compatible.
Several technologies exist to create 3D content for the web. Some of them are plug-in based systems, that means they depend on an additional piece of software running in-side a web browser. These technologies have some clear disadvantages such as, the distrust, security and incompat-ibility issues associated with the plug-in installation and the need to understand how the plug-in works to develop applications.
Figure 3: Tasks sequence from TLS surveying to 3D Web. Nowadays, it is possible to integrate 3D content on the Web directly into the browser without plug-ins or addi-tional components. This is the approach for the proposed framework presented in this paper that uses X3D, WebGL and X3DOM enabling the 3D visualization and navigation in the interior of the Algar do Penico in the Firefox, Google Chrome, Safari and Opera web browsers without specific plug-ins. X3D is used to represent the cave chamber 3D model and it is inserted on the user side for visualization in WebGL supported browsers with the X3D Document Object Model (X3DOM) technique. X3D is the ISO stan-dard XML-based file format for representing 3D computer graphics. It is the successor of VRML, including a large
number of new and extended features. A major difference between X3D and VRML is the use of XML as syntax. X3D benefits in many ways of using XML since it is easy to read for both humans and computer systems, it is well supported, it is license free, the data is well structured and it is web compatible [6].
WebGL is an open standard software library for a low-level 3D graphics API based on OpenGL that generates interactive 2D and 3D graphics on any browser without installing additional plug-ins. WebGL uses HTML5 to include data content into the DOM (Document Object Model) and access to this content in the scene graph but HTML5 cannot do this directly with 3D data. In this context, the Web3D consortium has written recommenda-tions about how to integrate HTML5 and 3D content, more specifically, Extensible 3D (X3D) [Mao 2011]. Although X3D content is not supported by all web browsers directly right now, it is the trend that in the near future X3D ele-ments will be able to be directly manipulated by the most common browsers with the DOM technique [7] [8].
X3DOM is an open source framework with the ob-jective of integrating HTML5 and X3D on top of We-bGL[Behr et al. 2009]. X3DOM is a framework for inte-grating and manipulating (X3D) scenes as HTML5-DOM elements, which are rendered via WebGL and therefore does not require plug-ins for displaying the X3D content.
The 3D-mesh size is a problem for visualization effi-ciency and interactivity in real time on the Web. Models can present huge number of elements stored in large file size. Detailed and high-precision model can have 2.4GB (see Table 1). To produce a lighter model we decided to simplify the cave chamber 3D-mesh. One of the signifi-cant ways to simplify meshes is by geometry removal op-erations. These operations are called mesh decimation and consist in iteratively remove geometry unit such as ver-tices, edges or triangle faces [9].
For the 3D-mesh simplification we used the Mesh-Lab multi-edge decimation function called Quadratic Edge Collapse Decimation. This function consists in remov-ing the multi-edge mesh and the relative triangles and then connect the adjacent vertices to the new vertex [10].
In order to select a 3D-mesh with a reasonable size that do not compromise performance for Web publishing we tried to simplify the generated 3D-meshes presented in Ta-ble 1 (Section 3). The Quadratic Edge Collapse Decima-tion worked with the 3D-meshes generated from 10 and 11 octree depth. The 11 octree depth 3D-mesh was chosen due to its higher detail level, which refers to higher number and dimension of stalactite.
Three simplifications were generated from the 11 octree depth 3D-mesh. Table 2 presents the number of vertices, the number of triangle faces and the size of each
simpli-fied 3D-mesh files in X3D format. These new simplisimpli-fied meshes were integrated with HTML5 using the InstantRe-ality4 framework. This framework provides tools for 3D
data sets optimization. Tests of download time were per-formed in localhost environment. Waiting time varying be-tween 7s and 60s were measured.
Table 2: Tests of download speed between three different mesh sizes.
# vertices # faces (sizeMB) downloadtime (s)
500732 998856 60.2 60
250791 499486 29.8 19
125497 249696 14.6 7
Considering the download times we selected the 3D-mesh with about 250 thousand faces and about 125 thou-sand vertices, as presented in Table 2. This 3D-mesh takes about 7 seconds to be ready for real time interaction in a Web browser.
Figure 4 illustrates the cave chamber 3D-mesh and its stalactites extremities represented by white dots. Lower tip of stalactites or local minima resulted from the algorithm 1.
Figure 4: Web visualization of cave chamber 3D-mesh and local minima (stalactites extremities).
Figure 5 a) represents a 3D Web visualization of a par-ticular area of interest. This area correspond to the biggest stalactite in the chamber. This visualization also contains the contour lines calculated for the same area. Figure 5 b) shows the plane view of contour lines and local minima.
The developed framework for 3D visualization of the cave chamber is available on the Web at the address: http://193.136.227.170/sipclip/web3d/.
a) b)
Figure 5: 3D model (a) and respective plane view (b) of stalactite 3D-mesh and its contour lines.
6 Conclusion
This paper presented an approach for the 3D modeling and Web visualization of 3D data from a cave chamber. Chambers have many irregular surfaces and we obtained a point cloud with about 45 million points with high level of detail.
It was a challenge to work with such massive data col-lection to generate a surface model of the cave chamber to study its geomorphological features. For the 3D modeling process we used an open source tool called MeshLab. This software allowed to generate a 3D-mesh from the original point cloud with the goal to achieve a compromise between the complexity of the 3D-mesh, the realistic visualization and real time interaction in the chamber 3D model. For this purpose, we used the Poisson Surface Reconstruction method that generated a 3D-mesh with a about 5 million vertices and 10 million faces.
One of the main goals of this research project was to visualize and identify cave stalactites that could provide information on hidden cave features responsible for cave geomorphology. Stalactites extremities are local minima in the 3D-mesh. We described in this paper an algorithm to find local minima for the recognition of stalactites dis-tribution, alignments and other properties of interest to the SIPCLIP project. It is also presented a topological struc-ture for the 3D-mesh to get an efficient algorithm for the process of finding stalactites structures.
A framework for 3D visualization of cave chamber was made available on the Web using X3D, WebGL and X3DOM. Such solution does not require any additional plug-ins. The availability of Algar do Penico in a Web3D is interesting for the geospatial field. Researcher can navi-gate in this environment to visualize stalactites extremities and contour lines.
Acknowledgments
This work has been supported by the Portuguese gov-ernment and EU - Funding, through the FCT - Fundac¸˜ao para a Ciˆencia e Tecnologia funding of the SIPCLIP project
(PTDC/AAC-CLI/100916/2008).
References
[1] A. Roncat, Y. Dublyansky, C. Spotl, and P. Dorninger, “Full-3d surveying of caves: A case study of marchenhohle (austria),” in Proceedings of the Inter-national Association for Mathematical Geosciences (IAMG 2011), 2011.
[2] R. Tobler and S. Maierhofer, “A mesh data structure for rendering and subdivision,” in International Con-ference in Central Europe on Computer Graphics, Vi-sualization and Computer Vision, 2006, pp. 157–162. [3] P. Cignoni, M. Callieri, M. Corsini, M. Dellepiane, F. Ganovelli, and G. Ranzuglia, “Meshlab: an open-source mesh processing tool.” in Eurographics Italian Chapter Conference, V. Scarano, R. D. Chiara, and U. Erra, Eds. Eurographics, 2008, pp. 129–136. [4] M. M. Kazhdan, M. Bolitho, and H. Hoppe, “Poisson
surface reconstruction.” in Symposium on Geometry Processing, ser. ACM International Conference Pro-ceeding Series, A. Sheffer and K. Polthier, Eds., vol. 256. Eurographics Association, 2006, pp. 61–70. [5] C. Shen, J. F. O’Brien, and J. R. Shewchuk,
“Interpo-lating and approximating implicit surfaces from poly-gon soup,” ACM Trans. Graph., vol. 23, no. 3, pp. 896–904, 2004.
[6] F. D. Cerbo, G. Dodero, and L. Papaleo, “Developing a web 3.0 e-learning portal with x3d technologies,” in Eurographics Italian Chapter Conference, 2010, pp. 129–134.
[7] J. Behr, P. Eschler, Y. Jung, and M. Z¨ollner, “X3dom: a dom-based html5/x3d integration model.” in Web3D, S. Spencer, D. Fellner, J. Behr, and K. Walczak, Eds. ACM, 2009, pp. 127–135. [Online]. Available: http://dblp.uni-trier.de/db/conf/ vrml/web3d2009.html#BehrEJZ09
[8] I. Prieto, J. Izkara, and F. Delgado, “From point cloud to web 3d through citygml,” in Virtual Systems and Multimedia (VSMM), 2012 18th International Con-ference on, 2012, pp. 405–412.
[9] P. S. Heckbert and M. Garland, “Optimal triangula-tion and quadric-based surface simplificatriangula-tion,” Com-putational Geometry, vol. 14, no. 1–3, pp. 49–65, 1999.
[10] H. Chen, X. Luo, and R. Ling, “Surface simplifi-cation using multi-edge mesh collapse,” in Image and Graphics, 2007. ICIG 2007. Fourth International Conference on, 2007, pp. 954–959.