UNIVERSIDADE DA BEIRA INTERIOR
Engenharia
Numerical Analysis of a Plunging NACA0012 Airfoil
Emanuel António Rodrigues Camacho
Dissertação para obtenção do Grau de Mestre em
Engenharia Aeronáutica
(Ciclo de estudos integrado)
(Versão corrigida após defesa)
Orientador: Prof. Doutor André Resende Rodrigues da Silva
Agradecimentos
A vida é um interessante conjunto de acontecimentos que pertencem a um processo governado por uma ou mais equações diferenciais desconhecidas pelo ser Humano. No entanto, como se sabe, este tipo de equações simplesmente traduzem a forma como os fenómenos evoluem quer no espaço quer no tempo e por isso, para obter o caso particular da nossa vida, são utilizadas as chamadas condições de fronteira, que por outras palavras, são as pessoas e os momentos que nos moldam a personalidade. Assim, está na hora de agradecer às minhas condições de fronteira, a quem me suporta e tanto investiu na minha pessoa e no meu percurso até aos dias de hoje.
Começo assim por agradecer ao Professor Doutor André Silva e ao Professor Doutor Jorge Barata por me introduzirem ao mundo da aerodinâmica e de CFD de uma forma envolvente e arrebata-dora e, pelos inúmeros conselhos que sem dúvida enriqueceram o meu percurso académico. Agradeço também a todos os membros do AeroG pelos momentos de discussão, de aprendiza-gem e de diversão, em especial, ao Rodolfo Lopes e à Diana Rodrigues que, estando também envolvidos na temática de escoamentos bio-inspirados, ajudaram-me, com longas conversas e discussões, a esmiuçar este tema e a perceber o seu potencial.
Por último, mas não menos importante, quero agradecer a um grande amigo, pelas grandes dis-cussões e momentos e à minha família por se sujeitarem a um enorme rombo financeiro e que mesmo estando a 1194.20 km de distância, sempre me apoiaram, sacrificando parte da sua vida para que eu pudesse crescer como pessoa e como membro da sociedade, um amor infindável e heróico que estarei grato para sempre.
”I want to thank all the people who’ve been with me on this journey, through the highs and lows, through the struggles. Through your struggles and mine. And to anybody who doesn’t allow themselves to be broken. And keeps getting up, and keeps holding on, and keeps standing tall, keeps on believing and keeps rising, I celebrate YOU”
Obrigado!
Resumo
O voo natural tem sido sempre a fonte de imaginação para o ser Humano mas, reproduzir os sistemas propulsivos usados pelos animais é deveras complexo. Novos desafios presentes na sociedade atual fizeram com que a biomimética ganhasse uma grande importância devido ao elevado desempenho e versatilidade que estes sistemas possuem quando sujeitos a efeitos de baixos números de Reynolds. A presente dissertação tem como principal objetivo perceber qual a influência do número de Reynolds, ângulo de ataque, frequência e amplitude do movimento no desempenho aerodinâmico de um perfil NACA0012 que, se desloca verticalmente sem qualquer variação temporal do ângulo de ataque. Este é um trabalho de cariz numérico, onde são obtidos os coeficientes de tração e de potência que em conjunto, são utilizados para calcular a eficiência propulsiva. As simulações são realizadas com recurso ao software ANSYS Fluent onde as RANS são resolvidas utilizando dois modelos de turbulência, Realizable k− ε e SST k − ω. Após a validação da formulação numérica, inicia-se a fase de resultados onde o número de Reynolds está compreendido entre 8500 e 34000, a frequência reduzida entre 1 e 5 e o número de Strouhal com limites inferior e superior igual a 0.1 e 0.4, respetivamente. Na fase final, a influência do ângulo de ataque é estudada para diferentes condições sendo que este parâmetro varia entre 0◦e 10◦. Os resultados apresentam uma relação próxima com os processos verificados na natureza em termos de condições operacionais para os diferentes números de Reynolds e, por fim, a influência do ângulo de ataque nos coeficientes aerodinâmicos e na eficiência propulsiva é amplamente explorada, algo não muito investigado na literatura.
Palavras-chave
Abstract
Natural flight has always been the source of imagination for the Human being, but reproducing the propulsive systems used by animals is indeed complex. New challenges in today’s society have made biomimetics gain a lot of momentum because of the high performance and versa-tility these systems possess when subjected to the low Reynolds numbers effects. The present dissertation has as main objective the study of the influence of the number of Reynolds, angle of attack, frequency and amplitude of the movement in the aerodynamic performance of an airfoil NACA0012 that, vertically moves without any variation of the angle of attack over time. This is a numerical work, where the thrust and power coefficients are obtained which together are used to calculate the propulsive efficiency. The simulations are performed using the ANSYS Fluent software where RANS are solved using two turbulence models, Realizable k− ε and SST
k− ω. After the numerical validation, the results phase began where the number of Reynolds
ranges between 8500 and 34000, the reduced frequency is between 1 and 5, and the Strouhal number has lower and upper limits equal to 0.1 and 0.4, respectively. In the final phase, the influence of the angle of attack is studied for different conditions, which ranges from 0◦to 10◦. The results show a close relationship with the processes seen in nature regarding the operational conditions for the different Reynolds numbers and, finally, the influence of the angle of attack on the aerodynamic coefficients and the propulsive efficiency is widely explored, something not extensively investigated in the literature.
Keywords
Contents
1 Introduction 1
1.1 Motivation and Objectives . . . 1
1.2 Literature Review . . . 2
1.3 Outline . . . 32
2 Numerical Methodology 33 2.1 Governing Equations and Turbulence Modeling . . . 33
2.1.1 Realizable k− ε Turbulence Model . . . 34
2.1.2 SST k− ω Turbulence Model . . . 35
2.2 Problem Formulation . . . 38
2.3 Boundary Location Study . . . 40
2.4 Mesh Independence Study . . . 41
2.5 Time Step Independence Study . . . 41
3 Results and Discussion 43 3.1 Numerical Validation . . . 43
3.2 Results . . . 44
3.2.1 The Influence of k and h . . . . 44
3.2.2 The Influence of the Reynolds Number . . . 48
3.2.3 The Influence of the Angle of Attack . . . 52
4 Conclusion 57 References 59 Appendix A 63 A.1 Quadratic regressions of Ctand CP with Re = 8500 . . . 63
List of Figures
1.1 Two dimensional flapping scheme. . . 3
1.2 Control volume for a flapping airfoil producing thrust. . . 5
1.3 Typical von Kármán vortex street (velocity profile indicates a momentum deficit). 6 1.4 Inverted von Kármán vortex street (velocity profile indicates a momentum surplus). 6 1.5 Transition from typical to inverted von Kármán vortex street. . . 6
1.6 Deflected vortex street. . . 7
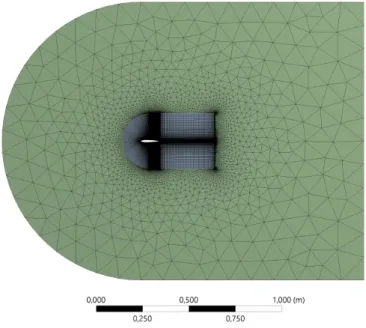
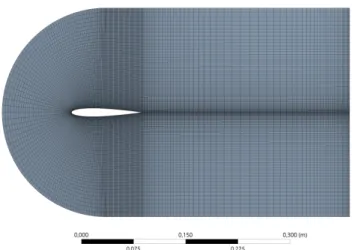
2.1 Mesh. . . 38
2.2 Mesh (Internal zone). . . 39
2.3 Drag coefficient evolution for distinct blockage ratios with Re = 17000, h = 0.5, k = 2.5. . . . 41
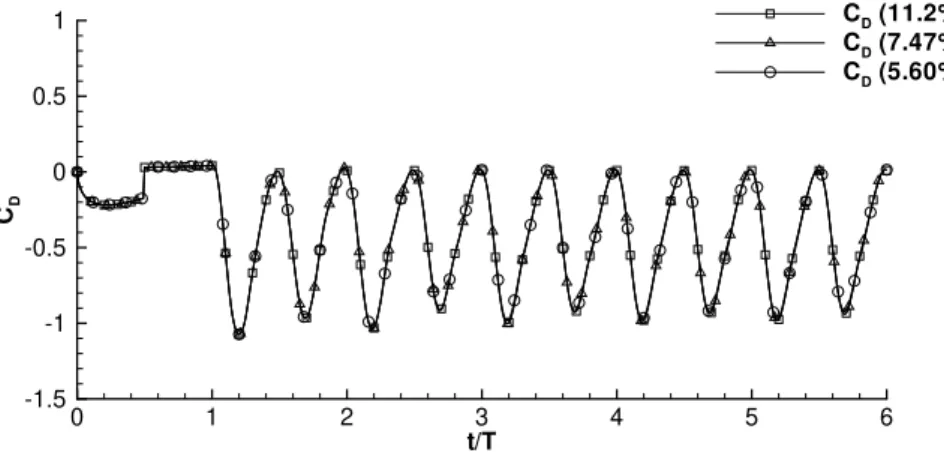
2.4 Drag coefficient evolution for distinct meshes with Re = 17000, h = 0.5, k = 2.5. . 42
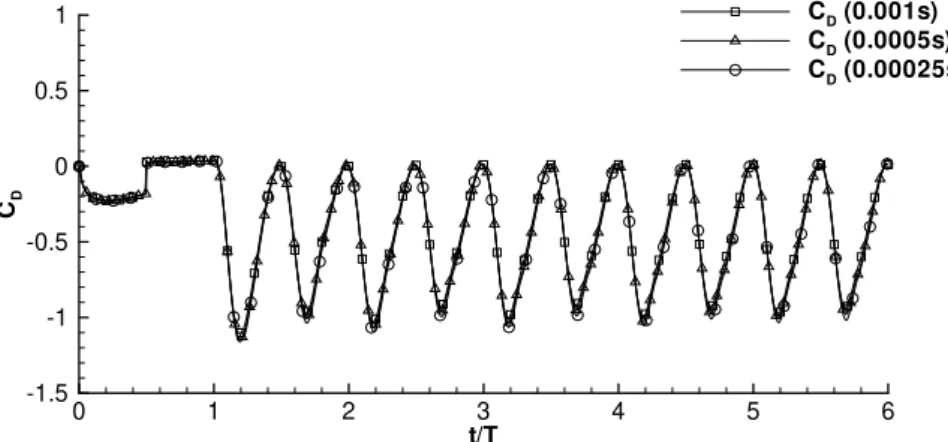
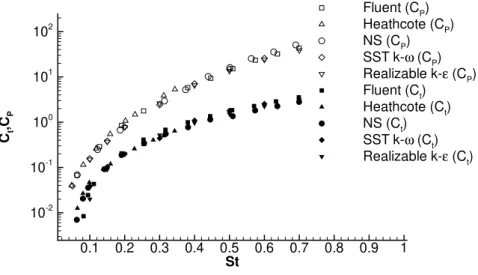
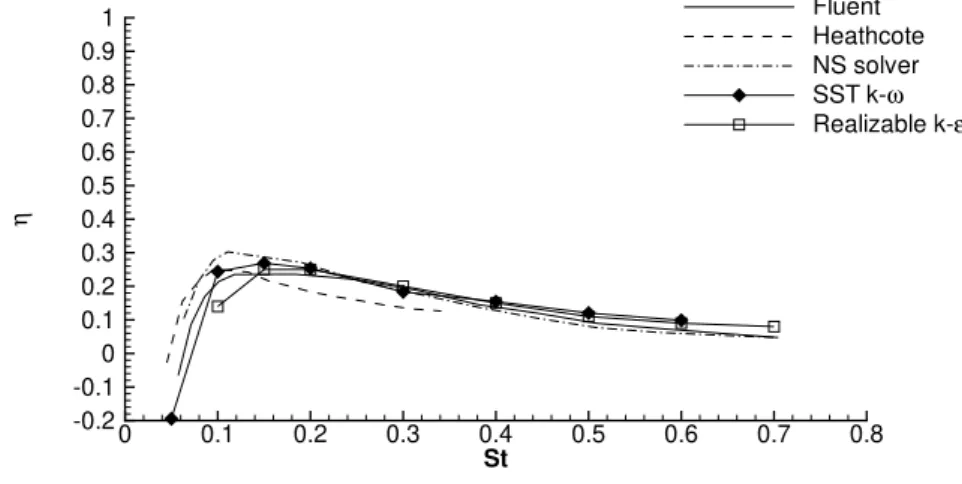
2.5 Drag coefficient evolution for distinct time steps with Re = 17000, h = 0.5, k = 2.5. 42 3.1 Thrust and power coefficients as a function of the Strouhal number. . . 43
3.2 Propulsive efficiency as a function of the Strouhal number. . . 44
3.3 Thrust and power coefficients as a function of k and h with Re = 8500. . . . 45
3.4 Propulsive efficiency as a function of k and h with Re = 8500. . . . 46
3.5 Thrust and power coefficients as a function of k and h with Re = 17000. . . . 46
3.6 Propulsive efficiency as a function of k and h with Re = 17000. . . . 47
3.7 Thrust and power coefficients as a function of k and h with Re = 34000. . . . 48
3.8 Propulsive efficiency as a function of k and h with Re = 34000. . . . 48
3.9 Thrust and power coefficients as a function of k and Re with St = 0.10. . . . 49
3.10 Propulsive efficiency as a function of k and Re with St = 0.10. . . . 50
3.11 Thrust and power coefficients as a function of k and Re with St = 0.15. . . . 50
3.12 Propulsive efficiency as a function of k and Re with St = 0.15. . . . 51
3.13 Thrust and power coefficients as a function of k and Re with St = 0.20. . . . 51
3.14 Propulsive efficiency as a function of k and Re with St = 0.20. . . . 51
3.15 Propulsive efficiency as a function of αef f and Re with St = 0.10 and St = 0.15. . 53
3.16 Ctand CP as a function of αef f, k with St = 0.10, 0.15 and 0.20. . . . 53
3.17 Lift coefficient as a function of αef f, k with St = 0.10, 0.15 and 0.20. . . . 54
3.18 Lift coefficient as a function of t/T and α. . . . 54
List of Tables
1.1 Literature review. . . 14
2.1 Turbulence model constants for the Realizable k− ε model. . . 35
2.2 Turbulence model constants for SST k− ω model. . . 37
2.3 Tested blockage ratios. . . 41
2.4 Tested time steps. . . 42
1 Coefficients of quadratic regressions with constant k and Re = 8500. . . . 63
2 Coefficients of quadratic regressions with constant h and Re = 8500. . . . 63
3 Coefficients of quadratic regressions with constant k and Re = 17000. . . . 64
Nomenclature
Re Reynolds number − U∞ Free-stream speed m· s−1 M a Mach number − ρ Density kg· m−3 µ Dynamic viscosity P a· s c Aerodynamic chord m AR Aspect ratio − k Reduced frequency −h Non-dimensional plunge amplitude −
f Plunging frequency Hz
T Plunging period s
A Plunging amplitude m
fα Pitching frequency Hz
Aα Pitching amplitude rad
ϕ Phase angle between plunging and pitching rad
W Wake width m
St Strouhal number −
x Horizontal coordinate m
y Vertical coordinate m
˙
x Airfoil’s horizontal velocity m· s−1
˙
y Airfoil’s vertical velocity m· s−1
α Angle of attack rad
˙
α Angle of attack rate rad· s−1
αeff Effective angle of attack rad
ζ Airfoil’s trajectory angle rad
Cl Lift coefficient − Cd Drag coefficient − Ct Thrust coefficient − CP Power coefficient m· s−1 Cm Moment coefficient − ∆t Time interval s η Propulsive efficiency − T Thrust force N L Lift force N M Pitching moment N· m P Power required W Gt Thrust gain − GP Power gain −
List of Acronyms
2D Two-dimensional
3D Three-dimensional
CFD Computational Fluids Dynamics
DARPA Defense Advanced Research Projects Agency DNS Direct Numerical Simulation
DPIV Digital Particle Image Velocimetry HALE High-Altitude Long-Endurance
LEV Leading Edge Vortex
LFT Liquid Film Tunnel
NACA National Advisory Committee for Aeronautics
NS Navier-Stokes
NSPOT Interactive Navier-Stokes/Potential Flow PISO Pressure-Implicit with Splitting of Operators
PIV Particle Image Velocimetry PRESTO! Pressure Staggering Option
QUICK Quadratic Upstream Interpolation for Convective Kinematics RANS Reynolds Averaged Navier-Stokes
RSV Rotational Stopping Vortex SST Shear Stress Transport
TEV Trailing Edge Vortex
TV Translational Vortex
UBI Universidade da Beira Interior
UPM Unsteady Panel Method
Chapter 1
Introduction
In this first chapter, the motivation and objectives are explained, followed by the literature review where the governing parameters and the research carried out by several authors are explained. Finally, in the outline subsection, the dissertation structure is described.
1.1
Motivation and Objectives
When the flapping mechanism was uncovered as a thrust production system, the scientific com-munity saw the possibility to investigate new aerodynamic phenomena and develop new systems that could improve substantially the way we fly, which is still rather conservative [1]. However, in the first part of the twentieth century, very little effort was made in terms of understanding and exploiting the aerodynamics of living beings.
Animals such as birds, insects, small fishes and even the big blue whale are equipped with a spectacular propulsion system. What makes this mechanism so interestingly efficient is that it was subjected to natural selection over millions of years which inevitably offers an advantage over conventional propulsion systems. Thus, replicating the natural flight and exploiting the atmospheric flows by using only one structure would be indeed a rewarding accomplishment. The ability to adapt the flight instantly but keeping the maximization of the aerodynamic per-formance a priority shakes the premise that flying can only be optimized for the cruise condition which is rather restricting. To counteract this tendency, micro and nano aerial vehicles with in-dispensable civil and military applications such as surveillance, espionage, atmospheric weather monitoring and catastrophe relief purposes [2] are being developed which offer an undeniable maneuverability and efficiency at lower scales for which conventional propulsion systems be-come inefficient since at this scale, high viscosity effects are present, which makes flapping wing systems way more efficient and more easily maneuverable, when compared to fixed wings. The most advanced MAVs related research projects define these vehicles as vehicles with no length, width or height larger than 15cm, as declared in a Defense Advanced Research Projects Agency (DARPA) program [3].
In the present dissertation, the flapping airfoil problem is studied, in particular, the plunging motion which has not received as much attention throughout the years, when compared with the combined plunging and pitching. Hence, studying the influence of flight velocity, the motion’s frequency and amplitude and the angle of attack is a priority to understand the generation of lift and thrust forces and what combinations in the operating domain is energetically adequate to operate a vehicle, that uses the flapping mechanism as its mean of motion. The influence of the mentioned parameters will be evaluated using the dimensionless quantities typically used while analyzing a flapping airfoil, being these, the reduced frequency, k, the non-dimensional amplitude, h, Strouhal number and the Reynolds number which plays an important role in this type of problem that is governed by low Reynolds effects. Even if the vast majority of research
assumes the laminar regime, the present effects do not invalidate the existence of turbulence, and understanding which models are capable of predicting the flow characteristics is also an ambition of this dissertation.
1.2
Literature Review
At first, studying the aerodynamics of plunging and pitching airfoils offered a better understand-ing regardunderstand-ing the flutter and gust-response effects, which are only based on the analysis of the lifting forces [4, 5]. Oscillating airfoils also opened new ways to study the impact of the dynamic stall on helicopter and propeller blades performance and how impactful is the wake created by a foregoing blade on the following blades [6].
The studies on flapping motion flight can be classified into two main parts: the zoological and simplified configurations. The zoological configurations are performed based on the study of insects or birds and how they use their natural structures under certain conditions. The simpli-fied configurations are mostly the works based on the aerodynamics of the flow, where 2D or 3D simulations and experiments are carried out to predict the aerodynamic forces and propulsive efficiency.
As observed in nature, flying and swimming animals use the combined pitching and plunging which might denounce the most efficient mode of flight so it is crucial to analyze this mode of motion. Nevertheless, both plunging and pitching alone must be studied to further understand the aerodynamic phenomena associated with flapping foils. During these last years, the sinu-soidal plunge oscillations have received less attention when compared to pitching or flapping, since there is a general thinking that a pure plunging oscillation would not offer any advantage in practical applications.
The word flapping is used to describe a combined plunge and pitch oscillations. Of special in-terest, is the determination of the dependence of the aerodynamic forces on the amplitude, frequency, phase angle between plunge and pitch oscillation and on the flow Reynolds number, especially the combination of these parameters, which leads to dynamic stall and therefore loss or enhancement of thrust and propulsive efficiency. Reynolds number may be seen as a critical parameter since the flapping strategies used by birds (at relatively high Reynolds) are unrelated with those used by insects (ultra low Reynolds numbers), in which tremendous leading edge separation is present.
Thus, in order to better understand and analyze the phenomena found in this type of problem, several dimensionless parameters are used. As mentioned before, the Reynolds number is an important parameter which provides the ratio between inertial and viscous forces and is defined by
Re = ρU∞c
µ (1.1)
where ρ is the fluid density, U∞ is the inlet speed, c is the airfoil chord and µ the dynamic viscosity of the fluid. This parameter characterizes the fluid flow but does not take into con-sideration the oscillatory essence of the problem.
Another used parameter is the reduced frequency that relates the velocity of the approaching flow and the velocity that the airfoil is moving, being broadly used in unsteady aerodynamics and aeroelasticity. It is defined as
k = 2πf c
U∞ (1.2)
where f is the motion’s frequency. The motion’s amplitude is typically divided by the aerody-namic chord creating a dimensionless number that conveys the notion of how much the airfoil is moving. The dimensionless amplitude is expressed by
h = A
c (1.3)
with A being the motion’s amplitude. Since this problem is related to oscillating flow mecha-nisms, we can define the Strouhal number based on these last two parameters, k and h. The Strouhal number is then defined by equation 1.4.
St = f W
U∞ (1.4)
where W is the wake length (W = 2A). It can also be shown that
kh = πSt (1.5)
which represents the maximum non-dimensional plunge velocity. Although this is a dimensionless parameter that characterizes the fluid flow, it does not represent one and only one fluid flow configuration because, for example, for a certain value of k there is an infinite number of h’s that result in the same kh or Strouhal number. It is also important to be noted that the frequency
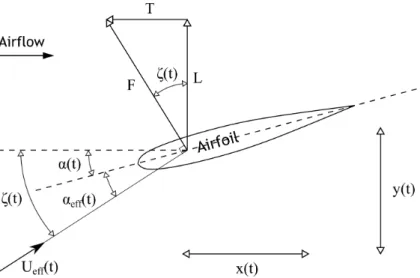
f in the Strouhal number is not the frequency of vortex shedding but the motion’s frequency. This parameter also gives the maximum effective angle of attack during the airfoil’s motion which is correlated to leading edge flow separation. Based on the two-dimensional flapping problem represented in Figure 1.1.
α(t) x(t) y(t) L T F αeff(t)
The effective angle of attack is defined as αeff = arctan ( − ˙y(t) U∞ ) + α(t) (1.6)
where α(t) is the angle of attack, typically defined as
α(t) = α0+ Aαsin (2πfαt + ϕ) (1.7)
with Aα, fαand ϕ being the pitching amplitude, frequency and phase angle between plunging and pitching, respectively.
Keeping in mind the plunging case ( ˙α(t) = 0) and the definitions of h and k, the effective angle of attack may be written as
αeff= arctan (−kh sin(2πft)) + α0
which has a maximum value of
αeffmax= arctan (kh) + α0
As said before, the flapping mechanism is typically correlated with thrust production since it can, in some conditions, positively change the wake momentum and because of that, it is important to evaluate not only the generated force but also the propulsive efficiency which is the ratio between the generated power,−DU∞, and the power supply given by L ˙y + M ˙α. The propulsive efficiency is then defined as
η = CtU∞ Cp (1.8) where Ct=− 1 ∆t ∫ t+∆t t Cddt (1.9) and CP =− 1 ∆t ∫ t+∆t t ˙ yCl+ ˙αCmdt (1.10)
In these two last equations, Ctis the thrust coefficient, Cdis the drag coefficient, Clis the lift coefficient, Cm is the moment coefficient and CP is the power coefficient. Although called a coefficient, we see that CP is not a dimensionless quantity, having velocity units.
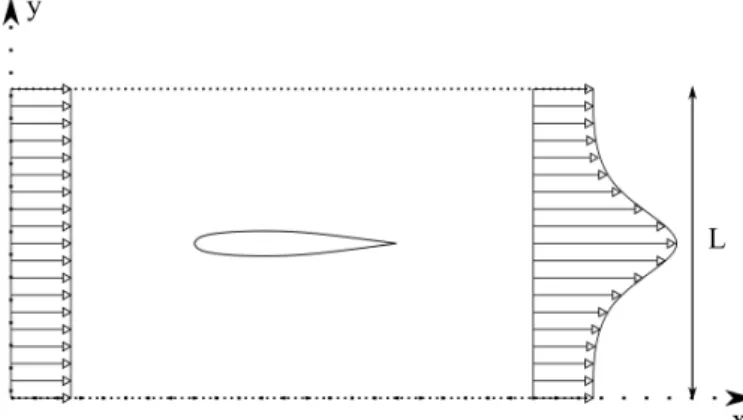
The mean thrust force can be estimated by applying the momentum balance on a control volume as represented in Figure 1.2.
This results in equation 1.11 which uses the measurements of the inlet velocity profile and the mean longitudinal velocity profile in the airfoil’s wake. Although this method is relatively simple, there is a loss of accuracy due to energy dissipation by eddies in the downstream region, as referred by Jones et al. [4]. The control volume in which this equation is applied must be chosen wisely in order to guarantee that the integrand goes to zero at the boundaries of the
Figure 1.2: Control volume for a flapping airfoil producing thrust. control volume. T = ρ ∫ L 0 U (x0, y)2− U∞2dy (1.11)
The flapping wing mechanism was first explained by Knoller [7] and Betz [8] where they found that while plunging an airfoil, an effective angle of attack would be created and change si-nusoidally over time, creating an oscillatory aerodynamic force normal to the relative velocity which could be decomposed in lift and thrust forces as already shown in Figure 1.1. Katzmayr [9] was the first to experimentally verify the Knoller-Betz effect in an interesting way, by placing a stationary airfoil into a sinusoidal wind stream and measuring an average thrust.
However, the Knoller and Betz theory was only based on the airfoil motion and did not account for the vorticity shed downstream of the airfoil. In fact, the airfoil’s continuous motion would result in lift production and a change in the circulation bounded to the airfoil and, taking into account that the circulation in the flow field must be constant with time, according to Kelvin’s and Helmholtz’s theorems, then there must be an equivalent circulation of opposite sign, shed from the airfoil into the wake.
Thus, later in 1935, Kármán and Burgers [10] successfully explained theoretically the thrust gen-eration mechanism based on the vortex shedding on the downstream side of the airfoil and the orientation of the wake vortices. They modeled the wake of the flow past bluff bodies at low Reynolds numbers by an infinite row of alternating vortices, commonly known as von Kármán vortex street which is always associated with the production of drag. This typical configuration of wake vortices causes a momentum deficit in the wake compared to the upstream flow and the body experiences drag. This type of wake is commonly referred to as a drag producing wake as shown in Figure 1.3.
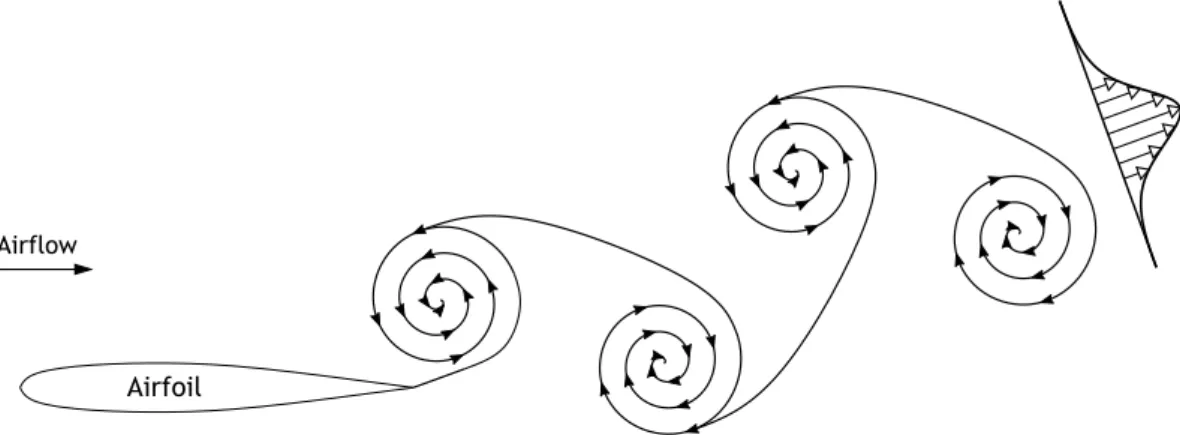
In contrast, the flow past a flapping flat plate or airfoil (pure plunging, pitching or both com-bined) may produce a wake where vortices induce a velocity or a momentum surplus in the wake compared to the upstream flow which creates a jet-like flow that generates a propulsive force explained by Newton’s third law of motion. This type of wake, associated with thrust production is represented in Figure 1.4. All these concepts were further studied by Freymuth [11] using flow visualization of both plunging and pitching motions.
Figure 1.3: Typical von Kármán vortex street (velocity profile indicates a momentum deficit).
Airfoil Airflow
Figure 1.4: Inverted von Kármán vortex street (velocity profile indicates a momentum surplus).
At about the same time as Kármán and Burgers, Garrick [12] applied Theodorsen’s inviscid, in-compressible, oscillatory, flat-plate theory [13] to the determination of the thrust force and showed that plunging airfoils generate thrust over the whole frequency range and the thrust produced by the airfoil’s motion was approximately proportional to the square of kh, whereas pitching airfoils do so only with frequencies above a certain critical value and as a function of the pivot location, for example, an airfoil pitching about a point 0.25c from the leading edge, the critical reduced frequency value would be about 3.25. It should be noted that Garrick considered potential flow which does not take into consideration the viscous effects and only represents small amplitude oscillations. Nevertheless, the use of inviscid methods is not absurd when con-sidering a satisfactorily large Reynolds number and a reduced angle of attack as suggested by Platzer et al. [3].
Flapping airfoils, more specifically plunging airfoils, have been also analyzed by Lai and Platzer [14], Lewin and Haj-Hariri [15] and Young [16], where the wake structures were intensively stud-ied, such as the vortex-pair shedding that represent the transition from the drag producing wake to the thrust producing inverted von Kármán vortex street. Young and Lai [17] concluded that this type of wake structure, represented in Figure 1.5, was caused by the interaction between bluff-body type natural shedding from the trailing edge and the motion of the airfoil.
An additional type of vortex shedding characterized by an asymmetrical vortex shedding appears when the airfoil is subjected to substantial reduced frequencies and plunge amplitudes, in other words, relatively high Strouhal numbers. Bratt [18] identified this type of vortex shedding but it was only Jones et al. [4] who meticulously studied this phenomenon experimentally and nu-merically, concluding that its genesis was due to the closeness of the shed vortices and that it was essentially an inviscid occurrence.
Airfoil Airflow
Figure 1.6: Deflected vortex street.
Although thrust production is an essential part of the flapping mechanism, it is imperative to de-velop a propulsive system with high efficiency. Therefore, aiming to maximize the performance of this mechanism, Schmidt [19] proposed the tandem airfoil arrangement, demonstrating ex-perimentally that a stationary airfoil positioned in the wake of a flapping airfoil doubles the propulsive efficiency of the single flapping airfoil because the stationary airfoil converts the vortical energy generated by the flapping one into additional thrust.
In 1996, Tuncer and Platzer [20] used a Navier-Stokes code to estimate the thrust force and propulsive efficiency for a flow passing a NACA0012 undergoing pure plunging motion. For a Reynolds number of 3× 10⁶, they found out that maximum propulsive efficiency with values
close to 0.75 could be achieved for k = 0.2 and h = 0.4 but the thrust coefficient would be considerably affected with a value of 0.01. With the same objective as Schmidt [19], these two authors have also studied the flapping/stationary airfoil combination in tandem configuration and concluded that if a stationary airfoil is placed downstream of the plunging airfoil separated by two chord lengths the propulsive efficiency could be increased by 40% and 33% in thrust co-efficient at k = 0.75 and h = 0.2.
Over the following year, Jones and Platzer [21] presented their results using a 2D incompress-ible unsteady panel method (UPM) to investigate if the effect of varying the airfoil’s thickness would have any influence on the flow over different airfoil sections undergoing pure plunging motion. They finally found that this parameter does not have an impactful effect on thrust generation and propulsive efficiency in the range of frequencies (k = 0.01− 10) and amplitudes (h = 0.1− 0.4) tested.
Interested in finding which flying conditions animals operate in, Taylor et al. [22] dedicated their studies to forty two species of birds, bats and insects in cruise flight and verified that these creatures fly within a limited range of Strouhal number between 0.2 and 0.4, concluding
that this parameter is a possible indicator of the flapping conditions that provide the most ef-ficient flight, being essential to characterize the flight of several natural flyers, regardless of their scale.
Other studies carried out so far show that optimum propulsive efficiencies are achieved within the same range of Strouhal with numerical studies corroborating these results. It’s noteworthy that pitching or flapping show a wider range in Strouhal number domain where we find rather good propulsive efficiency, whereas when considering only plunging, satisfactory efficiencies are exclusively achieved in a narrower range of St. However, as explained before, there is evidence that suggests that the Strouhal number alone is not sufficient to characterize the flapping-foil propulsion problem, especially when extreme leading or trailing edge separation is present. Tuncer et al. [23] using a 2D compressible Navier-Stokes solver studied the flow around an air-foil undergoing pure plunging motion at Re = 106. They verified that the maximum achievable
thrust depends directly on kh, losing this dependency after a critical value where dynamic stall starts occurring due to the weak resistance that a laminar boundary layer has to separate. This dependence on kh was seen, always under the critical value, even if you have selected a large amplitude and low frequency or vice versa. Additionally, it was argued that for optimal propul-sive efficiency, it is advantageous to operate in the low frequency and large amplitude range. The same is not said by Platzer et al. [3] where they found that at a Reynolds number of 20000 and for a given kh, operating at high frequency and low amplitude would favor the aerodynamic performance since it can reduce significantly the adverse effect of the leading edge vortex. Although these conclusions seem contradictory, the flapping airfoil problem is highly sensitive to the governing parameters and its initial conditions affect significantly the aerodynamic per-formance and in order to deeply investigate the problem, a wider range of both k and h must be studied to evaluate what are the values of h and k that may limit thrust production and optimal propulsive efficiency, to scrutinize what is the best combination of plunge amplitude and reduced frequency (kh) for maximum thrust generation and optimal propulsive efficiency and how some effects (leading edge separation and dynamic stall) may impact the aerodynamic performance.
Jones et al. [24] used the laser-Doppler velocimetry method to measure the jet profile in the wake of a plunging airfoil and verified that thrust increases with both frequency and motion’s amplitude. In terms of propulsive efficiency, one of their conclusions was that it is more effi-cient to flap a wing very slowly since the efficiency approaches unity as the reduced frequency approaches zero as shown by Garrick [12] and numerous inviscid computations. However, when considering a real fluid, the viscous and pressure drag effects cancels the thrust generated at low frequencies, which perturb entirely the aerodynamic performance.
The plunging motion was further investigated by Young and Lai [25, 26] where they concluded the tremendous impact of the several parameters governing this problem, especially the Strouhal number which showed that maximum thrust and optimum efficiency take place at the near dynamic stall boundary. However, in lower Reynolds numbers, the problem becomes more complicated because efficient thrust generation is achieved by shedding from both leading and trailing edges. Along with these results, the authors recommend that it is more beneficial to operate at a high k and a low h than at a low k and a high h as stated in [3].
When considering the flapping case, Anderson et al. [27] and Isogai et al. [28] found out that the phase angle between plunging and pitching was a critical parameter that highly affects the propulsive efficiency. However, this parameter was not the only one which could impact the aerodynamic performance since Guglielmini and Blondeaux [29] investigated the effect of the pivot position and concluded that the location for maximum efficiency would be at 1/3c from the leading edge. Ramamurti and Sandberg [30] used a Navier-Stokes solver where the pivot point location for the airfoil was 1/4c and the flow Re was 1100. They also found that max-imum thrust is obtained when the pitching motion leads the plunging motion by 120◦ and the maximum propulsive efficiency occurs at ϕ = 90◦, showing that it is not always easy to achieve a good thrust coefficient with good aerodynamic performance.
In 1998, Tuncer et al. [23] investigated the flow over a 2D NACA0012 airfoil using a combination of pitching and plunging at ultra-low Reynolds numbers. It was observed that for all values of k considered, the maximum propulsive efficiency would be achieved when the phase angle ϕ was around 90◦. In a similar study, Tuncer and Platzer [6] investigated the effect of dynamic stall on the propulsive efficiency and thrust generation and concluded that as soon as dynamic stall occurs, the propulsive efficiency starts to drop rapidly.
Tai and Lim [31] studied quite a few airfoils including one which was inspired from the cross-section of a bird’s wing and intensively studied their performance when varying several param-eters such as reduced frequency, Strouhal number, incidence and phase angles, verifying that efficiency, thrust and lift production are highly affected by the mentioned parameters but with different levels of significance, also concluding that the airfoil shape was more influential on lift than in thrust generation, while motion parameters have a bigger impact on thrust than in lift generation. Their results showed that the symmetrical NACA0012 is recommended to achieve good efficiency and favorable thrust production whereas the birdy airfoil would be the perfect choice for lift production with a maximum average lift coefficient of 2.23. However, the S1020 airfoil was the one with the best performance, since it generated high thrust and lift forces with relatively good efficiency.
As mentioned previously, the flapping mechanism creates a row of alternating vortices that over time exhibit a jet-like flow responsible for the propulsive force. However, under certain condi-tions, vorticity zones may also appear on the leading edge of the airfoil due to strong adverse pressure gradients which are highly correlated with kh parameter. The leading edge vortex (LEV) still faces a lot of controversies relative to the effects on the thrust force, propulsive effi-ciency and further development in analyzing different flapping flight regimes. The LEV creates a lower pressure zone which results in a large suction on the upper surface and its formation highly depends on the Reynolds number. For a Reynolds number around 103−104, corresponding
to larger insects, the leading edge vortex can enhance lift by attaching a bounded vortex core to the upper leading edge during wing translation. It is shown that the dynamic stall may act as a thrust enhancement mechanism as well as a lift enhancement mechanism.
However, the dynamic stall is an impactful phenomenon on the aerodynamic performance. Van der Wall and Geissler [32] dedicated their studies on improving the efficiency by diminishing the dynamic stall effect which is energetically demanding. Recent research has shown that when the airfoil is operating at optimal conditions, the leading edge vortex is insignificant or
nonexis-tent. It is also known that dynamic stall can be controlled by modifying the leading edge shape or introducing chordwise flexibility. These two authors investigated pure plunging motion with dynamic deformation of the airfoil leading edge which is considered to be similar to pitching and plunging combined. They also verified that the aerodynamic performance would increase when considering the deforming airfoil’s leading edge, opening new ways to improve the project of helicopter rotor which is typically subjected to the dynamic stall phenomenon. Another way to improve the aerodynamic performance was explored by Let et al. [1] where they modified geometrically some symmetrical NACA airfoils in order to enhance the propulsive efficiency. Saffman and Sheffield [33] appeared to be the first to conclude that the lift enhancement was caused by an attached leading edge vortex. Heathcote and Gursul [34] confirmed that con-vected leading edge vortices enhance lift production but also added that deflected jets were also a possibility. These stable deflected jets, as shown in Figure 1.6, form at high Strouhal numbers and the asymmetry in the wake is a synonym of high lift coefficient, even for an angle of attack of zero. Additional information about convected leading edge vortices is given by Li and Wu [35] that concluded that a LEV convecting downstream on the upper surface of an airfoil enhances the lift if the vortex has not passed the maximum airfoil’s thickness zone.
Several experimental studies have been employed to investigate the flow field and to analyze the effect of flapping parameters on the thrust generation and propulsive efficiency from oscil-lating foils but it is not always easy to experimentally get results such as pressure field in such unsteady problem. Therefore, considerable effort has been made to develop numerical meth-ods that accurately represent the problem. Among the various numerous approaches, methmeth-ods such as unsteady potential flow and Navier Stokes computations with different turbulent models are the most commonly used. The unsteady potential flow methods offer a good understand-ing relatively to how thrust, lift and propulsive efficiency change with flappunderstand-ing parameters but generally these methods over predict the aerodynamic performance due to the neglection of viscous effects, particularly when leading edge separation is present. On the other side, 2D and 3D Navier-Stokes computations take into account the viscous effects which estimate the conditions that favor leading edge vortex formation and how impactful on the aerodynamic per-formance they are.
Over the past years, the development of newer computational resources made Navier-Stokes computations practicable and the consequent abandonment of the inviscid flow assumption. While most of these computations are performed with the assumption of laminar flow, some researchers use a turbulent model to simulate possible turbulent effects that may be present, which has an influence on the fluid flow since it normally reduces the extent of the separation near the trailing edge, reducing the strength of the bluff-body type shedding, as identified by Young and Lai [17].
Although the vast majority of computations are made with two-dimensional flows, researchers are well aware that a practical application of the flapping system will certainly contain three-dimensional effects such as wingtip vortices and influences from the wing aspect ratio. How-ever, Kozłowski and Kudela [36], who studied the flow patterns generated by a flapping airfoil at low Reynolds number flows conclude that, even if the flapping mechanism is naturally a three-dimensional problem, a two-dimensional approach captures the essence of flapping flight aerodynamics.
Advanced 3D computations, especially when resolving Navier-Stokes equations, as solved by Shyy and Liu [37], are still extraordinarily expensive in terms of computational resources and as a result, the use of as for instance panel codes or Euler approaches became very popularized in 3D. Koochesfahani [5] was one of the first to analyze the 3D vortex structures created by an oscillating airfoil concluding that the magnitude of the axial flow suggests a linear dependence on the oscillation frequency and amplitude. Jones et al. [38] as Persson et al. [39] studied nu-merically the effects of 3D geometries on the aerodynamic performance obtaining the pressure distribution and flow field around the flapping wing concluding that in general 2D computations are very much optimistic.
Persson et al. [39] studied the 3D flapping wing problem and verified that methods which take into account potential flow were powerful and accurate when analyzing the aerodynamic be-havior of streamlined shapes but they also say that when flow separation was present, the same methods would not give a good estimate of the aerodynamic performance. As expected, the methods used, predicted massive suction peaks in the leading edge zone which precedes a strong adverse pressure gradient that in real flows would be the cause of flow separation. They con-cluded that at lower angles of attack the flow remains attached with small regions of separated flow and at higher angles of attack the flow separation dominated the second half of the down-stroke persisting through the first quarter of the updown-stroke which was a sign of intense viscous effects when the lifting surface was subjected to huge force demand. The same conclusion is reported by Choi et al. [40], who investigated both plunging and surging of a wing.
Even though combined plunging and pitching are recommended to achieve a good aerodynamic performance, some authors dedicated their studies to discover new oscillation modes such as those shown by the use of flexible airfoils. This is the case of Heathcote and Gursul [41] who tested experimentally a harmonically plunging flexible airfoil finding out that a certain degree of flexibility significantly increases the aerodynamic performance, which made them conclude that there is a compatibility between a plunging chordwise-flexible airfoil and a rigid airfoil oscillating in pitch and plunge.
Pederzani et al. [42] in 2006 studied the effect of flexibility and density of the airfoil finding out that a heavier and flexible airfoil, which is commonly found in nature, generated thrust at rather lower input power than the lighter ones and therefore the heavier airfoils were more effi-cient. On the same year, Sarkar and Venkatraman [43] introduced something new to the analysis by studying, non-sinusoidal harmonic motions used while transitioning between two different operating regimes. They also showed that flapping parameters such as the mean angle of attack and pitch axis location influence thrust force generation.
In terms of engineering, reproducing biologically inspired air and underwater vehicles that achieve an efficient operation is still an enormous challenge. However, several researchers as for instance Akkala et al. [44] dedicated their studies to the effects of flexibility in the aerodynamic performance by using PIV and time-resolved force measurements. They concluded that at low frequencies, the flexible airfoils behavior is very similar of a rigid airfoil but when the frequency was increased, the flexible airfoils started to show its advantages, by producing a larger thrust coefficient with low power coefficients which results in an outstandingly increase of the propulsive efficiency.
The majority of published research focuses on the aerodynamic performance and wake charac-teristics for a given airspeed, frequency and amplitude but insufficient investigation was made relative to the adaptation between two different operating regimes. To fulfill this gap, Luo et al. [45] investigated the aerodynamic characteristics of a flapping airfoil in the adjustment stage between two specific flight patterns during the forward flight using the multi-objective optimization algorithm. They verified that the increase or decrease of plunging amplitude or frequency can enhance the output lift force or reduce it, respectively. However, the thrust generation process is not that simple since thrust does not necessarily increase when the am-plitude increases. An important conclusion was that decreasing frequency in the adjustment phase is recommendable to achieve higher lift force with lower input power.
Another common assumption is assuming a uniform approaching flow to analyze the flow around a flapping airfoil but in a practical application, this approach may not represent the actual at-mospheric behavior. Yu et al. [46] studied the effect of a mean shear flow on the aerodynamic performance and discovered for the pitching airfoils cases that the mean shear flow couples with the vortex structures in the wake and has the potential to change the deflective direction of the asymmetric wake or can even promote the transition from symmetrical to asymmetrical wakes. In the plunging case, it is observed that the mean shear flow plays an important role on the leading-trailing edge vortices interaction and also induces aperiodic vortex shedding when large leading edge separation is present. An interesting conclusion is that when considering the same amount of lift, the flapping airfoils subjected to a negative mean shear flow generated a higher thrust which may be beneficial when operating in atmospheric flows.
Focusing now in a practical aeronautical application and in the possibility of replacing conven-tional propulsive systems with flapping airfoils, Ashraf et al. [47] decided to investigate whether flapping wings might offer some advantages for HALE (High-Altitude Long-Endurance) aircraft. They concluded that when considering a pure plunge motion very small efficiency was achieved and so it would not be a practical solution. Meanwhile, when combined pitch and plunge was executed, the lift and thrust production were favored as well as propulsive efficiency which made them recommend the flapping-wing propellers as attractive and practical to be consid-ered as a propulsive system for HALE aircraft.
One of the biggest problems nowadays is the finite limits of fossil reserves and the challenges that involve moving towards new renewable and sustainable energy processes. Researchers saw a possibility to exploit the flapping wing to extract power from air streams and already suggested various techniques to improve power generation. This was the case of McKinney and DeLaurier [48] as well as Jones et al. [49] that proposed an oscillating tandem wing power generator which shown the feasibility of an aerohydrodynamically controlled oscillating-wing power generator. The exhaustive studies regarding different geometries and operating regimes and their effects on the flapping foil mechanism are the main cause of the extraordinary improvement of energy harvesters. Karakas et al. [50] contributed to this progress by investigating both experimentally and numerically the power extracting performance of a wing that was oscillated non-sinusoidally in 2D free and constrained flows. They concluded that constrained flows offered the highest increase in efficiency when the wing’s motion was sinusoidal but for a near square-wave type oscillation, the presence of walls was not favorable to the performance of the flapping wing
power generator.
Further work is certainly required to disentangle the complexities of this problem and to stim-ulate this process, Platzer et al. [3] give some directives that in their point of view will result in a more complete understanding of the flapping mechanism. Since the vast majority of ex-periments and numerical studies use symmetrical airfoils or flat plates, the authors conclude that there should be more time invested in investigating new geometries which include brand new leading edges that may benefit the aerodynamic performance of the flapping airfoil. From the numerous studies carried out, it was observed that the thrust coefficient increases as a function of kh without any apparent limit. Notwithstanding, it is suspicious that there’s no limit due to the impressive effects of phenomena like dynamic stall and leading edge flow separation on thrust force generation and propulsive efficiency. Thus, it is worth the time to enlarge the range of parameters such as larger amplitudes and reduced frequencies to accomplish a global understanding of the flapping mechanism. It is also said that there still is a huge barrier when it comes to understanding the physics of the optimal aerodynamic performance of a flapping wing and to remove this obstacle, exhaustive studies on important parameters such as Reynolds number, geometry and flapping conditions should be made. In addition, researchers have been assuming the laminar or turbulent solution which does not totally represent this highly unsteady problem thus modeling the transition from laminar to turbulent flows is also essential to exploit the benefits of flapping-wing propulsion.
As already mentioned, several researchers have been dedicating their studies to the flapping mechanism and how the governing parameters affect aerodynamic performance. In the fol-lowing pages, the work of several authors is presented in a tabular form (Table 1.1), where the experiment’s conditions, methods and results are explained, enhanced with some commen-taries.
Table 1.1: Literature review . Authors Experiments Methods Results Notes P eter Freymuth (1988) [11 ] • Airfoil: NACA0015 c = 0 .051 − 0 .356 m U∞ = 0 .61 − 1 .22 m/s R e = 1700 − 12000 • Pure P itching f = 1 .6 H z Aα = 20 ◦ k = 2 .9 R e = 12000 • Pure Plunging α0 = 0 − 10 ◦ f = 0 .5 − 3 .5 H z A = 0 .0255 − 0 .051 m k = 0 .07 − 2 .7 R e = 1700 − 5200 • P article tracer method using tita-nium tetrachloride • Flow visualization (boundary layer separation and vorticity effects) • In both pure pitching and plunging, the thrust type vor-tex was identified where the mutual induction of the vortices in the downstream direction produce a reac-tive force on the airfoil in the opposite direction. • It was verified that plunging with a high angle of attack (α = 10 ◦ ) may be undesirable in terms of efficiency . This is due to the fact that the separation o ver the upper airfoil surface has become more pronounced and the vorticity shed enters the wake thus contributing to drag. • In some conditions, the propulsive action may be can-celed by the leading edge separation which does not allow a clear cut judgment.
Table 1.1: Literature review (continued). Authors Experiments Methods Results Notes Manoochehr M. K oochesfahani (1989) [5 ] • Airfoil: NACA0012 • Pure P itching c = 0 .08 m U∞ = 0 .15 m/s b = 0 .39 m P ivot point at 0 .25 c R e = 12000 f = 0 to 12 H z Aα = 2 and 4 ◦ • P article tracer method using food coloring • Laser Doppler V e-locimetry • Flow visualization (vorticity effects) • V elocity profiles in the wake • At higher frequencies (related with wakes with veloc-ity excess) the vortex pattern created is opposite that of a typical Kármán vortex street observed in wakes and, in fact, this pattern corresponds to a jet. • The magnitude of the axial flow appears to depend on both the frequency and amplitude of oscillation and is believe to be tied directly to the vortex circulation. Ismail H. Tuncer and Max F. Platzer (1996) [20 ] • Airfoil: NACA0012 • Pure Plunging α0 = 0 ◦ M a = 0 .3 R e = 3 .0 × 10 6 k = 0 − 1 .5 h = 0 .1 − 0 .4 • Navier-Stokes So-lution (NS) • Unsteady poten-tial flow solution (UPOT) • Interactive Navier-Stokes/potential flow solution (NSPOT) • V orticity contours • Lift and Drag coef-ficients • P ropulsive effi-ciency • The propulsive efficiency increases as the reduced frequency decreases and the flapping amplitude in-creases. • For a NACA0012 airfoil combination, the total propul-sive efficiency was computed to be 70% in contrast to 50% for a single airfoil when the leading airfoil under-goes a flapping motion at a reduced frequency of 0 .75 and an amplitude of 0 .20 chords lengths, separated by about two chord lengths.
Table 1.1: Literature review (continued). Authors Experiments Methods Results Notes K. D. Jones, C. M. Dohring and M. F. Platzer (1998) [4 ] • Airfoil: NACA0012 and NACA0015 • Pure Plunging c = 0 .01 − 0 .10 m U∞ = 0 .048 − 0 .3 m/s h = 0 .04 − 0 .2 k = 3 − 26 .1 R e = 5 × 10 2− 5 × 10 4 • P article tracer method • Laser Doppler V e-locimetry • P anel code • Flow visualization (vorticity effects) • V orticity contours • V elocity profiles in the wake • Thrust coefficient • Over a wide range of frequencies and Strouhal num-bers, it was shown that the evolution of the vortical structures is essentially an inviscid phenomenon. • At Strouhal numbers greater than one, deflected wake patterns were found experimentally and numerically . Numerically , the mode (deflected up or down) seemed to be determined solely by the initial conditions. Ex-perimentally , the wakes were observed to randomly (not periodically) alternate between modes, suggest-ing that relatively small disturbances may be sufficient to trigger the switch. • It was shown that thrust predictions based on the sim-plified momentum integral for such energetic wakes yield very poor accuracy since wake eddies are rapidly diffused when moving downstream. J. C. S. Lai and M. F. Platzer (1999) [14 ] • Airfoil: NACA0012 • Pure Plunging c = 0 .01 − 0 .10 m U∞ = 0 .04 − 0 .22 m/s h = 0 .0125 − 0 .1 k = 7 .85 − 48 .3 R e = 5 × 10 2− 3 .2 × 10 4 • P article tracer method • Laser Doppler V e-locimetry • Flow visualization (vorticity effects) • V orticity contours • V elocity profiles in the wake • Thrust coefficient • For certain conditions, two vortices of the same sign are shed from the same side before another two are shed from the opposite side, representing the transi-tion from the drag-producing wake to a neutral wake. • For k h > 1 , the vortex street is inclined at an angle pointing upward or downward relative to the neutral position of the airfoil. • Considering Umax the maximum mean streamwise ve-locity , the results indicate that Umax /U ∞ is indepen-dent of the airfoil size and is a linear function of k h .
Table 1.1: Literature review (continued). Authors Experiments Methods Results Notes Ismail H. Tuncer and Max F. Platzer (2000) [6 ] • Airfoil: NACA0012 M a = 0 .3 • Pure Plunging k = 0 .8 − 7 .85 h = 0 .0125 − 0 .7 R e = 2 × 10 4 − 1 × 10 5 • Plunging and P itching P ivot point at 1 / 3 c Aα = 7 − 20 ◦ k = 0 .3 − 1 .34 h = 0 .75 − 1 .0 ϕ = 30 − 90 ◦ R e = 1 .1 × 10 3− 1 × 10 5 • Navier-Stokes Solver • P article T races • Flow visualization (vorticity effects) • Thrust coefficient • P ropulsive effi-ciency • The propulsive efficiency is much larger for the at-tached flow cases and for the remaining cases, where a leading-edge vortex forms and the airfoil undergoes a dynamic stall loop, although the average thrust co-efficient is higher , the efficiency drops significantly . This trend can be attributed to the fact that additional work has to be done against the suction induced by the vortex. In addition, when the strong leading-edge vor-tex is shed into the wake, it disrupts the jet-like flow at the trailing edge. • As Aα increases, the massive flow separation caused by a large leading-edge vortex disappears, and the flow stays mostly attached over the upper and lower surfaces. J. Young and J.C.S. Lai (2001) [51 ] • Airfoil: NACA0012 • Pure Plunging k = 3 .93 − 20 .0 h = 0 .001 − 0 .05 R e = 2 × 10 4 − 3 × 10 4 • Navier-Stokes Solver • P article T races • Flow visualization (vorticity effects) • Thrust coefficient • Comparison of the experimental frames shows that for the same k h (the same S t), the wake can exhibit sig-nificantly different structures. • Both experimental and numerical results indicate that the wake structure is strongly dependent on both k and h , for the R eynolds number range under study .
Table 1.1: Literature review (continued). Authors Experiments Methods Results Notes K. D. Jones et al. (2002) [38 ] • Airfoil: NACA0014 c = 0 .064 m AR = 4 − 17 .4 M a = 0 .1 − 0 .3 • Pure Plunging α0 = 0 − 4 ◦ k = 0 .1 − 3 h = 0 .4 R e = 1 × 10 4− 4 .5 × 10 4 • Laser Dopple V e-locimetry • P article traces • 2D & 3D theory • 2D & 3D panel the-ory • NSTRANS • FLOW er • Flow visualization • Lift coefficient • Thrust coefficient • P ropulsive effi-ciency • T ime-averaged horizontal velocity • The 3D results rapidly approach the 2D results as AR increases. W ith AR = 4 , the predicted thrust is about 60% of the 2 D result. At low aspect ratios, the usual unsteady phase lag in Cl and Cd vanishes due to the dominant tip vortices. • When increasing α0 , the thrust in the downstroke be-comes stronger , while the thrust in the upstroke dimin-ishes. However , for low amplitudes and frequencies, mean thrust output is essentially equal for all cases which means it is independent of the mean angle of attack. • From 2D to 3D, the efficiency drops due to the influ-ence of the unsteady tip vortices, which form during the flapping cycle causing losses for the propulsive sys-tem. • In three-dimensional flow , the aspect ratio has a strong influence on the thrust output of the flapping wing. As the span decreases, the influence of the tip vortices increases.
Table 1.1: Literature review (continued). Authors Experiments Methods Results Notes J. Young and J. C. S. Lai (2004) [25 ] • Airfoil: NACA0012 M a = 0 .2 • Pure Plunging k = 4 − 20 h = 0 .00625 − 0 .075 R e = 2 × 10 4 • Flat plate theory • Navier-Stokes solver • Unsteady panel method solver • V orticity contour • Lift coefficient • Thrust coefficient • Airfoil pressure distribution • Helmholtz shear layer instability vortices are visible in between the large shed vortices. • The agreement between the experimental and numer-ical laminar results at the lower plunge amplitudes is more likely to be an indication that the flow in the experiments of Lai and Platzer[ 14 ] was laminar and not turbulent considering that, the turbulence model is doing a poor job of predicting the flow . • V alidation of the N-S code against pitching airfoil re-sults show that the freestream Mach number used in the simulations has an important effect on the forces predicted. However , reducing the Mach number does not significantly influence the wake structures ob-served in the simulations. • In general, the laminar simulations are a better match for the observed wake structures, both in terms of in-dividual features at a given combination of k and h and changes in wake structure across a range of k and h .
Table 1.1: Literature review (continued). Authors Experiments Methods Results Notes Jung-Sang Lee et al. (2006) [1 ] • Airfoil: NACA0009, NACA0012, NACA0015 and modified versions • Pure Plunging k = 2 − 8 h = 0 .1 R e = 5000 • Pure P itching P ivot point at 1 / 4 c Aα = 20 ◦ k = 1 − 12 R e = 5000 • Plunging and P itching P ivot point at 1 / 4 c Aα = 20 − 40 ◦ k = 0 .8 − 8 h = 0 .1 − 2 ϕ = 90 ◦ R e = 5000 − 12000 • Navier-Stokes solver • V orticity contour • Lift coefficient • Thrust coefficient • Moment coeffi-cient • P ropulsive effi-ciency • Airfoil pressure distribution • At high frequency (k = 10 ) the leading-edge vortex is produced at the initial stage of pitch-down motion. The leading-edge vortex does disappear and cannot reach the trailing edge of the airfoil. That is, it never interferes with the development of trailing edge vor-tex which yields inverse Kármán vortex. At the trail-ing edge, a clockwise rotating flow begins to form and grow , and then, finally sheds into the wake region. • The propulsive efficiency reaches the maximal value at the vicinity of k = 4 then it is gradually decreased while the thrust coefficient is increased quadratically . At higher frequency , the effective angle of attack, also increases and as a result, the leading-edge vortex be-comes stronger . If the vortex is stronger , the lift coef-ficient, which is more dominant in determining propul-sive efficiency than the thrust coefficient, becomes larger and propulsive efficiency is inevitably reduced. • It turns out, through the computational investigations of NACA2412, 4412, and 4612 cases, that camber does not yield a positive effect on propulsive efficiency , even though it is really crucial on lift generation. • P revious computations and observations suggest that it is unlikely to achieve maximal thrust force and min-imal input power simultaneously by the conventional airfoil.
Table 1.1: Literature review (continued). Authors Experiments Methods Results Notes D. F. K urtulus et al. (2007) [52 ] • Airfoil: NACA0012 c = 0 .06 m b = 0 .5 m • Plunging and P itching (hover con-dition) Aα = ± 45 ◦ R e = 1000 (based on maximum translational velocity) • P article Image V e-locimetry (PIV) • DNS code (Star-CD) • V orticity contour • Lift coefficient • Thrust coefficient • Three different types of vortices are observed namely leading edge vortex (LEV) generated at the leading edge of the airfoil, translational vortex (TV) generated at the trailing edge of the airfoil during the transla-tional phase of the motion and the rotational stopping vortex (RSV) at the trailing edge of the airfoil gener-ated during the rotational phase. W ei Shyy and Hao Liu (2007) [37 ] • Plunging and P itching R e = 1000 • 3D Navier-Stokes computations • Instantaneous streamlines • P ressure gradient contours • The LEV is a common feature associated with low R eynolds number flapping wing aerodynamics; the flow structures are influenced by the swirl strength and the R eynolds number , as well as the rotational rates.
Table 1.1: Literature review (continued). Authors Experiments Methods Results Notes John Young and Joseph C. S. Lai (2007) [26 ] • Airfoil: NACA0012 M a = 0 .05 • Pure Plunging k = 0 − 6 .3 h = 0 .175 R e = 20000 • Plunging and P itching P ivot point at 1 / 3 c α0 = 5 − 15 ◦ Aα = − 15 − 55 ◦ k = 0 − 2 .15 h = 0 .25 − 0 .75 ϕ = 75 − 90 ◦ R e = 40000 • 2D Navier-Stokes solver • Airfoil pressure distribution • Lift coefficient • Thrust coefficient • P ropulsive effi-ciency • The viscous drag becomes a larger component of the total axial force on the airfoil as the Strouhal number is lowered, acting to lower the propulsive efficiency at low Strouhal numbers. • The Garrick and UPM models both apply the K utta con-dition at the trailing edge to determine the total cir-culation on the airfoil. The flow is assumed to leave the trailing edge smoothly , and neither model can ac-count for any flow separation anywhere on the airfoil surface. • As the vortex forms, the associated low pressure con-tributes toward thrust as it acts on a section of the air-foil surface that is facing upstream and thus causes a forward suction. However , as the vortex is convected, it results in a drag force as it passes over the maximum thickness point of the airfoil, for which the airfoil sur-face now faces downstream and the vortex causes a rearward suction. • Flow separation and leading-edge shedding effects ap-pear to be controlled by the reduced frequency by lim-iting the time available both for vortex formation and convection of the vortex over the airfoil surface. Also, the turbulence model used in the NS simulations has an influence on the details of the flow separation but, has a much smaller impact on the thrust than on the efficiency .
Table 1.1: Literature review (continued). Authors Experiments Methods Results Notes John Young and Joseph C. S. Lai (2007) [17 ] • Airfoil: NACA0012 • Pure Plunging k = 1 − 10 h = 0 − 0 .1 R e = 20000 • 2D Navier-Stokes Solver • V orticity contours • Lift coefficient • Thrust coefficient • P ropulsive effi-ciency • It is found that Ct increases with increasing k h and follows the same trend as predicted by Garrick’ s linear analysis despite the formation of strong leading edge vortices at high k h . • It is found that for the flow R eynolds number consid-ered, it is beneficial to operate in the high k and low h combination rather than the high h and low k combina-tion because a high thrust coefficient can be achieved at high frequency and leading edge separation can be avoided at low amplitudes which can benefit in better propulsive efficiency . M.A. Ashraf et al. (2007) [53 ] • Airfoil: NACA0012 • Pure Plunging M a = 0 .05 k = 0 − 24 h = 0 .05 − 48 R e = 20000 • 2D Navier-Stokes solver • V orticity contours • W ake velocity • The flow separates upstream of the trailing edge on both sides of the airfoil, creating an effectively blunt edged body . The trailing edge of the airfoil, now acting as a bluff body , will have a vortex shedding frequency associated with it that will vary somewhat with the R eynolds number . This shedding mode is referred to as natural shedding, as opposed to the forced shedding induced by the motion of the airfoil. • The wake of the airfoil was shown to exhibit vortex lock-in as the amplitude of motion was increased in a manner analogous to that seen for vibrating circular cylinders, although the lock-in boundary was not sym-metric about the natural shedding frequency . As the plunging frequency is increased well above the natural shedding frequency , lock-in is expected to be observed for lower plunge amplitudes.
Table 1.1: Literature review (continued). Authors Experiments Methods Results Notes M. A. Ashraf et al. (2009) [47 ] • Airfoil: NACA0012 and NACA4412 • Pure Plunging R e = 1 × 10 6 h = 0 .5 − 1 .5 k = 2 − 4 Xshift = 0 .1 c − 0 .25 c α0 = 0 − 15 ◦ • Plunging and P itching P ivot point at the leading edge R e = 1 × 10 6 h = 0 .5 − 0 .75 k = 4 Xshift = 0 .15 − 0 .35 α0 = 15 ◦ Aα = 7 .5 − 20 ◦ ϕ = 90 ◦ • 2D Navier-Stokes solver • Airfoil pressure distribution • Lift coefficient • Thrust coefficient • P ropulsive effi-ciency • V orticity contours • Although sufficient lift is generated on the main airfoil by pure plunge motion of the two trailing airfoils, the propulsive efficiency is very low . Hence, it would not be practical to use pure plunge flappers as a propulsive mechanism for HALE aircraft. • When combined pitch and plunge motion is executed by the two trailing airfoils, a lift coefficient of over 2 is generated on the main wing with an overall thrust co-efficient of over 5 .5 and a propulsive efficiency of 16%. These results indicate that flapping-wing propellers are attractive and practical enough to be considered as the engine for HALE aircraft. However , the perfor-mance of flapping-wing propellers achieved here can be further improved by exploring a wider operating pa-rameter space.
Table 1.1: Literature review (continued). Authors Experiments Methods Results Notes W . B. Tay and K. B. Lim (2009) [31 ] • Airfoil: NACA0012, NACA4404, NACA6302, S1020 and ”Birdy” • Plunging and P itching R e = 10000 k = 0 .2 − 1 S t = 0 .1 − 0 .5 Aα = 5 − 30 ◦ ϕ = 60 − 120 ◦ • 2D Navier-Stokes solver • Lift coefficient • Thrust coefficient • P ropulsive effi-ciency • V orticity contours • Thrust production depends heavily on motion parame-ters, rather than the shape of the airfoil. On the other hand, lift production is primarily dominated by its air-foil shape. Efficiency falls somewhere in between. • Based on the simulations tested, the best airfoil for ef-ficiency and thrust production is the NACA0012 airfoil. As for lift production, the birdy airfoil is the best. • Overall, the S1020 airfoil is the best airfoil for most applications since it is able to provide relatively good efficiency and at the same time generate high thrust and lift forces. P.-O. P ersson et al. (2010) [39 ] • Airfoil: HT13 (Elliptical wing) • Flapping M a = 0 .1 R e = 2000 f = 1 / 20 Hz α0 = 0 − 10 ◦ • Inviscid P anel Method solver • Navier-Stokes solver • Airfoil pressure distribution • Lift coefficient • Thrust coefficient • V orticity contours • The panel method predicted a significant suction peak along the leading edge of the wing that includes a high adverse pressure gradient. This suction peak is a con-sequence of the panel method enforcing an attached flow around the sharp leading edge of the wing. In physically relevant flows, leading edge flow separa-tion is likely to occur due to the inability of viscous flows to conform to the curvature of the leading edge.