A Study on the
Possibility of Using
Greywater in Irrigation
of Agricultural Products
Malihe Gorgich
M.Sc. in Environmental Sciences and Technology
Department of Geosciences, Environment and Spatial Planning 2016
Supervisor
O Presidente do Júri,
Resumo
O decl´ınio da pluviosidade anual, juntamente com o aumento da procura de ´agua para fins agr´ıcolas originou uma nova crise no mundo actual. Neste aspecto, aten¸c˜oes renovadas est˜ao viradas para a descoberta de novos recursos h´ıdricos, como efluentes l´ıquidos, devido `a sua diminui¸c˜ao consecutiva nas ´ultimas d´ecadas. Embora tenha havido um desenvolvimento de novas metodologias e infra-estruturas de tratamentos de ´aguas residuais, estes n˜ao foram largamente aplicados em produtos de irriga¸c˜ao agr´ıcola. Adicionalmente, estudos recentes tˆem demonstrado que alguns produtos agr´ıcolas tˆem um risco acrescido de ser contaminados, n˜ao podendo ser tratados por infra-estruturas de baixo custo.
Olhando para situa¸c˜oes do quotidiano, foi demonstrado que a maior parte dos efluentes produzidos podem estar contidos numa categoria de menor polui¸c˜ao, chamada ´Agua Cinzenta. Se se excluir a categoria chamada ´Agua Preta, que inclui dejetos humanos, essencialmente provenientes de sanitas, a maior parte dos efluentes de uma casa ´e produzida a partir de cozinhas, banheiras, m´aquina de lavar lou¸ca, lavat´orios ou mesmo m´aquina de lavar roupa, sendo este conjunto denominado ´Agua Cinzenta. Uma vez que a ´Agua Cinzenta cont´em menos polui¸c˜ao bacteriana, pode ser considerada um efluente com uma boa rela¸c˜ao custo-eficiˆencia para ser tratada e reutilizada.
Nesta disserta¸c˜ao, foram estudadas metodologias actuais para tratamento de ´Agua Cinzenta, juntamente com a avalia¸c˜ao de efeitos de irriga¸c˜ao de produtos agr´ıcolas com e sem o tratamento da ´Agua Cinzenta. S˜ao ainda apresentados argumentos que recomendam a irriga¸c˜ao de colheitas com ´Agua Cinzenta.
The decrease in the annual rainfall, alongside with the increase of water demand in agricultural fields, originated a new crisis in today’s world. In this regard, attentions are directed towards finding new rater resources,like liquid effluents, for these have been steadily declining in the last decades. Although there have been some developments in wastewater treatment methodologies and facilities, they have not been widely applied for irrigating agricultural fields. Besides, recent studies have shown that some agricultural products present an added risk of being contaminated, preventing them from being treated with low-cost facilities.
Having a look to normal daily life, it has been shown that the largest part of the effluents produced can be categorized in a less polluted category, called Greywater. If the so called Black Waters, which include human dejects coming from toilets, are excluded, most of the effluents from a household are produced in bathtubs, dishwater, lavatories, or even washing machines, being denominated Greywater. Since greywater contains much less microbial pollution, it can be considered as a cost-effective effluent to be treated and reused.
In this dissertation, current methodologies for treating greywater were addressed, to-gether with the evaluation of the effects of irrigating agricultural products with treated and untreated greywater. Further discussion provides arguments for recommending irrigating crops with greywater.
To My Sweetheart
Who Rules My Dreams . . .
I would first like to thank my thesis supervisor Professor Dr. Nuno Formigo of the Faculty of Science at University of Porto. The door to Prof. Formigo office was always open whenever I had any questions about my research or writing. He was the one who steered me in the right direction whenever he thought I needed it.
I would also like to acknowledge my friends, Henrique Costa, Manuel Antonio Trelles Velasco, Samaneh Khoshrou, and Marzieh Moeen Fard at University of Porto for their help during master courses.
Finally, I must express my very profound gratitude to my husband, Hooshiar, and to my parents, Baba joon and Maman joon, for providing me with unfailing support and continuous encouragement throughout my years of study and through the process of researching and writing this thesis. This accomplishment would not have been possible without them. Thank you.
The activist is not the man who says the river is dirty. The activist is the man who cleans up the river.
- Ross Perot
List of Tables 10
List of Figures 12
1 Introduction 13
1.1 An Alternative Water Resource . . . 14
1.2 Greywater . . . 15
1.2.1 Composition of Greywater . . . 15
1.3 Greywater Usage Around the World . . . 19
1.3.1 United States . . . 19
1.3.2 Japan . . . 19
1.3.3 New Zealand . . . 19
1.4 Greywater Reuse . . . 20
1.4.1 Health Risks Associated with Agriculture Irrigation Using Grey-water . . . 20
1.4.2 Using Greywater In Irrigation . . . 21
1.4.2.1 Plant Growth . . . 21
1.4.2.2 Crop Yield . . . 22
1.4.2.3 Crop Quality . . . 22
1.5 Greywater Management System . . . 23
1.6 Conclusion . . . 24
2 Greywater: Source, Usage, and Treatment 25 2.1 Motivation . . . 25
2.2 Water Quality Evaluation Parameters . . . 27
2.2.1 Biochemical Oxygen Demand . . . 27
2.2.2 Chemical Oxygen Demand . . . 27
2.2.3 Electrical Conductivity . . . 28
2.2.4 Standards . . . 28
2.3 Worldwide Greywater Reuse . . . 29
2.4 Greywater Treatment Technologies . . . 31
2.4.1 Biological Greywater Treatment Systems . . . 31
2.4.2 Physical Greywater Treatment Systems . . . 33
2.4.3 Chemical Greywater Treatment Systems . . . 34
2.4.4 Natural Greywater Treatment Systems . . . 36
2.4.5 Greywater Recycling Scheme for Agricultural Reuses . . . 36
2.5 Systems for Garden Greywater Reuse . . . 38
2.5.1 Split Plumbing System . . . 38
2.5.2 Tank, Pump and Filter . . . 38
2.5.3 Subsurface Irrigation Network . . . 39
2.6 Crop Irrigation with Untreated Greywater . . . 39
2.6.1 Experimental materials . . . 40
2.6.2 Methodology of the Experiment . . . 42
2.7 Irrigation with Treated Greywater . . . 43
2.7.1 Materials and Methods . . . 43
2.7.2 Study Area . . . 44
2.7.4 Soil Quality and Texture . . . 45
2.7.5 Plants Leaves and Fruits . . . 46
2.8 Passive Irrigation with Greywater . . . 47
2.8.1 Brief of Method . . . 47
2.9 Irrigation with Domestic Greywater . . . 50
2.9.1 Materials and Methods . . . 50
2.9.1.1 Experimental Design . . . 50
2.9.1.2 Plant Type . . . 50
2.9.1.3 Replication and Sampling . . . 52
2.9.1.4 Greywater Characterization . . . 52
2.9.2 Plant Growth Monitoring . . . 52
2.9.2.1 Plant and Soil Nutrient Analysis . . . 52
3 Results of the Experiments 55 3.1 Results of Crop Irrigation with Untreated Greywater . . . 55
3.1.1 Results and Discussion . . . 55
3.1.1.1 Greywater Characteristics . . . 55
3.1.1.2 Irrigation Effects . . . 56
3.1.1.3 Risk analysis . . . 58
3.2 Results of Irrigation with Treated Greywater . . . 59
3.2.1 Results and Discussion . . . 59
3.3 Evaluation of Passive Irrigation with Greywater . . . 62
3.3.1 Results and Discussion . . . 63
3.3.2 Risk factors . . . 65
3.4 Results of Irrigation with Domestic Greywater . . . 66
3.4.1 Results of the Experiment . . . 67
3.4.1.1 Plant Growth . . . 67
3.4.1.2 Crop yield . . . 67
3.4.1.3 Macronutrient concentrations in crops . . . 68
3.4.1.4 Micronutrient concentrations in crops . . . 68
3.4.2 Conclusion of Experiment . . . 69
4 Effects of Greywater Irrigation 70 4.1 Effects of Greywater Irrigation on Crops . . . 70
4.1.1 Plant Growth . . . 71
4.1.2 Crop Yield . . . 72
4.1.3 Crop Quality . . . 73
4.2 Effects of Greywater Irrigation on Soil . . . 75
4.2.1 Macronutrients and Micronutrients in Soil . . . 76
4.2.1.1 Macronutrients . . . 77
4.2.1.2 Micronutrients . . . 77
4.2.1.3 Electrical Conductivity . . . 77
4.2.2 Heavy Metal Transfer . . . 77
4.3 Impacts of Greywater irrigation on Human Health . . . 78
4.3.1 Pathogen Transmission by Greywater Irrigation . . . 78
4.4 Conclusion . . . 79
5 Conclusion 81 5.1 Recommendations for Greywater Irrigation . . . 82
5.2 Health Safety Recommendations . . . 82
5.2.1 Irrigation Method on Pathogen Transmission . . . 82
Referncias 84
List of Tables
1.1 Different greywater sources (Table is adopted from [Ng, 2004]) . . . 16 1.2 Greywater characteristics from various characterization studies (*N T =
Not tested; *cfu= Colony Forming Unit) [Finley et al., 2008] . . . 18
2.1 quality standards of greywater sample from bath area drain. Table is adopted from [Fagan, 2015]. . . 29 2.2 Typical greywater parameters based on WHO report (*NTU :
Nephelo-metric Turbidity Units). Table is adopted from [Fagan, 2015]. . . 30 2.3 Experimental greywater and tap water used for irrigation. Table is
adopted from [Finley et al., 2008]. . . 41 2.4 Analysis methods. Table is generated from [Al-Hamaiedeh and Bino,
2010]. . . 45 2.5 Soil analysis methodologies. Table is generated from [Al-Hamaiedeh
and Bino, 2010]. . . 46 2.6 Measurement of greywater metric form Fagan experiment. Table is
adopted from [Fagan, 2015]. . . 48 2.7 Water quality of sample from wastewater treatment plant and field
greywater. Table is adopted from [Fagan, 2015] . . . 49 2.8 Contents of plant nutrient medium (Chemicult). Table is generated
from [Rodda et al., 2011]. . . 51 2.9 Average concentrations (±standard error of mean) and the ranges of
water constituents in greywater, nutrient solution and tap water. Table is adopted from [Rodda et al., 2011]. . . 53
from [Finley et al., 2008]. . . 57 3.2 Quality of raw and treated greywater compared with allowable limit
for restricted irrigation (¯x and SD represent average and standard deviation respectively). Table is adopted from [Al-Hamaiedeh and Bino, 2010]. . . 60 3.3 The long-term impact of greywater irrigation on soil EC, SAR and
organic matter (OM) content. Table is adopted from [Al-Hamaiedeh and Bino, 2010]. . . 61 3.4 Concentration of selected minerals and metals in olive leaves and fruits.
Table is adopted from [Al-Hamaiedeh and Bino, 2010]. . . 62 3.5 Concentration of selected chemical parameters in crop leaves and fruits.
Table is adopted from [Al-Hamaiedeh and Bino, 2010]. . . 63
4.1 Effects of domestic greywater on soils. Table is generated based on [Travis et al., 2008], [Misra et al., 2009], and [Holgate et al., 2011] . . . 75
List of Figures
1.1 Components of domestic greywater [Ng, 2004] . . . 16
2.1 Graywater recycling and treatment: possible steps and tracks. Figure is adopted from [Ghunmi, 2011]. . . 32 2.2 Possible greywater recycling scheme for agricultural irrigation reuse
purposes. Figure is adopted from [Albalawneh and Chang, 2015]. . . . 37 2.3 Schematic diagram of the greywater tank and plumbing. Figure is
adopted from [Ng, 2004]. . . 39 2.4 Layout and dimensions of subsurface irrigation network and irrigated
lawn. Figure is adopted from [Ng, 2004]. . . 40 2.5 Greenhouse experimental setup with each pot containing three plants
and triplicate pots per treatment. Figure is adopted from [Finley et al., 2008]. . . 42 2.6 4-barrel treatment unit. 1-first barrel; 2-second barrel; 3-third barrel;
4-fourth barrel. Figure is adopted from [Al-Hamaiedeh and Bino, 2010]. 44 2.7 Confined trench treatment unit. 1- first barrel; 2- confined trench;
3-barrel; 4- submersible pump. Figure is adopted from [Al-Hamaiedeh and Bino, 2010]. . . 44
3.1 Average growth rate of plants reaching full grown height. Figure is adopted from [Fagan, 2015]. . . 64 3.2 a. Average root length of a full grown crop; b. Average fresh root mass
of a full grown crop; c. Average root length seedlings; d. Average fresh root mass seedlings. All the figure are adopted from [Fagan, 2015]. . . . 65
Average final root length of seedlings; d. Average final fresh root mass of seedlings; e. Average final fresh mass of seedlings; f. Average final dry mass of seedlings. all the figure are adopted from [Fagan, 2015]. . . 66
Chapter 1
Introduction
Nowadays, the water crisis is an upcoming phenomenon that threatens countries all over the world. It is estimated that water scarcity affects a fifth of world’s population. The coincidence of the increase in the world population and the decrease in annual rainfall, has complicated the situation. Therefore, it is estimated that more persons will be influenced by the freshwater shortage [Teh et al., 2015] [Matos et al., 2014]. Various parts of world are suffering from a shortage of water resources. Regions such as the Middle East, Australia, and southwest of United States are possible regions confronting drought. Water shortage can be even happening in non-arid areas. Regions such as Japan are being affected due to a high demand of freshwater. The development of countries and the increasing demands of the population, on one side, and the shortage of freshwater on the other side, have caused an increase in the demand of energy to provide freshwater for, not only potable uses, but also irrigation and urban usages, hence making water usage and energy demands tightly linked to each other. Therefore, the increase in water provision will increase the amount of green gases emitted to the atmosphere [Matos et al., 2014].
A study of the daily life of a typical citizen, in urban areas of developed countries, shows that the water consumption can vary from 15 − 55L up to 90 − 120L per day [Nolde, 2000]. Providing such amounts of water from first-hand resources requires, not only a great effort, but also a lot of energy, which can emit a lot of carbon dioxide (CO2). Thus, the problem of providing freshwater is not only a sustainable, but also an energy efficient issue. A study carried out by Rothousen and Conway [Rothausen and Conway, 2011] revealed that the greenhouse-gases emitted by typical water treatment facilities have been underestimated in planning and management procedures.
The cause of water shortage should not be sought only in population growth. Reasons such as the mismanagement of water resources, increase in urbanization, and climate change have also negative effects on current freshwater resources. To fight the water shortage problem, possible prescribed remedies include water conservation and water reuse. Water conservation includes, for instance, the implementation of some regu-lations which can prevent the usage of freshwater in non-potable uses; for example, rules that restrict house holders to avoid using freshwater for gardening, or and toilet flushing.
Food and Agriculture Organization [Food and Agriculture Organization, 2008] have reported that more than 70% of freshwater consumption is used in agricultural ir-rigation, worldwide. At the same time, many households in poor areas (including both urban and rural areas) have a limited access to freshwater. There are some alternatives that can be used instead. For instance, wastewater treatment and reuse at the individual household can be considered as a local solution to the emerging problems of supplying water and nutrients needed for household food production. To be more precise, the discussed solution has already been used by farmers worldwide since it is estimated that 10% of the world’s population consumes foods which are irrigated with wastewater [World Health Organization, 2006]. Therefore, treatment of wastewater and reusing it for irrigation may supply the increasing demand on freshwater and improve the food production capacity of farms. However, there are significant concerns about the safety of reusing wastewater in irrigation. The main concern is the potential for damaging effects of poor-quality water on soil, plants and finally human’s health. Studies have shown that the microbial population of untreated wastewater is very diverse. Microorganisms that can cause illness or disease (which are known as pathogens,) are usually associated with human or animal fecal matter present in wastewater. Diseases such as food-borne illness are thought to be have direct relation with the irrigation with water contaminated with pathogens [Finley et al., 2008].
1.1
An Alternative Water Resource
Source separation of wastewater flows from domestic sources has recently become an important strategy to simplify wastewater treatment. This model is based on excluding human solid wastes (black water) from the remaining wastewater flow (greywater). Greywater has come to designate wastewater derived from hand basins, showers, baths,
CHAPTER 1. INTRODUCTION 15
laundry machines, and occasionally dishwashers and kitchen sinks. Installing dual reticulation plumbing can be a fast solution to separate the blackwater flow from greywater effluent from the source. The separated greywater can then be routed to an on-site treatment system or sent to a communal greywater facility and reused for other purposes [Diaper and Sharma, 2007]. Greywater recycling not only reduces water requirements of a building, but can also significantly reduce the volume of effluents being sent to the sewer or septic system. Therefore, it is economic and vital, especially for residents of water-scarce regions [Finley, 2008].
1.2
Greywater
Greywater is defined as water collected from sewage discharge of cloth washers, bath-tubs, showers and sinks, and does not include wastewater from kitchen, dishwasher and toilet [Al-Jayyousi, 2003]. However, in some studies, sewage originated from dishwashers and kitchen is also considered as greywater. In some references, such as [Madungwe and Sakuringwa, 2007], greywater is defined as the non-toilet wastewater, collected from house activities: showers, baths, hand basins, washing machines and kitchen sinks.
The use of untreated domestic greywater for plants irrigation in small home gardens has several advantages [Holtzhausen, 2005] [Al-Zubi and Al-Mohamadi, 2008]. The most highlighted one can be called potable freshwater saving. Studies have shown that it can reduce household potable water usage by about 30% [Jeppesen, 1996] [Mzini, 2013].
1.2.1
Composition of Greywater
Greywater represents 50−80% of the wastewater from a household. The largest section which produces greywater in any household is the bathroom [Ng, 2004]. Different types of greywater produced in a typical household are shown in Figure 1.1 while it has been explained in Table 1.1.
Greywater usually does not have any unpleasant odor. Comparing to wastewater, greywater is produced in higher temperature. Additionally, it contains readily degrad-able pollutants, thus it is required to be treated immediately. Storing it in tanks, even for short times, leads to the development of oxygen deficient bacteria and scum will
Figure 1.1: Components of domestic greywater [Ng, 2004]
Table 1.1: Different greywater sources (Table is adopted from [Ng, 2004])
Kitchen Kitchen greywater contains food residues, high amounts of oil and fat, including dishwashing detergents. In addition, it occasionally contains drain cleaners and bleach. Kitchen greywater is high in nutrients and suspended solids. Dishwasher greywater may be very alkaline (due to builders), show high suspended solids and salt concentrations.
Bathroom Bathroom greywater is regarded as the least contami-nated greywater source within a household. It contains soaps, shampoos, toothpaste, and other body care products. Bathroom greywater also contains shaving waste, skin, hair, body-fats, lint, and traces of urine and feces. Grey water originating from shower and bath may also be contaminated with pathogenic microorganisms. Laundry Laundry greywater contains high concentrations of chemicals from soap powders (such as sodium, phos-phorous, surfactants, and nitrogen) as well as bleaches, suspended solids and possibly oils, paints, solvents, and non-biodegradable fibers from clothing. Laundry greywater can contain high amounts of pathogens when nappies are washed.
CHAPTER 1. INTRODUCTION 17
be formed which will float on the water in the collection tank [Lehr and Keeley, 2005]. In developed countries, greywater corresponds to about 60−70% of domestic wastewa-ter volume [Friedler, 2004]. Typically, when evaluating basic wawastewa-ter quality paramewastewa-ters (total suspended solids or TSS, biochemical oxygen demand or BOD, chemical oxygen demand or COD, turbidity), greywater is ranked to be comparable to a low or medium grade wastewater; however, several properties of greywater need to be considered in order to limit the reuse challenges. Jefferson et al. ([Jefferson et al., 2004]) found that, though similar in organic content to full domestic wastewater, greywater contains fewer solids and has less turbidity than wastewater. The same study also suggested that the COD-BOD ratio in greywater can approach 4 : 1, much higher than that of untreated domestic wastewater, which is typically around 2 : 1. Since greywater is mainly collected from washing activities, it is richer in surfactants, which in one study reached up to 60mg/L [Gross et al., 2005]. As soaps and detergents are often alkaline, the pH of greywater is measured in the range of 7 − 8 [Jefferson et al., 2004]. Also, it can contain high concentrations of nitrogen (N), phosphorus (P), and potassium (K). Nutrients minor quantities can be detected in greywater samples, rarely exceeding 5mg/L [Surendran and Wheatley, 1998] [Jefferson et al., 2004].
Microbiology evaluations show that both greywater and blackwater can be quite similar, containing analogous species of microorganisms [Ottosson, 2005]. Such lev-els of organisms used to signal pathogenicity, including fecal coliforms, enterococci, and bacteriophages, consent researchers to rank greywater only mildly less [Jefferson et al., 2004] [Casanova et al., 2001], and in one study even more [Brandes, 1978], contaminated than full blackwater.
Greywater composition varies widely from one household to another, depending on both the personal habits of residents, and the products used in the household. For example, low phosphate concentrations are detected in the greywater collected from a household in which the inhabitants tend to use phosphate-free laundry detergents. Family makeup also impresses the quality and contents of greywater. Other studies have found higher counts of total and fecal coliforms in greywater collected from households with small children [J. B. Rose, 1991] [Casanova et al., 2001]. Greywater characteristics from previous studies are presented in Table 1.2.
Greywater characteristics also vary according to source: each fixture contributing to the greywater collection system will carry its own particular contaminant load. Friedler [Friedler, 2004] recommends excluding fixtures like the kitchen sink and dishwasher from a greywater system, because they constitute only 25 − 30% of greywater volume
Table 1.2: Greywater characteristics from various characterization studies (*N T = Not tested; *cfu= Colony Forming Unit) [Finley et al., 2008]
Parameter [Christova-Boal et al., 1996] [Friedler, 2004] [Surendran and Wheatley, 1998] Bathroom and Laundry Shower and Laundry Shower and Laundry pH 6.4 − 10 7.4 − 7.5 7.6 − 8.1 TS mg/L N T 1090 − 2021 631 − 658 COD mg/L N T 319 − 996 424 − 725 NH4+−N (mg/l) < 0.1 − 15 1.2 − 4.9 1.56 − 10.7 P (mg/L) 0.062 − 42 3.3 − 55.0 1.63 − 101 AL mg/L < 1.0 − 21 N T N T Ca mg/L 3.5 − 12 N T N T Cd mg/L < 0.001 N T < 0.001 Cu mg/L < 0.05 − 0.27 N T 0.11 − 0.32 Mg mg/L 1.1 − 2.9 N T N T Na mg/L 7.4 − 480 151 − 530 N T Pb mg/L N T N T 0.003 − 0.03 S mg/L 1.2 − 40 N T N T Fe mg/L 0.29 − 1.1 N T N T Zn mg/L 0.09 − 6.3 N T 0.059 − 0.31 Fecal coliform (cfu/100mL) 110 − 3.3 × 10³ 4.0 × 10⁶ 600 − 728 Fecal streptococci (cfu/100mL) 23 − 2.4 × 10³ N T N T
CHAPTER 1. INTRODUCTION 19
but contribute nearly half of its COD content. Therefore, a lower effort would be needed to treat less contaminated greywater for further reuse [Finley, 2008].
1.3
Greywater Usage Around the World
1.3.1
United States
During the severe water shortages in states such as California, Southern Arizona, and Florida, in the late 70s, water authorities carried out some researches to implement alternative water sources. The water authorities of the western states suggested the use greywater for irrigation purposes. In 1989 the County of Santa Barbara regulated new rules in order to reuse greywater [Jeppesen and Solley, 1994]. In the next three years, more than 10 cities used the same regulation to provide a new water source. Later, in 1998, 22 western states of the USA adopted rules to use untreated domestic greywater directly for sub-surface irrigation [Emmerson, 1998]. Also, different greywater reuse systems are operating across the United States, mostly for irrigation purposes [Lindstrom, 2000].
1.3.2
Japan
A shortage of potable water in Japan made the Japanese review their water con-sumption habits. They separated potable and non-potable usage of water by reusing treated wastewater effluent for toilet flushing, ornamental ponds and fountains, and landscape irrigation. This water generally comes from local domestic wastewater treatment plants, that are mostly small scale systems [Thomas et al., 1997] [Jeppesen and Solley, 1994] [Emmerson, 1998]. Restrict guidelines have been enforced to improve the quality of treated effluent; however, the user should take the responsibility for usage circumstances. Greywater is mostly originated from washing purposes like hand-basin toilet, bath water or washing clothes [Thomas et al., 1997].
1.3.3
New Zealand
Households are encouraged, mostly by local councils, to install biological treatment units to reuse household sewage for garden irrigation. It is suggested to use Aerated Wastewater Treatment Systems instead of a traditional septic tank, to improve the
quality of treated effluent. The most common application of treated greywater is garden irrigation. There are some regulations recommending the owners to maintain their systems every three years [Ng, 2004].
1.4
Greywater Reuse
Studying water usage in houses shows that the water provided with drinking quality, is used in non-related purposes such as toilet flushing, gardening or car washing, which do not require water with such quality.
The average volume of water being used by households differs not only among de-veloping and developed countries, but also within different regions inside a country. Household water demand, in developed countries, is about 100 to 150L per capita in each day.
Greywater reuse for household can lead to 29 − 47% reduction in freshwater treatment to produce potable, and it can be reused for many purposes, such as flushing, gardening and washing the floors.
Although treated greywater can be used for potable uses theoretically, unfortunately current practical treatment systems are too sophisticated and involve many units and process equipment. Regarding in-site and decentralized treatment systems, there is a need to develop a system that can be easily implemented and used.
1.4.1
Health Risks Associated with Agriculture Irrigation
Us-ing Greywater
Health hazards associated with greywater may arise from several sources as they are reported below:
1. Contamination by pathogenic micro-organisms that includes bacteria, protozoa, viruses and other parasites, in concentrations high enough to present a health risks;
2. Chemical pollution of dissolved salts (sodium, nitrogen, phosphates, chloride and boron) or by organics (oils, grease, milk, soap, detergents and xenobiotic compounds);
CHAPTER 1. INTRODUCTION 21
3. Physical pollution of particles (dirt, food, lint) may degrade soil structure, clog groundwater flow paths or cause non-wetting characteristics in soils;
However, risk to consumers can be greatly reduced by crop restriction, modifying irrigation techniques and human exposure [Salukazana et al., 2005].
Caution must be taken before reusing greywater for domestic purposes. It is often used without prior treatment and can spread fecal particles and other organic materials into the surroundings, which exposes individuals to pathogens [Gross et al., 2007].
To prevent the spread of contaminants, a combination of physical filters and aerobic biological processes must be used to remove suspended solids and other hazardous organic materials from greywater. Aerobic filters and bioreactors such as membrane aeration bioreactors (MABR’s), biological aerated filters (BAF’s), membrane biore-actors (MBR’s), and rotary biological contbiore-actors (RBC’s) are known to be the most effective methods for trapping harmful contaminants [Li et al., 2009].
Greywater that is stored in a tank should also be used within 24 hours. Bacteria and other pathogens can multiply in that amount of time and can turn recycled greywater into blackwater [Dixon et al., 2000]. If the recycled greywater is going to be used to irrigate plants, the use of drip lines, that are placed beneath the soil, must be assured, instead of hoses or misters which are used to spray the water into the air. This will just spread any pathogens present into the air [Allen et al., 2010].
1.4.2
Using Greywater In Irrigation
Recently, there have been various studies carried out to analyze the impacts of reusing greywater for irrigation purposes. Two different schemes can be proposed to apply greywater for irrigating crops, with either treated or untreated greywater. Although each scheme has its own advantages and disadvantages, experiments have shown various results. Several factors should be taken into consideration when a water resource is chosen for agricultural irrigation; plant growth, crop yield, and crop quality. Each factor presents a different trend regarding the irrigation water source.
1.4.2.1 Plant Growth
One can propose to use greywater for irrigation directly without any treatment. How-ever, studies have shown that irrigation with non-treated greywater can reduce plant
growth because of the presence of some toxic elements, namely boron (B), chlorides (Cl–), and cadmium (Cd). Although some compounds present in greywater, such as Phosphate (PO43 –), are essential for plant growth, high levels of concentration can pollute soil and plants. Therefore, caution must be taken into consideration when irrigating sensitive plants with greywater [Ayers and Westcot, 1994]. In another experiment, plants such as silver beet showed a small reduction in shoot and root biomass when irrigated with untreated greywater compared to a situation when they were irrigated with treated greywater [U. Pinto, 2010].
On the other side, there are some types of plants which show different behavior when irrigated with greywater, compared to irrigation with potable water. Day et al. [Day et al., 1981] showed that cotton grows faster and longer if they are fed with greywater. Similarly, Rusan et al. [Rusan et al., 2007] showed that the presence of essential compounds such as K, N, and P in greywater results in longer cotton plants. They also studied plants such as tomato and lettuce, but reported no significant difference in growth.
Regarding plant growth, studies suggest to treat greywater before irrigation uses. The reason lies upon the presence of toxic elements or compounds in the greywater.
1.4.2.2 Crop Yield
It has been shown, in several researches, that irrigation with greywater increases crop yield, because of the presence of nutrients such as nitrogen and phosphorous in greywater [Rusan et al., 2007]. In a study performed by Day et al. [Day et al., 1981], cotton yield improved when the plant was irrigated with a mixture of untreated greywater and groundwater compared to irrigation with only groundwater. Also in tomato, irrigation with greywater resulted in higher nutrient uptake and biomass at the flowering, comparing to freshwater irrigation [Misra et al., 2009]. Higher yield of some crops is due to higher concentration of nutrients in greywater.
Contrarily, in a study performed in [Al-Zubi and Al-Mohamadi, 2008] in Jordan, there was no yield improvement of tomatoes when they were fed with greywater.
1.4.2.3 Crop Quality
Irrigating with greywater not only impacts the yield, but also the quality of the crops. There are two types of evaluation of the quality of the crops; internal quality, that is,
CHAPTER 1. INTRODUCTION 23
the consumer satisfaction; and external evaluation, which is the analytical evaluation of nutrients and minerals.
Internal evaluation of quality uses various metrics. One of the main metrics is based on individual judgment of customers, known as customer satisfaction. End-users pay more attention to the color and firmness of crops [Shewfelt, 1999] then to its nutritional quality, thus it is not a comprehensive metric. Moreover, such evaluations are mostly subjective [Wagner et al., 1998].
External evaluation of the quality of vegetables also needs to pay more attention to freshness and color quality, besides the nutrient intakes. Wagner et al. proposed a simply scoring system on 1 to 5 scale (or poor to excellent) by merely looking at the size, uniformity and defects [Wagner et al., 1998].
There are few researches studying the external quality of crops being irrigated with greywater. For instance, Day et al. [Day et al., 1981] observed no significant difference between cotton irrigated with greywater and groundwater on the quality of cotton lint. Rusan et al. [Rusan et al., 2007] found that the concentration of lead (Pb) and nickel (Ni) increased as the result of irrigation of wheat with greywater over a period of 10 years. In another research, Zavadil et al [Zuma et al., 2009] studied the effect of irrigating sugar beet with greywater. It was shown that the increase in sodium (Na) concentration can attenuate the leaf chlorosis (brown patches on leaf tips) which decrease the quality of crop.
However, there are crops where irrigation with greywater was found to have positive effects. Rodda et al [Rodda et al., 2011] found that lettuce and spinach irrigated with greywater contain more minerals such as iron (Fe) and zinc (Zn) then similar crops irrigated with potable water. The same effect was also found when barley was irrigated with greywater.
1.5
Greywater Management System
Regarding the reuse of wastewater resources in irrigation, different types of end-users must be considered. Wastewater is commonly treated in centralized facilities and it is reused in both public and private large areas, such as gardens, golf courses and crop productions. Greywater is treated and used in the same site by distributed facilities, with less consumption of energy. Nevertheless, both are reused for the same type of end-uses [Matos et al., 2014].
1.6
Conclusion
Reusing greywater is becoming a common practice in areas that face water scarcity. Greywater includes the water from kitchen, washing machines, dish washer and bath-rooms, and can be treated to be used as recycled water. Studies all around the world showed that with proper treatment, greywater from potable uses can be turned into water to irrigation. The risk of exposure of the population in reusing of wastewater or greywater should always be taken into consideration.
The recent interest in reusing greywater has turned toward small-scale distributed treatment facilities. Unlike domestic wastewater, which is treated in centralized facil-ities, studies have shown that decentralized distributed facilities provide a framework to treat greywater more efficiently [Teh et al., 2015]. The situation beyond, cannot be estimated clearly for most countries, which are not well prepared to struggle with imposed drought caused by climate changes. This phenomenon will economically influence those countries that benefit from agricultural products.
Chapter 2
Greywater: Source, Usage, and
Treatment
2.1
Motivation
Many environmental and public health specialists are concerned with either the man-agement of wastewater or the treatment of greywater in developing nations. Some of the literature addressing wastewater use for irrigation, in developing nations, looks only at the issue of untreated wastewater being discharged into surface waters that are used directly for water supply [Qadir et al., 2010]. This is a common situation in most developing cities, which are not equipped with wastewater treatment infrastructures, or where the available infrastructures have been surpassed by population growth. Although this entire system is detrimental to the environment and the human health of those living near this contaminated water, this is not the only option for practicing wastewater irrigation in the developing world, and other wastewater irrigation schemes should not be discarded.
Wastewater contains numerous pathogens that are detrimental to human health and the environment, along with heavy metals, if industrial wastewater is considered to be included [Qadir et al., 2010]. Farmers coming into contact with untreated wastewater, when using it for irrigation, may be exposed to parasitic worms, protozoa, viruses and bacteria [Qadir et al., 2010]. Microbes appear in greywater from fecal contamination, which will likely appear in smaller amounts from laundry and bathing water, and viruses may enter greywater from infected persons [World Health Organization, 2006]. Consuming crops irrigated with wastewater puts a person at higher risk of hookworm,
Ascaris sp. infections, and other enteric diseases [Qadir et al., 2010]. However, parasitic protozoa and helminthes are too large to pass through the soil particle matrix and the root structure [Eriksson et al., 2002], and so these pathogens will likely not enter the edible part of the plant. Women will come into contact with the crops more often than any other target group, because they are most likely to be the ones growing, selling and preparing vegetables irrigated with wastewater [Qadir et al., 2010]. Most external contamination would be eliminated by properly washing and cooking vegetables.
In implementing greywater irrigation projects, it is necessary to step back and look at the broader issues of the lack of hygiene, sanitation, and safe food preparation practices in many of these rural areas. Irrigating with wastewater or greywater is not good for all situations or for all plants.
Leafy vegetables, such as lettuce and cabbage, take up much more water than other vines and trees, and nutrients from the water are more likely to be found in the edible portion of the plant [World Health Organization, 2006]. Because they grow closer to the ground, these vegetables are also at higher risk of the edible parts coming in contact with the greywater [World Health Organization, 2006]. Leafy vegetables also accumulate higher levels of certain metals [Qadir et al., 2010]. Root vegetables like yams and cassava should also not be irrigated with urban wastewater, as the edible portion of the plant comes in direct contact with the wastewater. Also, metal concentrations in roots tend to be higher than in leaves [Qadir et al., 2010]. Vegetables that are eaten raw should also not be irrigated with greywater, as cooking vegetables would kill many of the microbes that might reach the edible portion of the plant [World Health Organization, 2006]. Planting in mounds and establishing a furrow irrigation system reduces the risk of plant shoots and edible portions having direct contact with greywater. Certain soils, such as clay, slow infiltration, and greywater may still accumulate at the irrigation site. Adaptations should be made for each situation to provide enough plants or a large enough area for greywater to infiltrate. In recent years, concerns about the pollution of ground and surface water have been rising [Qadir et al., 2010]. Also, there are concerns about the accumulation of detergent and salts in the soil, in places where prolonged irrigation is performed [Eriksson et al., 2002]. For instance, in the case of the existing wastewater disposal system in Ghana, there is already a risk of contaminating ground water, surface water, and soil. The greywater gardens would help reduce the risk of contaminating these other sources by decreasing ponding. Ideal conditions recommend that the greywater outlet should be at least 1.5 meters above the highest groundwater table [World Health Organization,
CHAPTER 2. GREYWATER: SOURCE, USAGE, AND TREATMENT 27
2006]. This standard is met in the village of Chirifoyilli, where the groundwater table is about 4 meters below the surface.
Some elements of greywater and wastewater might be harmful to plants. Soap contains alkali salts, and water with high levels of alkali may harm plants [Eriksson et al., 2002]. Detergents contain surfactants and may have additional builders, bleaches, and enzymes, depending on the type of detergent [Eriksson et al., 2002].
2.2
Water Quality Evaluation Parameters
Greywater effluents are categorized mainly by two main parameters: Biochemical Oxygen Demand (BOD) and Chemical Oxygen Demand (COD). The ratio between the two metrics values not only depends on the proprieties of greywater, but also affects any further application of the effluent.
2.2.1
Biochemical Oxygen Demand
Biochemical oxygen demand (BOD) is a measure of the quantity of oxygen used by microorganisms in the oxidation of biodegradable organic matter. Natural sources of organic matter include plant decay and leaf fall. However, plant growth and decay may be unnaturally accelerated when nutrients and sunlight are overly abundant due to human influence. Urban runoff carries pet wastes from streets and sidewalks; nutrients from lawn fertilizers; leaves, grass clippings, and paper from residential areas, which increase oxygen demand. Oxygen consumed in the decomposition process robs other aquatic organisms of the oxygen they need to live. Organisms that are more tolerant of lower dissolved oxygen levels may replace a diversity of natural water systems containing bacteria, which need oxygen (aerobic) to survive. Most of them feed on dead algae and other dead organisms and are part of the decomposition cycle. Algae and other producers in the water take up inorganic nutrients and use them in the process of building up their organic tissues.
2.2.2
Chemical Oxygen Demand
Measurement of COD is the standard method for indirect measurement of the amount of organic pollution that cannot be oxidized biologically in a sample of water.
The chemical oxygen demand test procedure is based on the chemical decomposition of organic contaminants, dissolved or suspended in water. The result of a chemical oxygen demand test indicates the amount of water-dissolved oxygen (expressed as parts per million or milligrams per liter of water) consumed by the contaminants, during two hours of decomposition from a solution of boiling potassium dichromate. Many governments impose strict regulations regarding the maximum chemical oxygen demand allowed in waste water before they can be returned to the environment.
2.2.3
Electrical Conductivity
Electrical conductivity (EC) is the ability of a material to transmit (conduct) an elec-trical current and is commonly expressed in units of milliSiemens per meter (mS/m). EC measurements may also be reported in units of deciSiemens per meter (dS/m), which is equal to the reading in mS/m divided by 100.
It affects crop yields, crop suitability, plant nutrient availability, and activity of soil microorganisms. Soil EC is affected by cropping, irrigation, land use, and application of fertilizer. Irrigating in amounts too low to leach salts, or with water high in salts, allows salts to accumulate in the root zone which leads to an increase in EC.
2.2.4
Standards
Table 2.1 lists the recommended World Health Organization (WHO) standards for greywater irrigation of food crops. Similarly, to EPA, the WHO also has strict standards for vegetables likely to be consumed uncooked and higher allowable levels for animal food, fruit trees and ornamental use. Many nations have adopted their own set of standards varying from these recommended guidelines. For example, Mexico sets a standard of fecal coliforms≤ 2, 000cfu/100mL (Colony Forming Unit per 100mL) for greywater irrigation, more lenient than the WHO standards. Germany requires fecal coliform≤ 10cfu/100mL, stricter than the WHO standards of ≤ 200cfu/100mL for vegetables eaten uncooked and the WHO standard of ≤ 1, 000cfu/100mL for animal food and fruit trees [World Health Organization, 2006].
The key greywater parameters are listed in Table 2.1. These indicators are the most important because they are the most prevalent in greywater, and significantly impact not only plant growth but also human health. Nitrogen, phosphorous and potassium are important since these are the key elements of fertilizers. Higher levels in wastewater
CHAPTER 2. GREYWATER: SOURCE, USAGE, AND TREATMENT 29
Table 2.1: quality standards of greywater sample from bath area drain. Table is adopted from [Fagan, 2015].
Parameter Unit EPA guidelines
(food crop irrigation) WHO standards Average lab irrigation Nitrate mg/L < 5 4.6 (NH3–) (NO3–−N) Phosphate mg/L 2 0.9 (Total) (PO43 –) Fecal col-iform cfu/100mL 0 ≤ 200 63 BOD mg/L ≤ 10 20 3.5 pH pH-unit 6 − 9 N A N A TDS mg/L N A ≤ 20 (TSS) 2.6 (VSS)
increase the growth of the plant. Nevertheless, if any of these elements is in excess or at non-optimal ratios, they may divert energy to other growth phases, such as increased foliage growth rather than fruit development.
FAO fertilizer report indicates that high levels of nitrogen increase the production of chlorophyll. Although quantity and size of leaves increases due to accumulation of chlorophyll, flower and fruit development will decrease significantly. Besides, root production will be weakened in advance. Excess phosphorus reduces the level of micronutrients a plant can take up from the soil, especially zinc and iron. This insufficiency leads to yellowing or bleaching of leaf tissue. Excess potassium would also affect micronutrient absorption [Food and Agriculture Organization, 2008].
2.3
Worldwide Greywater Reuse
Although greywater could be useful in a variety of ways, as mentioned above, there are some constraints, including widespread acceptance and laws governing greywater quality, that limit its use for irrigation purposes [Mzini, 2013]. In the United Kingdom, citizens prefer to use greywater for toilet flushing, while they are reluctant to use it for washing cars and irrigating the garden [Jefferson et al., 2004]. In contrast, Australians have shown a tendency to use greywater on a wider variety of activities, as long as this
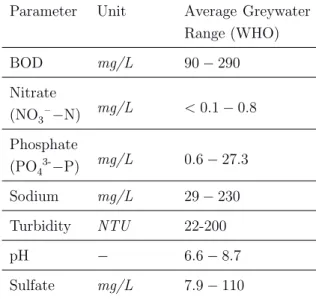
Table 2.2: Typical greywater parameters based on WHO report (*NTU : Nephelomet-ric Turbidity Units). Table is adopted from [Fagan, 2015].
Parameter Unit Average Greywater
Range (WHO) BOD mg/L 90 − 290 Nitrate mg/L < 0.1 − 0.8 (NO3–−N) Phosphate mg/L 0.6 − 27.3 (PO43-−P) Sodium mg/L 29 − 230 Turbidity NTU 22-200 pH − 6.6 − 8.7 Sulfate mg/L 7.9 − 110
avoids direct contact with skin [Marks et al., 2006]. Australians are more comfortable when greywater is used to irrigate public open spaces, than in household uses. Both in the Netherlands and in South Africa, researchers have recommended that greywater should be used in conjunction with other sources of water, because rural and urban users alike consider greywater as unacceptable and unhygienic [Dixon et al., 1999] [Khosa et al., 2003].
Some countries have legislation to govern the greywater usage. In the United States, each state has its own regulation guidelines to the usage of greywater. According to the California Greywater Standards (legislated in 1995), greywater is considered to be less contaminated than blackwater, hence greywater is permitted to be used without treatment for irrigation as long it does not come into contact with humans. In Australia, greywater is permitted to be diverted into the garden by a licensed plumber. This can be done without Council approval except when greywater is treated and stored for flushing toilets or car washing [Society, 2007].
In addition to greywater from the bathing area, wastewater from washing clothing, dishes and other food preparations is often thrown on the ground outside the home and may also accumulate and start to pool. Table 2.2 shows the parameters which the WHO reports are typical for greywater worldwide compared to a sample from a northern Ghanaian village.
CHAPTER 2. GREYWATER: SOURCE, USAGE, AND TREATMENT 31
reused will be discussed in the following sections. As shown in Table 2.2, the water from the bath drain in Chirifoyilli falls within the WHO-reported typical range for many of the parameters. The BOD of the bath drain sample is very low, which may be an indication that there is less organic matter in this water than in the average greywater worldwide. The nitrate level of this sample is much higher than the WHO range because of the high urine content in this wastewater [Fagan, 2015].
Nitrification converts the ammonia, from urine in the stagnant wastewater, to nitrite and then to nitrate. Once the sample sat for an undetermined amount of time in the laboratory, prior to testing, nitrification is probably responsible for the high measured nitrate concentration. The sulfate level in the sample may be due to dish washing water, containing salt and food preservatives contributing to the greywater pool. Greywater from the village would not have heavy metals or many of the chemicals found in the greywater of wealthier nations. The population from the village will often use locally made soap rather than mass produced soaps with additives and scents. However, due to small amounts of water used when bathing, washing dishes, and washing clothing, concentrations of contaminants will be much higher in this greywater than the wastewater of wealthier areas with running water to dilute soap and other particles [Fagan, 2015].
2.4
Greywater Treatment Technologies
Recent technologies to treat greywater can be classified as physical, chemical, and biological systems, or even a combination of these [Li et al., 2009] [Ghunmi, 2011] [Boyjoo et al., 2013]. Most of these technologies include three different individual steps: pre-treatment, main treatment, and post-treatment, as shown in Figure 2.1. Pre-treatment, such as septic tanks, filter bags, screens and filters, are essentially required to avoid blocking pipes or to reduce the number of particles, oil and grease [Li et al., 2009]. Post-treatment is required to disinfect, removing microbiological elements from the treated greywater flow [Albalawneh and Chang, 2015].
2.4.1
Biological Greywater Treatment Systems
There are various biological treatment systems used to treat greywater: Rotating Biological Contactor (RBC), Sequencing Batch Reactor (SBR), Membrane Bioreactors (MBR), Fluidized Bed Reactor (FBR), and Upflow Anaerobic Sludge Blanket (UASB).
Figure 2.1: Graywater recycling and treatment: possible steps and tracks. Figure is adopted from [Ghunmi, 2011].
Biological treatment systems normally present three stages: coarse filtration as pre-treatment; sedimentation/filtration to remove bio-solids or sludge; and a disinfection post-treatment stage, using chlorination or UV, to remove microorganisms, at the end [Boyjoo et al., 2013]. It has been reported that using aerobic biological processes increase the quality of the final effluent, because of excellent organic matter removal and turbidity decreasing rate. The mentioned processes make the treated greywater more stable for storage during longer periods.
The MBR is known as an effective system for greywater treatment because it achieves a satisfactory removal efficiency of organic substances, surfactants, and microbial contamination, regardless of the requirement for the post-filtration step. The MBR combines bio-degradation with membrane filtration for solid-liquid separation. MBR systems achieve efficient removal rates: turbidity (98 − 99.9%), TSS (around 100%), BOD (93−97%), COD (86−99%), total nitrogen (N) (52−63%), PO43 – (10-40%), total phosphorous (P) (19%), and fecal coliform (FC) (99.9%); [Ghaitidak and Yadav, 2013]. Evaluations show that the quality of the MBR effluent satisfies various standards [Pidou et al., 2007] [Boyjoo et al., 2013] [Bani-Melhem et al., 2015]. Merz [Merz et al., 2007] named this technology investable and operational due to costs for developing countries.
The RBC and FBR systems were found to be efficient for treating light greywater [Nolde, 2000]. The RBC system requires lower maintenance, if the number of stages is increased (while keeping the same volume). Friedler reported that RBC is more efficient to remove BOD than COD [Friedler and Hadari, 2006].
The SBR system is a special form of activated sludge processing, meaning that all the treatment stages are performed in the reactor tank. Using a time-controlled sequence, SBR carries out equalization, biological treatment, and secondary clarification in the same place. It is known to be one of the best technologies for the removal of conventional parameters in small scale. Effluent from SBR treatment [Lamine
CHAPTER 2. GREYWATER: SOURCE, USAGE, AND TREATMENT 33
et al., 2007] of shower greywater meets the NH4−N, BOD, and COD standards for wastewater reuse; BOD removal varied from 80 to 98% and similar ranges of COD removal were observed. There is no information concerning the efficiency of SBR systems to improve parameters like turbidity, TSS, TC, FC, and E. coli [Ghaitidak and Yadav, 2013].
All in all, anaerobic treatment performs a poor job removing both organic substances and surfactants [Leal et al., 2011]. Only 40% COD removal was achieved using an HRT with a UASB for 12 − 24 hours. It has been recommended by Ghunmi that using anaerobic pre-treatment significantly improves the quality of the effluent, [Ghunmi, 2011]; this is regardless of the disinfection stage, which is required to remove biological pathogens from the effluent. Anaerobic treatment is low cost and simple [Halalsheh et al., 2008]; however, aerobic treatment provides a better alternative in order to remove toxic components in greywater [Leal et al., 2011] [Albalawneh and Chang, 2015].
2.4.2
Physical Greywater Treatment Systems
Physical greywater treatment systems include two stages: filtration and sedimentation. Filtration is a stage which is used in both pre-treatment or as a post-treatment method. Filtration as a pre-treatment method includes screen meshes, sand bed filtration, nylon sock type filtration, metal strainers, gravel filtration, and mulch tower system [Boyjoo et al., 2013].
Using physical greywater treatment processes as the main treatment method has been proved to be insufficient, because it does not guarantee disinfection and reduction of nutrients and surfactants. The efficiency of the filtration techniques depends on the size of the pollutants and the filters’ porosity; in general, the smaller filters provides better effluent quality. [Li et al., 2009] [Ghunmi, 2011] [Boyjoo et al., 2013] [Ghaitidak and Yadav, 2013].
Chaillou [Chaillou et al., 2011] studied the efficiency of a sand bed filtration to treat bathroom greywater. On average, the method was able to remove 30% COD and two log cfu/100mL E. coli. In another research, Zuma [Zuma et al., 2009] observed that a mulch tower system, coarse sand, fine gravel, and coarse gravel was able to remove almost 26% of COD and 52% of TSS, however they showed that their methodology was not so efficient to reduce the level of FC and total coliforms, since they remained unchanged. There are some physical filtrations wich are able to produce a high
quality effluent. Membrane filtration, microfiltration (MF), ultrafiltration (UF) and nano-filtration (NF); [Shin et al., 1998] [Ramona et al., 2004] are some examples of methodologies which are proportional to the molecular weight cut-off (MWCO) of the membrane. UF membranes with pores in the range 30 − 200kDa have been reported to filter between 92 − 97% and 45 − 70% of turbidity and organic matter, respectively. Ramona et al. [Ramona et al., 2004] treated shower water via NF, and the removal of COD, TOC, and soluble ionic species was 93%, 84%, and 50%, respectively. The filtration obtained with NF membranes has better quality, as they remove soluble components, including organic matter, pathogens, ionic species, and even some kinds of viruses [Ramona et al., 2004].
Alongside to the advantages, filters imply dealing with some issues such as cleaning. Unfortunately, membrane operation and maintenance costs can restrict the application of membrane technologies for greywater treatment. In this case, inexpensive solutions such as pretreatment of raw greywater in storage and settling tanks, partially can mit-igate the clogging problems [Li et al., 2009] [Ghaitidak and Yadav, 2013] [Albalawneh and Chang, 2015].
2.4.3
Chemical Greywater Treatment Systems
Unlike the physical strategies, the chemical processes are able to reduce organic matter and turbidity in greywater to a certain degree, but not enough to meet the non-potable reuse standards [Li et al., 2009] [Boyjoo et al., 2013]. Some of the methodologies used in chemical greywater treatment systems are: coagulation and flocculation, electro-coagulation, adsorption using granular activated carbon (GAC) and natural zeolites, magnetic ion exchange resin (MIEX), powdered activated carbon (PAC) and advanced oxidation processes (AOPs) such as ozonation, and photocatalysis [Li et al., 2009] [Boyjoo et al., 2013]. These systems are efficient for use with light greywater and, in some cases, laundry greywater; however, they are not able to satisfy the standards required for potable usages [Li et al., 2009] [Boyjoo et al., 2013] [Albalawneh and Chang, 2015].
Pidou [Pidou et al., 2008] investigated the use of a coagulation/flocculation treatment system for shower greywater. They achieved sufficient levels of organics and coliforms removal. They achieved BOD removal of 85 to 89%, COD removal around 64%, TC removal > 99%, and E. coli removal > 99%; however, their method did not successfully remove Nitrogen (N), only up to 13%. It was reported that the proposed system provided better results in acidic pH, which requires adjusting the pH after treatment.
CHAPTER 2. GREYWATER: SOURCE, USAGE, AND TREATMENT 35
Unfortunately, adjustment of pH before and after treatment would increase the cost of the system, which can be noted as a drawback for its application [Ghaitidak and Yadav, 2013]. A flocculation system using aluminum sulfate [Kariuki et al., 2011] had no effect on pH, salinity, and electrical conductivity in both kitchen and laundry greywater. Nevertheless, flocculated greywater could not meet reuse standards. Lin [Lin et al., 2005] carried out a research to show the effectiveness of electro-coagulation at treating shower greywater. The coagulant was produced from the evolution of Al3+ at the aluminum anodes. Hydrogen was produced at the cathodes and the bubbles allowed the particles to float, which were then skimmed out in a separate vessel. Besides, another disinfection stage using sodium hypochlorite was essential to eliminate E. coli in the treated effluent. Evaluations showed that the water quality obtained satisfied the general standards for non-potable reuse. The system capacity was 28m3/d, had a footprint of only 8m2, and a total cost of $0.27/m3 [Lin et al., 2005].
Sanchez [M. Sanchez, 2010] successfully removed almost 65% of the dissolved organic carbon from hotel light greywater using photocatalysis with titanium dioxide. Pho-tocatalysis with titanium dioxide (TiO2) catalysts was shown to be an efficient post-treatment method for the biologic organic matter removal [Li et al., 2004] [Gulyas et al., 2007]. Photocatalysis consists of the use of a catalyst, UV light, and an oxidant, to oxidize organic pollutants in a solution. The disinfection step is not required, since photocatalysis can greatly reduce pathogens in water [Li et al., 2004]. Although they were successful in the treatment, it was important to remove the TiO2, and this makes the process more expensive [Ghunmi, 2011] [Albalawneh and Chang, 2015].
State of the art reviews revealed that the combination of chemical processes (such as coagulation), followed by a filtration and/or disinfection stage, can reduce the suspended solids, organic substances, and surfactants in low-strength greywater to an acceptable level that can meet non-potable urban reuse requirements [Lin et al., 2005] [Pidou et al., 2008]. However, for medium and high strength greywater, the system is not always able to provide the required reuse standards in all situations, unless these processes are combined with other processes [Pidou et al., 2008]. To meet restricted non-potable urban reuse standards, the effluent from the chemical processes can be treated with physical process (such as sand or membrane filtrations) [Li et al., 2009] [Ghaitidak and Yadav, 2013] [Albalawneh and Chang, 2015].
2.4.4
Natural Greywater Treatment Systems
Natural greywater treatment systems are categorized as systems which use natural media for filtration and biological degradation (i.e., soil and plants). Followed by a disinfection stage, these systems can be used to treat heavily polluted greywater [Boyjoo et al., 2013]. These systems combine physical processes, such as filtration through a filter medium (i.e., sand, gravel, rocks, cinder) with biological processes such as aerobic or anaerobic degradation, via microorganisms found within the system (i.e., biofilm, plant roots, slugs, earth- worms). Some examples are sand filter, horizontal-flow constructed wetland (HFCW), vertical-horizontal-flow constructed wetland (VFCW), anaer-obic filters, and vertical-flow filter (VFF). Also, nutrient uptake in planted systems (in the method of VFCW, HFCW) has a filtering impact concerning nutrient removal. Therefore, it is known as the most environmentally-friendly and cost-effective technol-ogy for greywater treatment and reuses [Li et al., 2009] [Ghaitidak and Yadav, 2013]. Although these systems are considered preferable due to their low cost [Boyjoo et al., 2013], they also require a large surface area (0.5−3m2) per person. Therefore, they are not suitable for use in urban areas. Evaluation shows that wetland treatment systems achieved TSS removal rates of 90 − 98%, BOD > 99%, COD from 81 to 82%, total N from 26 to 82%, B from 0 to 63%, and K up to 67%. No removal was observed for Ca, Mg, and Na [Albalawneh and Chang, 2015].
Constructed mini wetlands (i.e., small-scale constructed wetland system or SSWL) were found to be effective at removing contaminants and suitable for treating greywater sources [Wurochekke et al., 2015]. SSWL is designed on special ecological principles to maximize the function of relevant ecological processes within a limited area. Unlike the large-scale constructed wetland, the SSWL cannot afford the services of a full-time dedicated maintenance staff [Albalawneh and Chang, 2015].
2.4.5
Greywater Recycling Scheme for Agricultural Reuses
Based on the review of greywater characteristics, guidelines requirements, and grey-water treatment technologies, a greygrey-water recycling scheme for agricultural irrigation reuse purposes can be developed [Albalawneh and Chang, 2015]. Depicted in Fig-ure 2.2, the proposed scheme is based on Li et al. [Li et al., 2009] scheme of greywater recycling for non-potable urban reuses.
Li et al. [Li et al., 2009] defined unrestricted greywater reuse as its use in recreational impoundments, toilet flushing, laundry, air conditioning, landscape irrigation, fire
CHAPTER 2. GREYWATER: SOURCE, USAGE, AND TREATMENT 37
Figure 2.2: Possible greywater recycling scheme for agricultural irrigation reuse purposes. Figure is adopted from [Albalawneh and Chang, 2015].
protection, construction, surface irrigation of food crops and vegetables (consumed uncooked), and street washing. Restricted greywater reuse includes lakes and ponds for recreational uses (without body contact), landscape irrigation, where public access is infrequent and controlled, such as subsurface irrigation of nonfood crops, food crops, and vegetables that are consumed after processing [Albalawneh and Chang, 2015]. As shown in Figure 2.2, the greywater is equalized in a storage tank to cope with the variability in influent. It is essential to remove larger particles before feeding it into the treatment processes [Li et al., 2009]. To meet the requirements of restricted and unrestricted agricultural irrigation, chemical solutions are applied by membrane filtration to treat low-strength greywater. Considering microbiological standards, effluent from the chemical processes can be further filtered by sand. Additionally, disinfection stage follows, with the application of sand filtration. This step is required to improve the quality of the reclaimed greywater, for both restricted and unrestricted irrigation [Albalawneh and Chang, 2015].
The proposed strategy is not sufficient for medium and high-strength greywater, because an appropriate biological process is required to remove organic substances. These stages could be combined with the membrane filtration post-treatment, to meet the requirements of restricted and unrestricted agricultural irrigation [Albalawneh and
Chang, 2015].
2.5
Systems for Garden Greywater Reuse
Greywater reuse for disposal purposes is different from reusing it for irrigation. Grey-water for irrigation is stored in a storage tank and allowed to run through subsurface irrigation drip lines placed through garden beds.
The method proposed in [Ng, 2004] is useful for larger plants or trees that have roots deep enough to access the water coming from the pipes or trenches. Since water may drain too rapidly in sandy soils, this method can provide an additional benefit to the vegetation.
In their system, plants are only irrigated when required, instead of the water running through the trenches each time the tank fills.
The study done by [Ng, 2004] is focused on an approved greywater reuse system for irrigation purposes. The system is installed in a suburban family home and collects greywater from a family of four to distribute the treated greywater for subsurface irrigation under the lawn. The system consists of three major components including a pre-treatment stage (a split plumbing system); a treatment stage (a greywater tank, disk filter, and electric pump); and finally a network of subsurface drip irrigation lines as distribution lines. These components are described briefly as follows.
2.5.1
Split Plumbing System
The plumbing system of a residence with three bedrooms and two bathrooms is split to separate greywater from wastewater. The greywater was collected from baths, showers, washbasins, and washing machine/laundry were directed to the storage tank of the pre-treatment stage.
2.5.2
Tank, Pump and Filter
The system treats greywater to a primary level before it is pumped through the subsurface drip lines. Pre-treatment is a form of physical treatment aimed at reducing wastewater speed in order to settle out solids. The low-density polyethylene tank has
CHAPTER 2. GREYWATER: SOURCE, USAGE, AND TREATMENT 39
Figure 2.3: Schematic diagram of the greywater tank and plumbing. Figure is adopted from [Ng, 2004].
a capacity of approximately 205 liters sufficient for overflowing main sewer. During irrigation events, the greywater is drawn from the bottom of the tank by an electric pump and passes through a disk filter, flow meter, and slow release chemical root intrusion cartridge, before it reaches the irrigation network. The disk filter is used to hinder lint and hair from blocking the irrigation network. Besides, using the root intrusion chemical prevents grass roots from blocking the irrigation network under the lawn. The tank, pump and filter set-up are shown in Figure 2.3.
2.5.3
Subsurface Irrigation Network
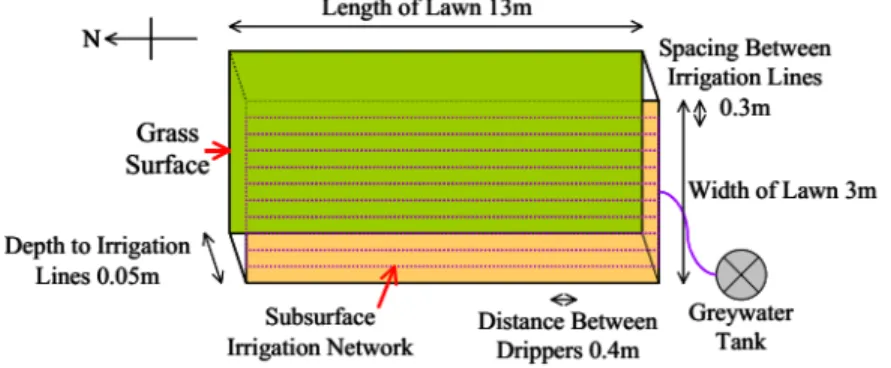
Subsurface irrigation allows greywater to be reused without any personnel contact. The proposed irrigation distribution system consists of ten parallel lines of NETAFIMTM drip irrigation piping, approximately five centimeters below the ground surface. Each row is approximately 30cm apart and each dripper is 40cm apart along the irrigation line. Figure 2.4 shows the layout of the lawn and irrigation network.
2.6
Crop Irrigation with Untreated Greywater
In a study by Finley et al. [Finley, 2008], they tried to study the effects of irrigating crops with greywater directly collected from household. In this manner, they provide three types of water, including tap water, untreated greywater, and treated greywater. Moreover, they investigated three types of plants to evaluate the direct contact of edible part with soil.
Figure 2.4: Layout and dimensions of subsurface irrigation network and irrigated lawn. Figure is adopted from [Ng, 2004].
2.6.1
Experimental materials
Greywater of the showers and washing machine of a household for a single family was sampled by sampling containers at two locations within a home greywater collection or treatment system.
The first sample (which is untreated greywater or GWu) was obtained after a primary settling stage with a hydraulic retention time (HRT) around 8h, while the second sample was related to treated greywater (GWt) that was obtained after coarse filtration and treatment by slow sand filtration with a HRT of ±24h.
Regarding the sources of greywater, it was reported that they were collected of two showers, one bathtub, and one washing machine. The house is inhabited by a family consisting of three adults and one small child. The residents use environmental friendly shampoos and detergents, and diapers were not washed in the machine that flows into the greywater system (biodegradable, phosphate free). The characteristics of the greywater and tap water used for irrigation purposes in this study are outlined in Table 2.3.
Potting soil used in the experiment was obtained by mixing 7.5 parts of pasteurized field top soil (mainly of fine sand), one part from perlite, one part from vermiculite, and half of part of peat moss (sphagnum moss).
The following plants and seeds were used in the experiment: baby finger carrots, Daucus carota sativa; grand rapids lettuce, Lactuca sativa; and gypsy red peppers, Capsicum annuum. Three types of plants were categorized as:
CHAPTER 2. GREYWATER: SOURCE, USAGE, AND TREATMENT 41
Table 2.3: Experimental greywater and tap water used for irrigation. Table is adopted from [Finley et al., 2008].
Parameter Untreated grey-water (GWu) Treated greywa-ter (GWt) City of Montreal tap water pH 6.7 − 7.6 6.9 − 7.9 7.4 − 7.5 TS (mg/L) 313 − 543 330 − 633 N D COD (mg/L) 278 − 435 161 − 348 N D NH4−N (mg/L) 1.2 − 6.2 4.1 − 5.1 N D P (mg/L) 0.24 − 1.02 0.24 − 1.21 N D K (mg/L) 2.2 − 2.5 0.6 − 4.4 N D Al (mg/L) N D N D N D Ca (mg/L) 30 − 44 28 − 44 9.5 − 9.6 Cd (mg/L) N D N D N D Co (mg/L) N D N D N D Cr (mg/L) N D N D N D Cu (mg/L) N D N D N D Mg (mg/L) 8.0 − 9.9 8.0 − 10.1 2.1 Mn (mg/L) N D N D N D Mo (mg/L) N D N D N D Na (mg/L) 20 − 27 18 − 27 18.6 − 18.8 Pb (mg/L) N D N D N D S (mg/L) 5.0 − 8.8 3.3 − 8.0 6.8 − 7.0 Fe (mg/L) 0.09 0.08 − 0.45 N D Zn (mg/L) 0.04 − 0.42 0.01 − 0.38 N D SAR 4.2 − 5.8 3.9 − 6.1 7.7 − 7.8 Fecal coliform (cfu/100mL) 4.7 × 10⁴− 8.3 × 10⁵ 2.2 × 10⁴− 1.4 × 10⁶ N D Fecal streptococci (cfu/100mL) 110 − 3.8 × 10⁵ 170 − 8 × 10² N D
![Table is adopted from [Al-Hamaiedeh and Bino, 2010]. . . . . . . . . . 62 3.5 Concentration of selected chemical parameters in crop leaves and fruits.](https://thumb-eu.123doks.com/thumbv2/123dok_br/18816848.927068/14.918.158.822.129.624/table-adopted-hamaiedeh-concentration-selected-chemical-parameters-leaves.webp)
![Figure 1.1: Components of domestic greywater [Ng, 2004]](https://thumb-eu.123doks.com/thumbv2/123dok_br/18816848.927068/20.918.326.650.168.428/figure-components-of-domestic-greywater-ng.webp)
![Table 1.2: Greywater characteristics from various characterization studies (*N T = Not tested; *cfu = Colony Forming Unit) [Finley et al., 2008]](https://thumb-eu.123doks.com/thumbv2/123dok_br/18816848.927068/22.918.225.744.293.1001/greywater-characteristics-various-characterization-studies-colony-forming-finley.webp)
![Table 2.1: quality standards of greywater sample from bath area drain. Table is adopted from [Fagan, 2015].](https://thumb-eu.123doks.com/thumbv2/123dok_br/18816848.927068/33.918.204.772.199.538/table-quality-standards-greywater-sample-table-adopted-fagan.webp)
![Figure 2.1: Graywater recycling and treatment: possible steps and tracks. Figure is adopted from [Ghunmi, 2011].](https://thumb-eu.123doks.com/thumbv2/123dok_br/18816848.927068/36.918.239.756.143.260/figure-graywater-recycling-treatment-possible-figure-adopted-ghunmi.webp)

![Figure 2.3: Schematic diagram of the greywater tank and plumbing. Figure is adopted from [Ng, 2004].](https://thumb-eu.123doks.com/thumbv2/123dok_br/18816848.927068/43.918.330.650.140.360/figure-schematic-diagram-greywater-tank-plumbing-figure-adopted.webp)
![Table 2.3: Experimental greywater and tap water used for irrigation. Table is adopted from [Finley et al., 2008].](https://thumb-eu.123doks.com/thumbv2/123dok_br/18816848.927068/45.918.202.768.252.1048/table-experimental-greywater-water-irrigation-table-adopted-finley.webp)
