Vol.54, n. 3: pp. 477-486, May-June 2011
ISSN 1516-8913 Printed in Brazil BRAZILIAN ARCHIVES OF
BIOLOGY AND TECHNOLOGY
A N I N T E R N A T I O N A L J O U R N A L
Water Type and Irrigation Time Effects on Microbial
Metabolism of a Soil Cultivated with Bermuda-grass Tifton
85
Sandra Furlan Nogueira
1*, Alessandra Monteiro de Paula
2, Bruno Fernando Faria
Pereira
2, Luiz Felippe Salemi
3, Adriel Ferreira da Fonseca
4, Célia Regina Montes
2,3and
Reynaldo Luiz Victoria
31Embrapa Monitoramento por Satélite; Av. Soldado Passarinho, 303; 13070-115; Campinas – SP – Brasil.2Núcleo
de Pesquisa em Geoquímica e Geofísica da Litosfera; Universidade de São Paulo; Av. Pádua Dias, 11; 13418-900; Piracicaba – SP – Brasil. 3Centro de Energia Nuclear na Agricultura; Av. Centenário, 303; 13400-970; Piracicaba - SP – Brasil. 4Universidade Estadual de Ponta Grossa; Campus de Uvaranas; Av. General Carlos Cavalcanti, 4748; 84030-900 Ponta Grossa – PR – Brasil
ABSTRACT
This study investigated the microbial metabolism in Bermuda-grass Tifton 85 areas after potable-water and effluent irrigation treatments. The experiment was carried out in Lins/SP with samples taken in the rainy and dry seasons (2006) after one year and three years of irrigation management, and set up onan entirely randomized block design withfour treatments: C (control, without irrigation or fertilization), PW (potable water + 520 kg of N ha-1 year-1);
TE3 and TE0 (treated effluent + 520 kg of N ha-1 year-1) for three years and one year, respectively. The parameters
determined were: microbial biomass carbon, microbial activity, and metabolic quotient. Irrigation with wastewater after three years indicated no alteration in soil quality for C and ET3; for PW, a negative impact on soil quality (microbial biomass decrease) suggested that water-potable irrigation in Lins is not an adequate option. Microbial activity alterations observed in TE0 characterize a priming effect.
Key words: reuse, irrigated agriculture, microbial respiration, Cmic, qCO2
*Author for correspondence: sandra@cnpm.embrapa.br
INTRODUCTION
Irrigated agriculture has been an important strategy for optimization of food production and undoubtedly it is considered the main consumer of freshwater in Brazil (ANA, 2004). Although approximately 12% of the freshwater worldwide is found in the Brazilian territory, the distribution of this resource is not uniform. To aggravate this situation, several problems related to water resources still occur, including the wastefulness
that, in agriculture, can be up to 50% (ANA, 2004) and the contamination mostly occurs due to the absence of basic sanitation and also owing to surface runoff that carries dissolved load of agricultural inputs such as fertilizers and pesticides.
water such as residuary waters still may represent a potential water and nutrients source for plants (Farenzena et al., 2005). In addition, it may provide the complementary treatment of the wastewater. This may result in a decreased pressure on water resources and, therefore, waters of better quality would be allocated for human consumption.
The use of effluent for crop irrigation is an old practice in many countries around the world (Hamilton et al., 2007). However in Brazil, this practice is recent (Fonseca et al., 2007a, 2007b, de Paula et al., 2009). Long-term effluent irrigation has resulted in modifications on several soil attributes (Filip et al., 1999; Bond, 1998; Friedel et al., 2000) related with high inputs of dissolved minerals and suspended solids. Thus, the initial soil conditions, vegetal cover and treated wastewater composition may influence decisively in the magnitude of these modifications by changing (Mohammad and Mazahreh, 2003) or not (Mancino and Pepper, 1992; Wang et al., 2003) the soil quality.
The soil quality can be defined as the “capacity to function as a natural or managed ecosystem to support animal and vegetal productivity, mantaining the quality of the water and air and to support the human growth” (Karlen et al., 1997), including chemical, physical and biological attributes. Among the main soil functions, the decomposition of organic matter and the nutrient cycling are mediated by microbial activity. The use of microorganisms and microbial processes to evaluate the soil quality is justified because such organisms have the capacity to readily respond to changes in soil environment, as a result of the modifications in the management practices or in the conversion of one type of ecosystem to other (Kennedy and Papendick, 1995; Stenberg, 1999). The application of treated wastewater provides positive effect on plant growth and promotes increments on soil biochemical activity, evaluated using basal respiration, and its relation with soil microbial biomass, or metabolic quotient (qCO2),
and activity of diverse hydrolytic enzymes (Speir, 2002). According to Speir (2002), these variables have been sensitive to the drastic changes in the composition and amount of applied effluent to the soil.
Studies related to treated effluent irrigation in the crops have been carried out in the University of São Paulo. As part of these studies, the present research monitored the microbial and chemical
variables of the soil in an area covered by Bermuda-grass Tifton 85 irrigated with wastewater for different periods of time.
The objective of this work was to understand the water type and the irrigation time effects on the microbial metabolism in the followings systems of Bermuda-grass Tifton 85 (Cynodon dactylon Pers. X C. niemfuensis Vanderyst): (1) not irrigated, only rain, (2) irrigated with potable water (PW) after three years; (3), watered with treated effluent (TE) during the first year of the irrigation practice and (4) after three years treated effluent irrigation.
MATERIALS AND METHODS
Study area
The experimental area was located in the municipality of Lins (21º40'43''E, 49º44'23''W and 437 m of altitude), State of São Paulo, Brazil. This experimental site is closed to the municipal system of wastewater treatment (stabilization lagoons) operated by SABESP (Company of Basic Sanitation of State of São Paulo).
According to Köppen system, the climate in Lins region is characterized as Cwa - mesotermic humid, subtropical of dry winter, with maximum and minimum temperatures averaging 27.5 and 22ºC, respectively (Ciiagro, 2007). Precipitation data referring to the experimental period was collected by a rain-gauge installed in the experimental area, and the accumulated precipitations during rainy and dry season were 1026 and 151 mm, respectively. Due to these seasonal changes in the rainfall regime throughout the year, the samplings were divided in two periods: rainy season (October 2005 to March 2006) and dry season (April to September 2006). The soil is an Ultissol (Argissolo Vermelho distrófico in the Brazilian classification) cultivated with Bermuda-grass Tifton 85. In the onset of the experiment, the soil presented the chemical characteristics shown in Table 1. The experiment was set up on an completely randomized block design separated in four different treatments: C - (control) without irrigation or fertilization; PW - irrigation with potable water during three years; TE3 - irrigated with treated effluent during three years and TE0 - irrigated with treated effluent during one year. Each of these treatments had four repetitions.
hay. After harvesting, all the plots, except the treatment C, received following mineral fertilization: 520 kg N ha-1 year-1, 180 kg P ha-1
year-1 and 345 kg K ha-1 year-1 (Corsi and Martha
Júnior, 1998). The fertilizers utilized to supply N, P and K were ammonium nitrate, simple
superphosphate and potassium chloride, respectively. The irrigation system used was the conventional aspersion. The irrigation was performed based on the critical soil moisture in the depth of 0 to 0.6 m monitored using tensiometers.
Table 1 - Soil characteristics of the experimental area before the treatments setup (January 2003)
Layer pH H2O TCa TNb dgc P K Mg Ca H+Al CECd Ve
g kg-1 g kg-1 kg dm-3 mg kg-1 mmol
c kg-1 %
0-10 5.65 5.97 0.46 1.59 6.23 1.45 5.61 10.26 15.17 32.49 53.31
10-20 5.36 5.84 0.46 1.53 1.35 0.79 5.97 10.54 16.97 32.27 50.48
aTotal carbon; bTotal nitrogen; cGlobal density; dCation exchange capacity at pH 7.0 - CEC = H + Al + Ca + Mg + K; eBase saturation - V = (Ca + Mg + K) x 100/CEC.
Characteristics of water and treated effluent used in the irrigation
The city of Lins utilizes groundwater (Guarani and Serra Geral artesian wells and aquifers), which is conventionally treated for human supply. Regarding to the generated sewage, it is treated by
stabilization lagoons (anaerobic lagoons followed by facultative lagoons). Table 2 shows the characteristics of treated effluent and potable water used in the experiment. These characteristics were compared to international water quality standards.
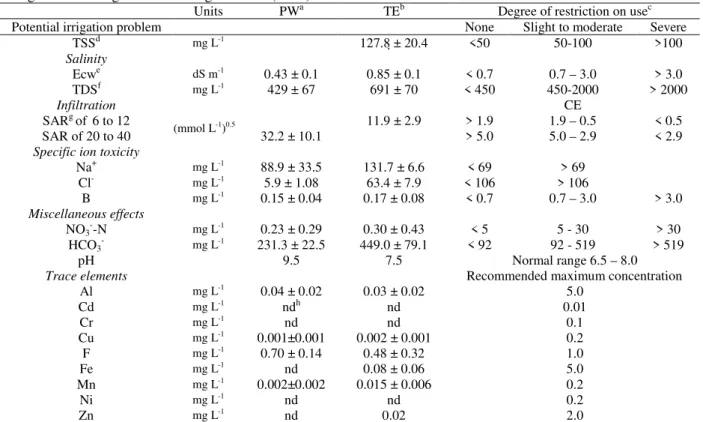
Table 2 - Characteristics of the potable water and treated effluent used in the irrigation and the established values
for agricultural irrigation according to WHO (2006)
Units PWa TEb Degree of restriction on usec
Potential irrigation problem None Slight to moderate Severe
TSSd mg L-1 127.8
± 20.4 <50 50-100 >100
Salinity
Ecwe dS m-1 0.43 ± 0.1 0.85 ± 0.1 < 0.7 0.7 – 3.0 > 3.0
TDSf mg L-1 429 ± 67 691 ± 70 < 450 450-2000 > 2000
Infiltration CE
SARg of 6 to 12 11.9 ± 2.9 > 1.9 1.9 – 0.5 < 0.5
SAR of 20 to 40 (mmol L-1)0.5 32.2 ± 10.1 > 5.0 5.0 – 2.9 < 2.9
Specific ion toxicity
Na+ mg L-1 88.9 ± 33.5 131.7 ± 6.6 < 69 > 69
Cl- mg L-1 5.9 ± 1.08 63.4 ± 7.9 < 106 > 106
B mg L-1 0.15 ± 0.04 0.17 ± 0.08 < 0.7 0.7 – 3.0 > 3.0
Miscellaneous effects
NO3--N mg L-1 0.23 ± 0.29 0.30 ± 0.43 < 5 5 - 30 > 30
HCO3- mg L-1 231.3 ± 22.5 449.0 ± 79.1 < 92 92 - 519 > 519
pH 9.5 7.5 Normal range 6.5 – 8.0
Trace elements Recommended maximum concentration
Al mg L-1 0.04 ± 0.02 0.03 ± 0.02 5.0
Cd mg L-1 ndh nd 0.01
Cr mg L-1 nd nd 0.1
Cu mg L-1 0.001±0.001 0.002 ± 0.001 0.2
F mg L-1 0.70 ± 0.14 0.48 ± 0.32 1.0
Fe mg L-1 nd 0.08 ± 0.06 5.0
Mn mg L-1 0.002±0.002 0.015 ± 0.006 0.2
Ni mg L-1 nd nd 0.2
Zn mg L-1 nd 0.02 2.0
aPotable water; bTreated effluent; cAyers and Westcot (1985); dTotal suspended solids; eElectrical conductivity; fTotal dissolved solids; gSodium adsorption ratio; hNot detected; Source: FAO (1985).
According to the Mineral Water Code (Brazil, 1945), the potable water of Lins is classified as alkaline-bicarbonate, and presents low to moderate degree of restriction on agricultural use due to the
water that after human use presents more concentration of Ca and Mg and as a consequence lowers values of sodium absorption ratio (SAR) that represents a less restrictive alternative to be used in agriculture.
Monitoring the inputs of C and N in the systems irrigated with treated effluent and potable water
Water and treated effluent characterization was carried out monthly. The water and effluent volume use for irrigation were registered daily for calculations of the C and N applied in each treatment. Water and effluent samples were preserved and prepared according to the international standard (Eaton et al., 1995) with some adaptations described below.
In the field, 0.5 L of effluent and water were collected. In the first filtering GF/F filters (0.45 µm of pore diameter and previously weighed) were used aiming to hold the particulate material for total particulate carbon determination (TPC), total particulate nitrogen (TPN) and quantification of total suspended solids (TSS). After, from the filtered solution an aliquot was withdrawn to a scintillation flask for the determination of the dissolved organic carbon concentration (DOC), preserved with 0.2 mL of HgCl2 50 µM. The
remaining filtered solution was refiltered in a cellulose ester filter (0.22 µm), and the resultant sample was separated in aliquots for dissolved inorganic carbon determination (DIC) preserved with Tymol, and for NH4+-N determination
preserved with 20 µL of PMA (Phenylmercuric Acetate – 0.5 mg L-1).
The glass fiber filters GF/F were oven dried at 55-60°C for 48 h and reweighed. Part of the particulate material was kept in tin capsules for analysis of TPC and TPN in an elementary analyzer (Carlo Erba, model EA 1110). Concentrations of DOC and DIC were determined by a carbon analyzer (Shimadzu TOC-5000A). From the separated aliquots for DIC determination, a fraction was collected for NO2--N
and NO3--N analysis by Dionex Liquid
Chromatograph System, in equipment Dionex DX-500. The analysis procedure was as follows: Na2CO3 1.8 mmol L-1 + NaHCO3 1.7 mmol L-1
solution, as mobile phase; flux of 1.5 to 2.0 mL min-1; 1300 to 2300 psi of pump pressure; AG
14-4 pre-column and AS 114-4-14-4 IonPac analitic column with ED40 electrochemical detector.
The concentrations of NH4+-N were determined by
a flow injection analyzer (FIA) (Ruzicka and Hansen, 1981) connected to a conductivimeter.
Soil sampling and analysis
Eight soil samples (0-10 cm depth) were collected with a Dutch auger in order to form a composite sample for each plot. After that, the samples were sieved (2 mm) to remove the large roots. The sieved samples were homogenized and separated in three fractions: (a) 15 g for moisture determination, (b) 200 g in plastic bags with respirator and kept in refrigerator for microbial biomass carbon and nitrogen determination, and (c) 20 g for pH measurement.
Moisture, Water-Filled Pore Space (WFPS) and pH measurements
Soil fractions of 15 mg were pre-weighed and oven dried at 55ºC during 96 h. After it, the soil water content (u) was determined.
The water-filled pore space (WFPS%) was calculated from the soil bulk densisty (db - g.cm-3),
the soil particle density (dp - g.cm-3) and the soil
water content (u - %) (Equations 1, 2 and 3).
θ = (u x db) x 100 (1)
α = (1-db/dp) x 100 (2)
WFPS = (θ/α) x 100 (3)
Where: θ = soil water content (%) e α = porous space of the soil (%)
For dp calculation it was used the gas pycnometer
methodology according to Flint and Flint (2002). Data of db were obtained by means of the water
retention curve method (Embrapa, 1979). The pH was measured in water (Embrapa, 1997).
Determination of microbial biomass carbon,
C-CO2 emissions, soil temperature and metabolic
quotient (qCO2)
The microbial biomass carbon (Cmic) was
determined by the method of fumigation-extraction (Vance et al., 1987). The organic carbon from the extracts was determined by a Total Organic Carbon Analyzer (TOC Shimadzu -5000A). The microbial biomass carbon was obtained by the difference between the values of carbon in the fumigated and non fumigated samples.
In the same dates of soil sampling, gas fluxes were sampled using static chambers (20 cm of height and 27 cm of diameter) (Jacinthe and Dick, 1997) to calculate CO2 soil fluxes.
Four samples of CO2 were collected per chamber
immediately after closing the chamber (t=0) and the three remaining samples were collected after 5, 10 and 20 minutes. Samples were stored in evacuated sealed flasks. Analogical thermometers were used to measure the temperatures inside the chambers before and after each sampling.
CO2 samples concentrations were determined by
gas chromatography (Shimadzu, GC-14A) (Bowden et al., 1990; Steudler et al, 1991). Gas concentrations were calculated by comparing the peak areas for the samples to three prepared standards certified for calibration (White Martins Company). Fluxes were calculated using the linear regression of concentration against time. The calculation of the fluxes of C-CO2 for TE0 was
obtained according to Anderson’s method (1982). The metabolic quotient (qCO2) for the treatments
SI, A and TE3 was determined by the relation between the amount of C emitted as CO2 (soil
respiration - Rs) determined in the field and
transformed into heterotrophic respiration (Rh)
according to the equation suggested by Bond-Lamberty et al. (2004), and the amount of Cmic
(Anderson and Domsch, 1977). The metabolic quotient (qCO2) for treatment TE0 was determined
by the relation between the amount of C emitted as CO2 during soil incubation and Cmic as follows:
qCO2 = C-CO2 / Cmic
Values are expressed in mg C-CO2-1 g-1 Cmic h-1. In
order to express the calculations of qCO2 in terms
of soil mass, the soil mass contained in a volume of 1 m2 by 0.1 m depth was adopted (Vinther et al.,
2004) and this value was multiplied by the soil density in the area, 1.6 g cm-3.
Statistical Analysis
The results here analyzed using univariated statistics in accordance with completely randomized block design. In the cases of significant F (p < 0.05), Tukey test was used. All
data were analyzed using SAS statistical software Version 9.1.2 (SAS, 2004).
RESULTS AND DISCUSSION
Inputs of carbon and nitrogen by the treated
effluent, potable water and nitrogen
fertilization
During the water year evaluated, the amount of irrigation accumulated ranged from 221 to 318 mm and 351 to 520 mm in the dry and rainy season, respectively, (Table 3), according to the treatment. Considering the characteristics of treated wastewater in stabilization lagoons, effluents presented a particulate fraction typically composed by algae (Snow et al., 1999; Von Sperling, 2002) which meant an input of approximately 0.9 Mg ha-1 of organic matter in
treatment TE0 and 1.0 Mg ha-1 in TE3. This material was composed by 35% of C and 6% of N. In the rainy season, the inputs of DIC, DOC, NH4+-N and NO2-+NO3-N, contained in the
dissolved fraction of the treated effluent averaged 238, 46, 67 and 10 kg ha-1, respectively (Table 3).
In the dry season the inputs of DIC, DOC, NH4+-N
and NO2-+NO3-N were 448, 91, 117 and
20 kg ha-1, respectively (Table 3). From the input
of these elements by water, DIC was the only notable variable (approximately 160 and 101 kg ha-1 for the rainy and dry seasons, respectively)
(Table 3).
N inputs in the rainy season through the treated effluent and mineral fertilizer application were approximately 209, 414 and 305 kg ha-1 for
treatments TE0, TE3 and PW, respectively. For the dry season, the same inputs were about 418, 425 and 248 kg-N ha-1 for treatments TE0, TE3
and PW, respectively (Table 3).
Table 3 - Chemical variables inputs by potable water and treated effluent on the experimental area
Seasons Irrigation TSSa TPCb TPNc DICd DOCe NO
3- -N NH4+-N NHFert. 4NO3 -N
Corg
Effluent TNf Corg: TN
Rainy mm kg ha-1
TE0g 222 284 100 19 196 40 8 51 130 140 209 0.7
TE3h 318 407 143 27 281 57 12 74 300 200 414 0.5
PWi 221 101 3 5 0 300 3 305 0.0
Dry
ET0 498 637 224 43 440 89 19 115 241 313 418 0.7
ET3 520 665 234 45 459 93 20 120 241 327 425 0.8
PW 351 160 4 7 0 241 4 248 0.0
WFPS, temperature, pH, microbial biomass
carbon, microbial respiration and qCO2
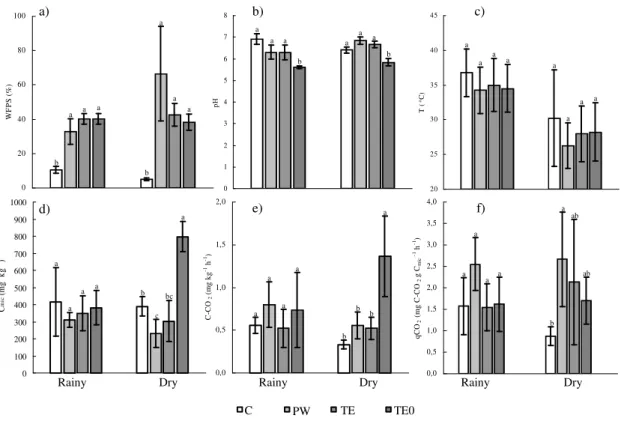
As expected, the degree of water saturation in the soil (WFPS) of C treatment was lower than the other treatments (Figure 1a), exhibiting less saturation (5%) in the dry season. The irrigated treatments showed values of WFPS of 38% (dry season) and 49% (rainy season). There were no significant differences among the treatments during these seasons.
In TE0, the soil pH in both seasons presented lower values (5.9), if compared to the treatments PW (7.0) and TE3 (6.5) (Figure 1b). During the field campaign, soil temperatures (0-10 cm depth) did not vary among the treatments, averaging 28 and 32 °C for rainy and dry seasons, respectively (Figure 1c).
In the rainy season, Cmic did not differ among the
treatments averaging 364 mg kg-1 of soil (Figure
1d). TE0 was the only treatment that Cmic differed
between the dry and rainy season (381 and 797 mg kg-1 of soil, respectively). In addition, in the rainy
season TE0 differed from the other treatments. The treatments microbial respiration, during the rainy season, did not differ from each other,
averaging 0.65 mg of C-CO2 kg-1 of soil per
hectare (Figure 1e). In the dry season, heterotrophic respiration at treatment TE0 was two fold higher than its C-CO2 production in the rainy
season (Figure 1e). The treatments C, PW, and TE3, in the dry season, presented similar microbial respiration compared to respiration found in the rainy season, and did not differed from each other except for TE0. The average for these three treatments was 0.47 mg of C-CO2 kg-1 of soil per
hectare. Associating the information about carbon microbial biomass with microbial respiration, it was possible to obtain an indicator of microbial metabolism - metabolic quotient (qCO2) - of the
treatments (Figure 1f). No differences were observed among the treatments in the rainy season, and the metabolic quotient averaged 1.82 mg C-CO2 g Cmic-1 h-1. In the dry season, qCO2 found in
the treatment PW was higher (2.67 mg C-CO2 g
Cmic-1 h-1) than treatment C (0.87 mg C-CO2 g Cmic -1 h-1), and similar to the value observed in the rainy
season. Comparing dry and rainy season, treatment C was the only one that presented variation in qCO2, ranging from 1.57 to 0.87 mg
C-CO2 g Cmic-1 h-1.
Figure 1 - WFPS (a). pH (b). temperature (c). Cmic (d). C-CO2 (e) e qCO2 (f) presented by the treatments on rainy and dry seasons C - (control) without irrigation or fertilization; PW - irrigation with potable water during three years; TE3 irrigated with treated effluent during three years and TE0 - irrigated with treated effluent during one year. Rainy and Dry (Rainy and Dry seasons, respectively) Average with the same letter, did not differ for each season (Tukey. p<0.05).
0 100 200 300 400 500 600 700 800 900 1000 Chuvas Seca C m ic (m g kg -1)
SI A ET3 ET0
0,0 0,5 1,0 1,5 2,0 2,5 3,0 3,5 4,0 Chuvas Seca qC O2 ( m g C -C O2 g Cm ic
-1 h -1) 0,0 0,5 1,0 1,5 2,0 Chuvas Seca C -C O2 ( m g kg -1h -1) 20 25 30 35 40 45 T ( oC ) 0 20 40 60 80 100 W F P S ( % )
a a a a
a a b b 0 1 2 3 4 5 6 7 8 pH a a a a a a b b a a a a b b a b b c bc a b ab ab a a
a a a a
a a a a a a a a a a a
C PW TE TE0
Rainy Dry Rainy Dry Rainy Dry
a) b) c)
The main factors that control the microbial activities are C and N availability and also physical factors such as temperature, pH and soil moisture. In this study, C and N availability for microbial metabolism was dependent on the quality of soil organic matter (MOS), the inputs of these elements via treated effluent, and N inputs by mineral fertilization.
High C:N ratios result in N immobilization on soil microbial biomass and therefore cause scarcity of this nutrient to the plants. On the other hand, low C:N ratios imply an increase of N availability in the system (Buchanam and Gliessman, 1991). In this context, the Corg:NT ratio of the input
(effluent, potable water and fertilizer) for the treatments varied: (a) inexistent for the treatment C, where there was no input of Carbon by irrigation; (b) 0.7 for ET0 and (c) 0,5 - 0,8 for the ET3 (Table 3). Low C:N ratio of these inputs in addition with C:N ratio of the Bermuda-grass Tifton 85 (21:1), and the soil C:N ratio (13:1) (Nogueira, 2008), if considered with soil water availability, indicated improvement of the mineralization activities, and therefore, improvement of microbial metabolism.
Concerning the soil water saturation degree and temperature, the irrigated treatments variation (Figures 1a and 1c) was considered favorable for microbial activity and did not represent limiting conditions for mineralization of soil organic matter (Moreira and Siqueira, 2006).
During the implantation of the experimental area, soil chemical characteristics were: acidity, low CEC and low organic matter content (Table 1), which combined to its texture, gave a low buffer capacity or resistance to changes of soil pH (Sabatti et al., 2003). The neutralization of soil acidity occurs in the presence of carbonate salts, which are able to react with the hydrogen present in the soil water, leading to an increase of pH (Raij, 1991).
The bicarbonate concentration in the potable water and in the treated effluent in Lins is considered high (Brazil, 1945), and it may be possibly related to the high pH values observed in treatments PW and TE3. Since the irrigation practice influenced more than nitrogen fertilization (practice that tends to decrease soil pH), the bicarbonate concentration in the irrigation sources and the time-course irrigation contributed effectively for the soil pH variations. The lower pH values observed in treatment TE0 suggested that the continuous irrigation was not enough to modify the original
values (Figure 1b).
In the rainy season, the treatments did not affect the soil microbial activity, as evidenced in the evaluation of the Cmic, C-CO2 and the qCO2, which
did not differ from the other treatments (Figures 1d, 1e e 1f). In addition, the treatments presented Cmic contents close to those observed by Moreira
and Siqueira (2006) in the areas of pastures, about 385 mg kg-1 of soil. The absence of Cmic variation
among the treatments during the rainy season was probably due to the availability of nutrients, for C and PW treatments, that guaranteed the microbial community maintenance, although these treatments had received low nutrient inputs (Jacinthe et al., 2002).
During the dry season, the management was favorable to Cmic increase in TE0. In contrast to the
rainy season, TE0 was remarkably different from the other treatments because of an increase of more than 100% during rainy season (Figure 1d). This increase in the Cmic can occur due to the
“priming” effect that consists of an increase of the natural mineralization favored by a ‘trigger’, as organic matter of easy decomposition (labile organic matter) or another factor that can be limiting the activity of the biomass (Kuzyakov et al., 2000).
The priming effect in TE0 was probably result of an initial stimulation caused by the management practice applied to the grass (cut + fertilization) combined to irrigation with effluent in an area not previously managed where there was dynamic equilibrium of the soil microbiota. The irrigated treatments, after three years of management and C did not show alterations of Cmic between the
seasons since they were already adapted to the environmental conditions and to practice of management (Figure 1d).
Although PW did not present significant difference of Cmic in the dry season compared to
TE3 (Figure 1d), it was possible to observe a tendency of biomass decrease in this treatment. Such tendency could be related to two attributes of the use of potable water in the grass irrigation: (1) it did not contribute to the dissolved organic carbon, easily assimilable, and therefore, favorable for soil microbial activity, and (2) presence of elevated RAS (Table 2) (WHO, 2006), indicating a risk of soil sodicity and then injuries for plant nutrition and soil microbial community (osmotic stress) (Santos and Muraoka, 1997).
which increased this parameter, as presented in several studies (Ramirez-Fuentes et al., 2002; Gelsomino et al., 2006), as well as the absence of such effect (Wang et al., 2003; Schipper et al, 1996). Schipper et al. (1996) studied the effects of irrigation layers of 25,500 and 38,500 m3 ha-1 y-1
of effluent and water in pine forests during three years and observed that the microbial biomass and activity did not show significant changes for either type of irrigation water or the amount of irrigation. As observed for Cmic, the microbial activity
increased in TE0 (Figure 1e) during dry season indicating an increase of soil microbial biomass favored by the continuous availability of water, nitrogen (from mineral effluent), and labile carbon by irrigation with effluent or by the decomposition of the litter generated by Bermuda-grass Tifton 85 (Nogueira, 2008).
After a long period of irrigation of different annual crops, about 70 years, no alterations were observed in the microbial activity in areas irrigated with effluent or potable water (Wang et al., 2003). This effect was related with the capacity of soil microbial adaptation to enviromental changes, and this capacity could be related to the results observed in treatments TE3 and PW which did not differ from each other during the study (Figure 1e).
According to the eco-physiological indicator (qCO2) results, a possible scenario of stress could
be observed in PW during dry season, where a high qCO2 value (2.67 mg C- CO2 g-1 Cmic h-1) was
observed (Figure 1f). The highest qCO2 value
observed in PW (related to the other treatments even with a significant variation observed in C) was explained by low microbial biomass associated with a high respiration activity, resulting in low conversion efficiency from organic C to Cmic. As mentioned before about Cmic,
this process could be consequence of: (1) long time of irrigation (compared to TE0), and, (2) use of water with high value of RAS (compared to TE3), resulting in a possible osmotic stress of the soil microbial community (Rietz and Haynes, 2003, Nogueira et al., 2005).
Friedel et al. (2000) studied the microbial biomass and microbial respiration in two different soils irrigated (25, 65 and 80 years) with effluent in Valle del Mezquital, Mexico. These authors observed that clay soils presented the high fluxes of CO2 uptake (Cresp) while silty soils presented
negative correlation of Cresp and Na concentration.
On both soils, the irrigation did not present effects in the fluxes of CO2 and Cmic (qCO2).
CONCLUSIONS
According to the indicators Cmic, microbial
respiration, and qCO2, the irrigation with treated
effluent did not show alteration of quality in the areas of three years under this management practice. The results observed in PW indicated a negative effect of the irrigation with potable water over the soil quality. This suggested that the potable water in the municipality of Lins did not represent a suitable option for agricultural water use. In the areas recently irrigated with treated effluent the microbial community immediately responded to the alteration of soil use that resulted in the priming effect, which meant an increase of Cmic and consequently microbial respiration.
REFERENCES
Agência Nacional De Águas (ANA), (2004),
Agricultura irrigada e o uso racional da água.
Brasília: Agência Nacional de Águas, 32p
Anderson, J.P.E. (1982), Soil respiration. In-Methods of Soil Analysis. Part 2, Ed. Page, A.L.; Miller, R.H.; Keeney, D.R. (Eds.). 2 ª ed ASA/SSSA, Madison, p. 837-871
Anderson, J.P.E.; Domsch, K.H. (1977), A physiological method for the quantitative measurement of microbial biomass in soil. Soil Biol. Biochem., 10, 215-221
Bond, W.J. (1998), Effluent irrigation - an environmental challenge for soil science. Aust. J. Soil Res., 36, 543-555
Bond-Lamberty, B., Wang, C., Gower, S.T. (2004), A global relationship between the heterotrophic and autotrophic components of soil respiration? Glob. Change Biol., 10, 1756–1766
Bowden, R.D.; Steudler, P.A.; Melillo, J.M. (1990), Annual nitrous oxide fluxes from temperate forest soil in the northeastern United State. J Geophys Res.,
95, 13997-14005
Brazil (1945), Decreto-lei nº 7.841, de 8 de agosto de 1945, Código de Águas Minerais. Diário Oficial da União, Rio de Janeiro, RJ, 20 de agosto de1945 Buchanam, M.; Gliessman, S. (1991), How compost
fertilization affects soil nitrogen and crop yield.
Biocycle,12, 2-7
Ciiagro/Instituto agronômico, (2007), http://www.ciiagro.sp.gov.br/ciiagroonline/-html, 10 Abril 2007
Corsi, M.; Martha Júnior, G.B. (1998), Manejo de pastagens para produção de carne e leite. In-Manejo de pastagens de tifton, coastcross e estrela. Eds. Peixoto, M.A.; Moura, J.C.; Faria V.P. (Eds.), Piracicaba: FEALQ, 55-83 Da Fonseca, A.F., Herpin, U., Dias, C.T.S., Melfi, A.J
Da Fonseca, A.F., Herpin, U., Dias, C.T.S., Melfi, A.J. (2007a) Nitrogen forms, pH and total carbon in a soil incubated with treated sewage effluent. Braz. Arch. Biol. Technol., 50, 743-752
Da Fonseca, A.F., Melfi, A.J., Monteiro, F.A.; Montes, C.R.; Almeida, V.V.; Herpin, U. (2007b) Treated sewage effluent as a source of water and nitrogen for Tifton 85 bermudagrass. Agr. Wat. Manage., 87, 328-336
De Paula, A.M., da Fonseca, A.F., Cardoso, E.J.B.N., Melfi, A.J. (2009), Microbial Metabolic Potential Affected by Surplus Wastewater Irrigation in Tropical Soil Cultivated with Tifton 85 Bermuda Grass (Cynodon dactylon Pers. X C. niemfuensis
Vanderyst), Wat. Air Soil Poll., doi: 10.1007/s11270-009-0063-3. Online first
Eaton, A.D.; Clesceri, L. S.; Greenberg, A.E. (1995),
Standard methods for the examination of water and wastewater. Baltimore: United Book Press
Embrapa, (1979), Serviço Nacional de Levantamento e Conservação de Solos. Manual de Métodos de Análise de Solo. Rio de Janeiro
Embrapa, (1997), Centro Nacional de Pesquisa de Solos, Manual de métodos de análise do solo, Rio de Janeiro, 212p
Farenzena, M., Ferreira, L.S., Trierweiler, J. O., Aquim, P.M. (2005), Tanneries: from waste to sustainability.
Braz. Arch. Biol. Technol., 48, 281-289
Filip, Z., Kanazawa, S., Berthelin, J. (1999), Characterization of effects of a long-term wastewater irrigation on soil quality by microbiological and biochemical parameters. J. Plant. Nutr. Soil Sci., 162, 409-413
Flint, A.L.; Flint, L.E. Particle Density. In-Methods of soil analysis: Part 4 - Physical methods, eds. Dane, J.H. & Topp, G.C., Madison, Soil Sci. Soc. Am. J., Pp 235-240
Friedel, J.K.; Langer, T.; Siebe, C.; Stahr, K. (2000) Effects of long-term waste water irrigation on soil organic matter, soil microbial biomass and its activities in central Mexico. Biol. Fert. Soils, 31,
414-421
Gelsomino, A.; Badalucco, L.; Ambrosoli, R.; Crecchio, C.; Puglisi, E.; Meli, S.M. (2006) Changes in chemical and biological soil properties as induced by anthropogenic disturbance: A case study of an agricultural soil under recurrent flooding by wastewaters. Soil Biol. Biochem., 38, 2069–2080
Hamilton, A.J., Stagnitti, F., Xiong, X., Kreidl, S.L., Benke, K.K., Maher, P. (2007), Wastewater Irrigation: The State of Play, Vadose Zone J, 6, 823-840
Jacinthe, P.A.; Dick, W.A. (1997) Soil management and nitrous oxide emissions from cultivated fields in Southern Ohio. Soil Till. Res., 41, 221-235
Jacinthe; P.-A.; Lal, R.; Kimble, J. M. (2002) Carbon budget and seasonal carbon dioxide emission from a central Ohio Luvisol as influenced by wheat residue amendment, Soil Till. Res., 67, 147–157
Karlen, D.L.; Mausbach, M.J.; Doran, J.W.; Cline, R.G.; Harris, R.F.; Schuman, G.E. (1997), Soil quality: a concept, definition, and framework for evaluation. Soil Sci. Soc. Am. J., 61, 4-10
Kennedy, A.C.; Papendick, R.I. (1995), Microbial Characteristics of soil quality. J. Soil Wat. Conserv.,
50, 243-248
Kuzyakov, Y.; Friedel, J.K.; Stahr, K. (2000), Review of mechanisms and quatification of priming effects.
Soil Biol. Biochem., 32, 1485-1498
Mancino, C.F.; Pepper, I.L. (1992), Irrigation of turfgrass with secondary sewage effluent: soil quality.
Agron. J., 84, 650-654
Mohammad, M.J.; Mazahreh, N. (2003), Changes in soil fertility parameters in response to irrigation of forage crops with secondary treated wastewater.
Commun. Soil Sci. Plan., 34, 1281-1294
Moreira, F. M. S.; Siqueira, J. O. (2006), Microbiologia e bioquímica do solo, Editora UFLA, 2º Ed., Lavras, Brasil
Nogueira, S. F. (2008), Efeitos da irrigação com esgoto tratado e fertilização nitrogenada na ciclagem de carbono e nitrogênio e no metabolismo microbiano de um solo cultivado com capim-Bermuda Tifton 85.
Tese (Doutorado). Centro de Energia Nuclear na Agricultura, Piracicaba, Brasil
Nogueira, S. F.; Carmo, J. B.; Montes, C. R.; Victoria, R. L., Ravagnani, E.C., Barufaldi, R.O. (2005), Indicadores eco-fisiológicos da qualidade de um solo irrigado com esgoto tratado. Rev. Bras. Eng. Agric. Amb., 9, 138-142
Ramirez-Fuentes, E.; Lucho-Constantino, C.; Escamilla-Silva, E.; Dendooven, L. (2002), Characteristics, and carbon and nitrogen dynamics in soil irrigated with wastewater for different lengths os time. Bioresour. Technol., 85, 179-187
Rietz, D. N.; Haynes, R. J. (2003), Effects of irrigation-induced salinity and sodicity on soil microbial activity. Soil Biol. Biochem., 35, 845–854
Ruzicka, J.; Hansen, E.H. (1981) Flow injection analysis. Wiley Interscience, New York, 395p Sabatti, J.A.; Souza Junior, I.G; Costa, A.C.S.;
Tormena, C.A. (2003), Estimativa da acidez potencial pelo método do ph smp em solos da formação caiuá - noroeste do Estado do Paraná. Rev. Bras. Ciênc. Solo,
27, 257-264
SAS System (2004), SAS Institute Inc. SAS OnlineDoc® 9.1.2. Cary, NC: SAS Institute
Santos, R.V.; Muraoka, T. (1997), Interação salinidade e fertilidade do solo In: GheyI, H.R.; Queiroz, J.E.; Medeiros, J.F. (Ed.) Manejo e controle da salinidade na agricultura irrigada. Campina Grande: UFPB, 1997. pp.289-317
Schipper, L.A.; Williamson, J.C.; Kettles, H.A; Speir, T.W. (1996), Impact of land-applied tertiary-treated effluent on soil biochemical properties. J Environ Qual, 25, 1073-1077
Snow, V.O.; Smith, C.J.; Polglase, P.J.; Probert, M.E. (1999), Nitrogen dynamics in a eucalypt plantation irrigated with sewage effluent or bore water. Aust. J. Soil Res., 37, 527-544
Speir, T.W. (2002), Soil biochemical properties as indices of performance and sustainability of effluent irrigation systems in New Zealand - a review. J. Roy. Soc. New Zeal., 32, 535-553
Stenberg, B. (1999), Monitoring soil quality of arable land: microbial indicators. Acta Agric..Scand., sect B., Soil Plant Sci. 49, 1-24
Steudler, P.A.; Melillo, J.M.; Bowden, R.D.; Castro, M.S.; Lugo, A.E. (1991), The effects of natural and human disturbances on soil nitrogen dynamics and trace gas fluxes in a Puerto Rican wet forest.
Biotropical, 23, 356-363
Vance, E.D.; Brookes, P.C.; Jenkinson, D.S. (1987), An extraction method for measuring soil microbial biomass C. Soil Biol. Biochem., 19, 703-707
Vinther, F.P.; Hansen, E.M.; Olesen, J.E. (2004), Effects of plant residues on crop performance, N mineralization and microbial activity including field CO2 and N2O fluxes in unfertilized crop rotations. Nutr. Cycl. Agroecosys, 70, 189-199
Von Sperling, M. (2002), Lagoas de estabilização. Belo Horizonte: Departamento de Engenharia Sanitária e Ambiental - Universidade Federal de Minas Gerais, 134p
Wang, Z.; Chang, A.C.; Wu, L.; Crowley, D. (2003), Assessing the soil quality of long-term reclaimed wastewater-irrigated cropland. Geoderma, 114,
261-278
WHO, (2006), World Health Organization, Guidelines for the safe use of wastewater, excreta and greywater: Wastewater use in agriculture, Available from: http://whqlibdoc.who.int/publications/2006/ 9241546824_eng.pdf