Decision-making involves the selection of goals or actions, but it also requires determination of the timing of action. When there is a stimulus or cue to react to, the problem of when to act is constrained by sensory and motor requirements and may involve balancing of speed versus accuracy and other facets of sensorimotor coordination, which have been intensively studied1. In reaction time tasks, decisions are associated with trial-to-trial variations in response time. These fluctuations have been theorized to arise from the integration of noisy sensory signals by a neural integrator, whose crossing of activation threshold triggers an action2–4. In support of this theory, neurons in the primate frontal cortex, parietal cortex and superior colliculus show gradual increases in neural activity after presentation of visual stimuli, reaching a constant activity threshold at which a saccadic eye movement is generated; reaction times are correlated with rates of such ramping activity5–7.
In the absence of immediate sensory stimuli, the timing of more ‘spontaneous’ actions is also important. Action initiation may be affected by internal state (for example, urgency signals) but, as with reaction times, contains variability. An important instance of spon-taneous action generation is deciding when to give up waiting for an anticipated event whose occurrence or timing is uncertain. This form of inter-temporal choice8—between waiting and giving up—is relevant in the context of impulsivity. Humans often choose to wait for future events, but subsequently succumb to an immediately avail-able option while waiting9,10. Some of the neural substrates of choices between immediate and delayed rewards have been identified11,12, but comparatively little is known about the timing of decisions to terminate waiting during a delay.
Insight into spontaneous actions comes from studies of volitional or self-initiated actions, which have used what are essentially wait-ing tasks with low time pressure. Classical studies identified evoked readiness potentials in the midline higher motor, parietal and
prefrontal cortices that precede actions, with a slow building potential even preceding the subject’s reported intention to move13,14. Single units have been recorded during such tasks, revealing slow ramping activity peaking around the time of action initiation15–18.
Together, these studies are consistent with the hypothesis that an integration-to-bound mechanism, commonly used to explain per-ceptual decisions and reaction times, might also be a mechanism for spontaneous action timing. We sought to substantiate this hypothesis by providing more rigorous evidence for the existence of a population of neurons displaying ramping activity resembling the decision vari-ables or integrated evidence observed in the lateral intraparietal area. A further critical issue in the case of spontaneous decisions is the origin of the signals that drive the input integrator when there is no sensory cue or evidence to accumulate. The putative input neurons would contribute causally to the determination of action timing, being partly predictive, but individual neurons would need to cooperate to reach threshold for a decision. As no such input neurons for spontane-ous decisions have been described to date, identifying their properties would be important.
To test these hypotheses, we devised a waiting task in which a small reward was available immediately, but a large reward was signaled after a longer, randomized delay. Rats tested on this task frequently aborted waiting, and the timing of these aborts varied greatly across trials, with relatively minor contributions of trial history. We focused our study on the rostral secondary motor cortex (M2, the anterior region of medial agranular cortex) an area associated with action planning and spontaneous action initiation19–21, which is considered to be homologous to primate supplementary motor areas22,23. Using multi-electrode recording from M2, we first identified a population of neurons with ramping activity that met strict criteria associated with the output of putative neural integrators, but not previously described in rodents. Furthermore, we identified a second population Champalimaud Neuroscience Programme, Champalimaud Centre for the Unknown, Lisbon, Portugal. Correspondence should be addressed to
Z.F.M. (zmainen@neuro.fchampalimaud.org).
Received 17 June; accepted 3 September; published online 28 September 2014; doi:10.1038/nn.3826
Neural antecedents of self-initiated actions
in secondary motor cortex
Masayoshi Murakami, M Inês Vicente, Gil M Costa & Zachary F Mainen
The neural origins of spontaneous or self-initiated actions are not well understood and their interpretation is controversial. To address these issues, we used a task in which rats decide when to abort waiting for a delayed tone. We recorded neurons in the secondary motor cortex (M2) and interpreted our findings in light of an integration-to-bound decision model. A first population of M2 neurons ramped to a constant threshold at rates proportional to waiting time, strongly resembling integrator output. A second population, which we propose provide input to the integrator, fired in sequences and showed trial-to-trial rate fluctuations correlated with waiting times. An integration model fit to these data also quantitatively predicted the observed inter-neuronal correlations. Together, these results reinforce the generality of the integration-to-bound model of decision-making. These models identify the initial intention to act as the moment of threshold crossing while explaining how antecedent
subthreshold neural activity can influence an action without implying a decision.
npg
© 201
4 Nature
America, Inc.
of transiently active neurons whose rates fluctuated substantially from trial-to-trial in a manner that correlated with waiting time. Using a simple quantitative model, we estimated that to match the observed strength and frequency of correlation between individual transient neurons and waiting time, substantial correlations would have to exist between pairs of transient neurons. Trial-by-trial correlation analysis of simultaneously recorded pairs confirmed this prediction. Thus, a parsimonious account of our data suggests that the origin of the vari-able timing of spontaneous actions reflects, in part, neural transients in M2 that are integrated to produce ramping activity. The results reinforce the generality of the neural integration-to-bound theory of decision-making and identify a previously unknown population of neurons in the motor system itself participating in self-initiated actions. Furthermore, they help to clarify the interpretation of well-known experiments conducted in human subjects concerning the neural antecedents of conscious decisions to act14.
RESULTS Behavior
In the waiting task (Fig. 1a and Online Methods), a rat initiated wait-ing by insertwait-ing its snout into the waitwait-ing port. Shortly thereafter (T1 delay = 0.4 s), the first tone (tone 1) was played, after which the rat could garner a small amount of water reward at the reward port. If the rat waited for a second tone (tone 2), with a delay drawn randomly from an exponential distribution (T2 delay), it could garner a larger
reward (two- to fourfold larger than the small reward). Thus, a rat wait-ing past tone 1 experienced an ongowait-ing conflict between continuwait-ing to wait for tone 2 and leaving the port to collect a small reward. A value of T2 delay was chosen so that subjects performed with an ~30% success rate in waiting trials (Online Methods).
Trials could be classified into three types (Fig. 1a–c). In a small fraction of trials, rats left the port before tone 1 (short-poke trials, 8.3 ± 4.6%, mean ± s.d., n = 37 rats). In a second class of trials, the rat responded after tone 2 (patient trials, 32.9 ± 1.4%). In the third class, rats left the port after tone 1, but before tone 2 (impatient trials, 58.8 ± 3.9%). Notably, in the impatient trials, the waiting time showed substantial trial-to-trial variability, as indexed by the difference between the 90th and 10th percentiles waiting time (∆WT [0.1–0.9]: median = 1.31 s, range = 0.59–3.06 s; Fig. 1c,d) and the average difference in waiting times from tone 1 of two consecutive impa-tient trials normalized by a sum (CV2, 0.63 ± 0.11; Online Methods and Fig. 1e). Median waiting time was highly correlated with ∆WT [0.1–0.9] (R = 0.86, P < 10−10).
In impatient trials, rats did not usually respond promptly to tone 1, but often stopped waiting after hundreds of milliseconds or sec-onds, but before tone 2. Two observations indicate that, in impatient trials, rats intended to wait for the large reward and were not sim-ply responding slowly to the first tone and understood the rules of the task. First, when rats succeeded in waiting for the second tone, they responded promptly (167 ms, median across rats, comparable to
Tone 1 Tone 1 Tone 2
a
Wait Poke in Large reward Small rewardImpatient trial Patient trial Short poke trial
Poke out
Wait
Poke out Poke out
Tone delay distribution
0 1 2 3 4 Tone delay (s) 0.1 0.05 1 0 Probability T1 delay T2 delay Tone Waiting port Reward port Reward delivery T1 delay T2 delay Waiting time Response time Movement time 100 120 140 160 180 200 0 1 2 3 4 Trial
Time from poke in (s)
b
Waiting port Reward portc
0 1 2 3 4 0 0.02 0.04 0.06 Waiting time (s) Fraction of trials Rat I02 0 2 4 0 0.1 0.9 1.0 Cumulative fraction of trials Waiting time (s) ∆WT [0.1–0.9] ∆WT [0.1–0.9] (s) 0 1 2 3 4 0 2 4 6 8 10 Number of rats 37 ratsd
f
0 0.5 1 0 0.1 Fraction of trials Response time to tone 2 (s) Rat I02 Number of rats 0 2 4 6 8 10 Waiting time CV2 0 0.2 0.4 0.6 0.8 1 37 ratse
Number of rats 0 2 4 6 8 10 0 0.2Peak resp. time (s)
g
37 rats Figure 1 The waiting task and the behavioral results. (a) Schematic
of trial events in the waiting task (top). In each trial, after
waiting for a certain period at the waiting port, the rat received a tone(s), moved to the reward port and received a water reward, the size of which depended on the number of the tones presented. Inset, probability distributions of the delays to tone 1 (T1, light green) and tone 2 (T2, dark green). Bottom, timeline of the task events and the definition of the behavior parameters. The light green rectangle indicates the presentation of tone 1, the dark green rectangle represents tone 2 and the light blue rectangle indicates reward. Tone 2 is represented by a hatched rectangle to indicate it was not played in the impatient trials.
(b) Snapshot of the waiting behavior. The waiting period in each trial is indicated as a gray bar. Light green ticks represent a presentation of tone 1 and dark green ticks represent tone 2. (c) Waiting time histograms of short poke trials (gray), impatient trials (red) and patient trials (blue) of an example rat. The histograms show data pooled across sessions. Inset, cumulative histogram of waiting times in impatient trials from this rat. The arrow indicates the range from 10th to 90th percentile waiting times (∆WT [0.1–0.9]). (d) Distribution of ∆WT[0.1–0.9] across rats. Filled bars indicate electrophysiology rats. (e) Distribution of CV2 across rats. Filled bars indicate rats used for electrophysiology. (f) A histogram of response time to tone 2 of an example rat (dark blue, n = 1,501 trials). Light blue–shaded area indicates 95% range of response time histograms from shuffled data. The peak response time is indicated by an arrowhead. (g) Distribution of peak response time across rats. Significant peak is shown in dark blue and non-significant peak in black. Filled bars indicate rats used for electrophysiology (all were significant).
npg
© 201
4 Nature
America, Inc.
100–200 ms in an auditory response task24; Fig. 1f,g and
Supplementary Fig. 1). Second, rats moved more quickly to the water
port on patient than on impatient trials (Fig. 2), indicating that impa-tient and paimpa-tient trials of similar waiting times were associated with different reward expectations25.
Ramp-to-threshold activity in M2
To determine specific computations performed by M2 for waiting time decisions, we next used chronic tetrode arrays to record neuronal activity while rats performed the waiting task. We recorded a total of 385 neurons in 8 rats from M2. A large fraction of neurons in M2 showed task-modulated activity in different phases of the waiting task (Supplementary Fig. 2). We mainly focused on impatient trials because, in those trials, the rats decided when to leave the port (stop waiting), independent of overt cues. The high trial-to-trial variability of waiting time in impatient trials provided a strong signal with which to correlate with neural activity.
We first searched for neurons with ramp-to-threshold activity that might serve as an internal trigger for initiating a response. We selected for neurons meeting two criteria: the firing rate reached a constant
threshold before movement initiation and the timing of threshold cross-ing was correlated with waitcross-ing time with a regression slope close to unity (Online Methods). An example neuron meeting these criteria is shown in Figure 3. The firing rate of this neuron gradually ramped up during the waiting period (Fig. 3a), reaching the same firing rate just before the poke out (Fig. 3b). The time for the firing rate to cross a 57 spikes per s threshold, the highest threshold level we tested for this neuron, was highly correlated with the waiting time of the rat (Fig. 3c and Online Methods). The regression slope was close to unity, suggesting that the latency to the poke out from the threshold crossing time was constant.
We focused on 105 of 385 recorded neurons that showed reliable activation (48) or suppression (57) at the poke-out periods (Online Methods). Among this population, 27 neurons (20 of 48 activated neurons, 7 of 57 suppressed neurons, 7.0% of all recorded) met the criteria for a ramp-to-threshold neuron (threshold crossing time correlated with waiting time with regression slope close to unity) (Supplementary Fig. 3). By comparing the observed fraction of ramp-to-threshold neurons (7.0%) to that obtained when ran-domly permuting the waiting times and neural data across trials,
a
0.4 0.5 0.6 0.7 0.8 0.9 Movement time (impatient trial) 0.4 0.5 0.6 0.7 0.8 0.9
Movement time (patient trial)
Rat I02
b
0.8 0.9 1.0 1.1 1.2 Patient trial Impatient trialNormalized movement time
37 rats Figure 2 Difference in movement times in impatient and patient trials. (a) A scatter plot
indicating median movement time in the impatient and the patient trials of different sessions of an example rat. Each gray circle indicates median movement time of the impatient trials and that of the patient trials from one session. The black circle indicates the mean of the median movement times of the impatient trials and that of the patient trials. Error bar represent ±s.e.m. (b) Normalized mean movement times for impatient (red) and patient (blue) trials. For each rat, the movement time is normalized with movement time of the impatient trial. Error bar represents ±s.e.m. Gray circles represent the normalized movement times of the patient trials of individual rats. Filled circles indicate rats used for electrophysiology. Movement time in patient trials was significantly faster than that in impatient trials (Wilcoxon signed-rank test, P < 0.001, n = 37 rats).
e
0 1 2 0 20 40 60 80 Waiting time (s)Firing rate at poke out (spikes per s)
a
−1 0 2 0 20 40 60 80Time from poke in (s)
Firing rate (spikes per s)
f
10 20 30 40 50 0 1 2Threshold (spikes per s)
Prediction time (s)
d
0.5 1 1.5 2 20 50 100 150 Waiting time (s) Ramp rate (spikes per s 2)c
0 1 2 16 spikes per s 57 spikes per s 0 1 2 Waiting time (s)Time to cross threshold (s)
b
−2 0 1 0 20 40 60 80Time from poke out (s)
Firing rate (spikes per s) 0.4 1 2 Waiting time (s)
g
0 2 4 6 −1 0 1Correlation coefficient between log waiting time and log ramp rate
Number of neurons
h
0 2 4 6 8 −1 0 1Correlation coefficient between waiting time and firing rate
Number of neurons
i
0 0.5 1
Earliest prediction time (s) 0 2 4 6 8 Number of neurons 2 Figure 3 Ramp-to-threshold type predictive
activity. (a–f) Example M2 neuron with ramp-to-threshold type activity. (a) Perievent time histograms (PETHs) for an M2 neuron in different waiting time trials, aligned to poke in and smoothed with a Gaussian filter (s.d. = 50 ms). Impatient trials are grouped according to the waiting time, indicated by the color scale in b, and consistent throughout the figure. Dashed lines in PETHs indicate times at which a rat already left the port in some of the trials in that group. Threshold (57 spikes per s) is indicated by the horizontal solid line. (b) PETHs for the neuron presented in a, aligned to poke out. (c) Time to cross a threshold firing as a function of mean waiting time. The analyses with the highest and lowest thresholds with significant correlation (57 spikes per s (triangle) and 16 spikes per s (inverted triangle), respectively) are shown.
R = 0.99, P < 0.001, n = 9 for the 57 spikes
per s threshold; R = 0.86, P = 0.001, n = 10 for the 16 spikes per s threshold. Dashed lines indicate the regression line. (d) The rate of ramping activity as a function of mean waiting time. The dashed line indicates the regression line. R = −0.93, P < 0.001, n = 9. (e) The firing
rate at the poke-out period (50-ms window before the poke out) is plotted against the mean waiting time for each group. Note that firing rate reached almost the same level at the poke out. R = 0.58, P = 0.076, n = 10. (f) Difference between time to cross threshold and the waiting time (prediction time) is plotted against the threshold tested. Black circles represent mean prediction time across groups, error bars represent ±s.e.m. and filled black circles represent significant threshold. (g–i) Population data (n = 27 neurons). (g) Distribution of correlation coefficients between the rate of ramping and the waiting time. Ramp-up neurons are shown in pink, ramp-down neurons in blue and neurons with significant correlation in vivid color. (h) Distribution of correlations between the firing rate at the poke-out period and the waiting time. (i) Distribution of the earliest prediction time (Online Methods).
npg
© 201
4 Nature
America, Inc.
we estimated the probability of obtaining this result by chance at P < 0.002 (permutation test, Online Methods).
After selecting a population using relatively strict criteria, we con-sidered in detail further properties of this population that were not included in the selection criteria. Briefly, this population of neurons showed a strong positive or negative correlation between ramp rate and waiting time (Fig. 3d,g and Supplementary Fig. 4), but a small or zero correlation between firing rate at movement time (poke out) and waiting time (Fig. 3e,h). Finally, individual neurons’ threshold cross-ing times predicted future waitcross-ing times substantially in the future, up to around 1 s in advance (Fig. 3f,i).
Transient waiting-time predictive activity
We next looked for neurons that also showed waiting time predictive activity that did not take the form of ramp-to-threshold. Specifically, we searched for neurons exhibiting different firing rates for differ-ent waiting time trials, which could serve as input to an integrator and therefore contribute to the different rates of ramping activity.
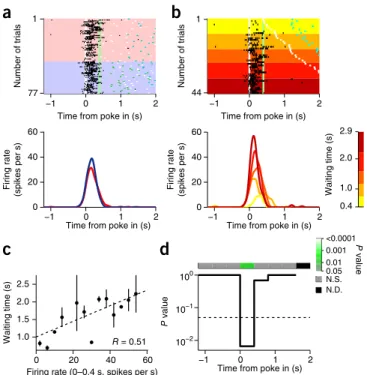
This analysis revealed a larger second population of M2 neurons, an example of which is shown in Figure 4. This neuron showed tran-sient activation when the rat poked into the waiting port (Fig. 4a). The activation was stronger in impatient trials with longer waiting times (Fig. 4b), and the firing rate of this neuron was significantly correlated with waiting time (R = 0.51, P < 0.001, n = 38 trials;
Fig. 4c). The correlation was significant only in the time window
between poke in and tone 1 presentation (Fig. 4d). The activity of this neuron after the poke in was able to predict the waiting time in each trial to the extent of explaining 26% of the variance.
M2 neurons with transient waiting time correlations showed a variety of different dynamic profiles, including different times and durations of firing. Figure 5a shows an example of a neuron show-ing a more prolonged activation durshow-ing the delay period. Figure 5b shows an example of a neuron with the opposite correlation: waiting time decreased as firing rate increased. Overall, of 356 M2 neurons
a
b
−1 0 1 2
77 1
Time from poke in (s)
Number of trials −1 0 1 2 0 20 40 60
Time from poke in (s)
Firing rate
(spikes per s) Firing rate (spikes per s)
−1 0 1 2
44 1
Time from poke in (s)
Number of trials −1 0 1 2 0 20 40 60
Time from poke in (s)
c
0 20 40 60 1.0 1.5 2.0 2.5Firing rate (0–0.4 s, spikes per s)
Waiting time (s) R = 0.51 0.4 1.0 2.0 2.9 Waiting time (s)
d
−1 0 1 2 10−2 10−1 100Time from poke in (s)
P value N.S. N.D. <0.0001 0.001 0.01 0.05 P value
Figure 4 An M2 neuron with transient predictive activity. (a) Raster plots (top) represent activity of an M2 neuron, with each row corresponding to a single trial aligned to poke in (white line) and each black tick to a single spike. The impatient trials are shown on the pink background and the patient trials on the blue background. Trials are chronologically ordered from top to bottom in each type of trials. Color ticks represent tone 1 (light green), tone 2 (dark green), poke out (white) and poke in into the reward port (light blue). PETHs at the bottom represent activity in the impatient (red) and patient trials (blue), smoothed with a Gaussian filter (s.d. = 50 ms). (b) The same neuron in the impatient trials. Trials are sorted in ascending order of the waiting time. PETHs (bottom) of trials grouped by waiting time, as indicated by a color scale. (c) Mean waiting time is plotted against mean firing rate at 0–0.4 s from poke in. Trials are grouped according to firing rates (4–spikes per s bin) for the visualization purpose only. Error bars represent ±s.e.m. Circles without error bars represent groups with 1 or 2 trials. Dashed line: regression line. (d) Significance (P value) of the Pearson’s correlation coefficient was calculated at each 0.4-s non-overlapping bin and plotted as a function of time (corrected for the multiple comparisons). Significance level (P = 0.05) is indicated by the dashed line. The significance of each time bin is also indicated by the color bar on top. N.S., not significant; N.D., no data.
a
−1 0 1 2 3 0 10 20 30Time from poke in (s)
Firing rate (spikes per s) 0.4
1 2 3
b
−1 0 1 2 3 0 2 4 6 8 10Time from poke in (s)
<0.0001 0.01 0.05 0.001 N.S. N.D. 0.4 1 2 3 Waiting time (s)
d
–1 –0.5 0 0.5 1 0 0.05 0.10 Waiting time (s) Fraction of predictive neurons 64 Neuron number −1 0 1 2Time from poke in (s) 1
c
<0.0001 0.01 0.05 0.001 Not significant No data P valueFigure 5 Population data of predictive activity. (a,b) Other examples of M2 neurons with predictive activity. (a) Shown is an M2 neuron with sustained activation during waiting and whose firing rate was positively correlated with the waiting time. Data are presented as in Figure 4b,d. (b) Shown is an M2 neuron with negative correlation between the firing rate and the waiting time. Data are presented as in Figure 4b,d. The color scale in green indicates a positive correlation and orange a negative correlation. (c) Time course and the sign of the correlation for all the predictive neurons (n = 64 neurons). The significance of the correlation is calculated for 0.4-s overlapping time window in every 0.02-s time step for each neuron and indicated in each row. Neurons are sorted according to a center of mass of log(P value). Only the time bins with significant P value were used to calculate the center of mass. The color code is the same as in b. Bonferroni correction for multiple comparisons was used to select neurons with transient correlation, but the P value here is not corrected for the multiple comparisons, as the main points are the time course and the sign of the predictive activity, not its absolute value. (d) Time course of fraction of predictive neurons. For each neuron, waiting time correlation with firing rate was tested on subsamples of 30 impatient trials, allowing comparisons across time bins. Subsampling was performed 1,000 times and error bars represent 95th percentile ranges. The white dashed line indicates chance level of 0.05.
npg
© 201
4 Nature
America, Inc.
a
Nose-poke block Lever-press block
70 ~ 100 trials 70 ~ 100 trials 70 ~ 100 trials Nose-poke block
c
Correlation of firing rate
and lever-press waiting time
Correlation of firing rate and nose-poke waiting time
−1 0 1 −1 0 1 Nose-poke predictive Lever-press predictive Both predictive Not predictive
b
−1.2 0 3 0 20 40 60 80 100Time from poke in (s)
Firing rate (spikes per s)
1 2 3 −1.2 0 3 0 20 40 60 80 100
Time from lever press (s) 1 2 3
Waiting time (s)
examined in a population analysis, 64 (18%, P < 0.002 with permutation test with trial shuffling) showed transient waiting-time predictive activity (Supplementary Fig. 3 and Online Methods). Across the entire population of waiting time predictive neurons, two features are critical (Fig. 5c). First, different neurons showed predictive activity, spanning the waiting period (Fig. 5c,d). Second, approximately equal numbers of neurons were positively and negatively correlated with waiting time (Fig. 5c). This is consistent with the idea that individual neurons contribute to push waiting time longer or shorter, through either positive or negative coupling to the putative integrator circuit.
Action specificity of waiting-time predictive activity
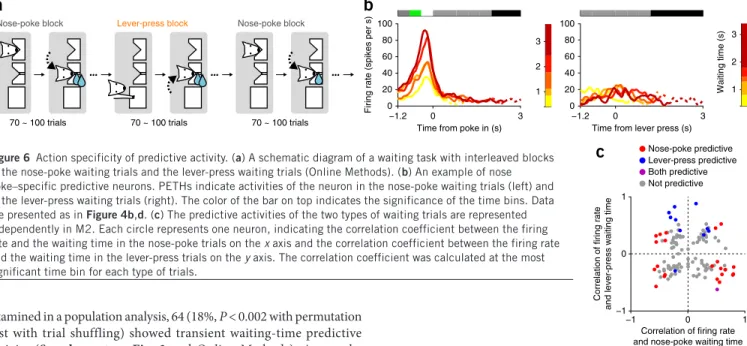
If waiting-time predictive activity represents a signal related to pre-paring a particular action, it should be action specific. Alternatively, predictive activity might represent an abstract signal, such as level of patience or the value of the anticipated outcome of the trial, which would not be expected to be action specific. To differentiate these pos-sibilities, we trained three rats to perform, in addition to the nose-poke
waiting task, a lever-press waiting task (Fig. 6a, Supplementary Fig. 5 and Online Methods) and recorded 175 units in M2 during perform-ance of the dual nose-poke/lever-press waiting task.
An example M2 neuron that showed transient activation in nose-poke trials correlated with waiting time is shown in Figure 6b. The activity of this same neuron was weak during the lever-press trials and was not correlated with lever-press waiting time. To quantify the action specificity of predictive activity in the population of M2 neurons, we compared the strength of correlation between firing rate and waiting time in nose-poke trials with that in lever-press trials (Fig. 6c). The correlation coefficients for those two trial types appeared independent (R = −0.07, P = 0.43 for all 119 neurons; R = −0.26, P = 0.22, for all 23 nose-poke predictive neurons; R = −0.4, P = 0.18 for all 11 lever-press predictive neurons). The percentage of lever-press predictive neurons among all the nose-poke predictive Figure 6 Action specificity of predictive activity. (a) A schematic diagram of a waiting task with interleaved blocks
of the nose-poke waiting trials and the lever-press waiting trials (Online Methods). (b) An example of nose poke–specific predictive neurons. PETHs indicate activities of the neuron in the nose-poke waiting trials (left) and in the lever-press waiting trials (right). The color of the bar on top indicates the significance of the time bins. Data are presented as in Figure 4b,d. (c) The predictive activities of the two types of waiting trials are represented independently in M2. Each circle represents one neuron, indicating the correlation coefficient between the firing rate and the waiting time in the nose-poke trials on the x axis and the correlation coefficient between the firing rate and the waiting time in the lever-press trials on the y axis. The correlation coefficient was calculated at the most significant time bin for each type of trials.
a
c
b
−1 0 1 −1 0 1 Poke-out/delay selectivity indexLever-release/delay selectivity index
d
−1 0 1 −1 0 1 Lever-release/delay selectivity indexPoke-out/delay selectivity index
−1 0 2
0 20 40
Time from poke in (s)
Firing rate (spikes per s) −1 0 2 0 20 40
Time from lever press (s) 1 2 0.4 1 Waiting time (s) −1 0 2 0 20 40
Time from poke in (s)
Firing rate (spikes per s) −1 0 2 0 20 40
Time from lever press (s) 1 2 3 1 2 3 Waiting time (s)
Figure 7 Action specificity of ramp-to-threshold activity. (a) An example of nose poke–specific predictive neurons. PETHs indicate activities of the neuron in the nose-poke waiting trials (left) and in the lever-press waiting trials (right). Data are presented as in Figure 3. (b) Poke-out/delay selectivity index and lever-release/delay selectivity index for all of the nose-poke predictive neurons (ramp-to-threshold type). Of six nose-poke predictive neurons, two neurons did not show significant difference between activity at the lever-release period and activity at the delay period (open circle), and were therefore not tested with threshold-type predictive activity. The other four neurons showed significant difference in activity at the lever-release period and delay period (black and red filled circles), and were therefore tested with the threshold-type predictive activity for the lever-release time. One
of them showed significant predictive activity in the lever-press trials, but the direction of ramping activity was the opposite (red filled circle). (c) An example of the lever press–specific predictive neurons. Data are presented as in Figure 3. (d) Lever-release/delay selectivity index and poke-out/delay selectivity index for all the lever-press predictive neurons (ramp-to-threshold type). Of 15 lever-press predictive neurons, nine neurons did not show significant difference between activity at the poke-out period and activity at the delay period (open circle). Six neurons showed significant difference in activity at the poke-out period and delay period (black and red filled circle), and were therefore tested with the threshold-type predictive activity for the poke-out time. One of them (the same as the red neuron in b) showed significant, but opposite, predictive activity in the nose-poke trials.
npg
© 201
4 Nature
America, Inc.
neurons (4.4%, 1 of 23 neurons) was not more than would be expected from the percentage of lever-press predictive neurons among all the neurons (11 of 119 neurons, 9.2%; χ2 test, χ2(1) = 0.81, P = 0.37).
We also examined action specificity in neurons with the ramp-to-threshold type predictive activity (Fig. 7). We only found one neuron that showed ramping type predictive activity in both types of waiting trials, but the sign of ramping activity in this neuron was opposite for the two types of trials. These results suggest that the predictive activity in M2 is action specific rather than tied to general states or outcome predictions, although we could not specify whether observed action specificity was a result of effector specificity (nose-poking or lever-pressing), action-direction specificity (plan to move left or right) or other forms of specificity. Further characterization of activity of waiting time predictive neurons revealed that weaker predictive activity was already present during the intertrial interval (Supplementary Fig. 6), that activity in patient trials was consistent with activity in impatient trials (Supplementary Fig. 7), and that transient neurons’ waiting-time predictive activity can be partly explained by somatic motor input (Supplementary Fig. 8) and trial histories (Supplementary Fig. 9).
Integrator model
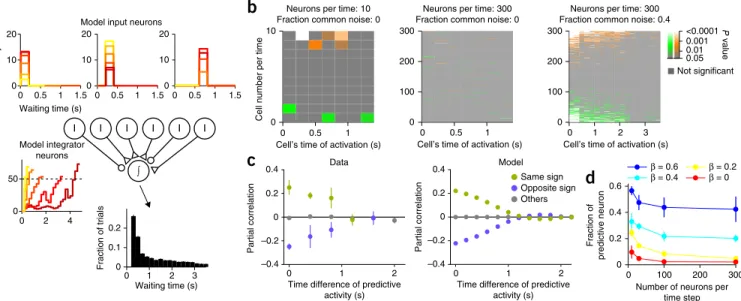
To test whether a neural integration process could explain the relationship between the observed electrophysiology and behav-ior, we instantiated this theory in a model based on our observa-tions. The input to the integrator consisted of a population of transiently active units connected to an ideal temporal integra-tor by synaptic weights randomly distributed around a near-zero mean (Fig. 8a). When the integrator reached a given threshold, an action was elicited. Each transient neuron was assigned a specific
delay relative to waiting onset, and the amplitude of firing was scaled by a random variable on each trial.
The output of the integration circuit was indeed similar to the activity of the observed ramp-to-threshold neurons (Fig. 8a). The magnitude of activation of transient neurons gained trial-by-trial correlation with waiting times by affecting the slope of ramping activity of the integrator neuron. However, if we assumed that firing of transient neurons were independent of each other, the contribution of each neuron to waiting time decreased markedly as the number of transient neurons increased (Fig. 8b). As it is known that even small inter-neuronal correlations make the responses of individual neurons correlated with behavior even in case of a large population size26, we hypothesized that correlations induced by shared input might prevent neural-behavioral correlations from being diluted by the law of large numbers. We first analyzed the actual trial-to-trial firing rate correlations from subsets of simultane-ously recorded M2 neurons. To factor out the contribution of waiting time itself to inter-neuronal correlations, we used a partial correlation technique (Online Methods; Fig. 8c). Despite having factored out corre-lation with waiting time, we observed large inter-neuronal correcorre-lations, the pattern of which was such that the relative sign of correlation between neurons and behavioral output determined whether an inter-neuronal correlation will be positive or negative (that is, two neurons that were both positively or negatively correlated with waiting time were on aver-age positively correlated to one another, whereas positive-negative pairs were negatively correlated with one another). Furthermore, the strength of correlation decayed as a function of time difference of the activity of each neuron. To test whether the integration-to-bound model was consistent with these observations, we introduced a common noise source that was injected into all transient units with a sign and strength
0 100 200 300
0 0.2 0.4 0.6
Number of neurons per time step Fraction of predictive neuron β = 0.6 β = 0.4 β = 0.2β = 0
d
0 0.5 1 0Cell’s time of activation (s) Neurons per time: 300 Fraction common noise: 0
0 1 2 3
0 100 200 300
Cell’s time of activation (s) Neurons per time: 300 Fraction common noise: 0.4
a
∫
I I I I I I
Waiting time (s)
Fraction of trials
Model input neurons
Model integrator neurons 0 1 2 3 0 0.1 0.2 0 0.5 1 1.5 0 10 20 Waiting time (s) Activity 0 0.5 1 1.5 0 10 20 0 2 4 0 50 0 0.5 1 1.5 0 10 20
b
0 0.5 1 0 10Cell’s time of activation (s)
Cell number per time
Neurons per time: 10 Fraction common noise: 0
100 200 300
c
0 1 2 –0.4 –0.2 0 0.2 0.4Time difference of predictive activity (s) Partial correlation Data 0 1 2 –0.4 –0.2 0 0.2 0.4
Time difference of predictive activity (s) Partial correlation Model Same sign Opposite sign Others <0.0001 0.01 0.05 0.001 Not significant P value
Figure 8 Integrator model. (a) A schematic diagram of an integrator model. Circles with ‘I’ indicate input neurons. A circle with ‘∫’ indicates an integrator neuron. A small triangle indicates an excitatory synapse and a small circle indicates an inhibitory synapse. Inset panels show PETHs of example model neurons (top three panels are example input neurons and the bottom left panel is an integrator neuron; data are presented as in Fig. 3a). The bottom right inset panel shows a waiting time histogram of the model (mean ± s.e.m. of 1,000 model sessions of 100 trials). (b) Waiting time correlation for all the input neurons from three example models with different parameters (number of neurons per time: 10 (left), 300 (middle and right); fraction of common noise (β): 0 (left and middle), 0.4 (right)). Color indicates P value of waiting time correlation. Neurons are arranged according to its activation time (x axis) and synaptic weight (y axis, positive weight at the top and negative weight at the bottom). (c) Left, pairwise partial correlation between simultaneously recorded neurons as a function of time difference of the most predictive time bins of each neuron. Pairs are categorized as the same sign (green), opposite sign (blue) or other (gray) according to the sign of waiting time correlation of each neuron. Error bars indicate s.e.m. N = 1,836 pairs. Right, pairwise partial correlation between input neurons in the model as a function of time difference of their activities (number of neurons per time, 300; fraction of common noise (β), 0.4). Mean ± s.e.m. of 100 model sessions. Error bars are too small to be visible. (d) Fraction of predictive neurons as a function of the number of neurons per time step and fraction of common noise in the input neuron activity (β). Mean ± s.e.m. of 1,000 model sessions.
npg
© 201
4 Nature
America, Inc.
proportional to its synaptic weight (Fig. 8c). By varying the number of neurons and the relative magnitude of shared versus private noise, we characterized the relationship between neural-behavioral and inter-neuronal correlations. We found that, as the fraction of shared noise was increased, the fraction of transient neurons significantly correlated with waiting time increased, even for large population sizes (Fig. 8d). At a level of common noise sufficient to reproduce the observed neuronal-behavioral correlations, we obtained a prediction for both the magnitude and signs of trial-by-trial correlations between neurons. This prediction was quantitatively consistent with those actually recorded (Fig. 8c). Thus, the integration-to-bound model provided a simple and self-consistent account of the neural-behavioral correlations and inter-neuronal correlations observed in the data.
DISCUSSION Waiting task
We developed a task in which subjects had to wait for two tones to obtain a large reward, but could respond after the first tone to obtain a small reward. Studies on standard inter-temporal choice tasks11,12 have focused on a single choice point at which subjects decide between an immediate and a delayed reward. In contrast, subjects in our task were able to respond for the small reward while waiting, similar to previous human studies9,10. As far as we are aware, there are no stud-ies investigating a neural mechanism of spontaneous ‘giving up’ in such inter-temporal choice procedures. We provide evidence for the involvement of the cortical motor system in such behaviors.
Neural activity and classes
We recorded two types of neurons whose activity correlated with wait-ing time, even hundreds of milliseconds to seconds before movement onset. One class of neurons showed ramping activity that reached a threshold just before movement initiation and a ramping rate that was inversely correlated with waiting time. This pattern of activity is reminiscent of neurons in the frontal eye field, premotor and pri-mary motor cortex, lateral intraparietal area, and superior colliculus recorded from monkeys performing sensorimotor tasks5–7,18,27.
The second class of predictive activity occurred transiently and tiled all periods of waiting period and at least 1 s beforehand. To some degree, they resemble neurons reported in posterior parietal cortex28, medial prefrontal cortex29 and striatum30. However, unlike those previously described transients carrying signals related to move-ment location, here the transient neurons carried information about movement timing. Neurons in primate supplementary eye field show a similar form of transient signal predicting reaction time in a stop signal task, but with only about 10% of the delay and variance that we observed31. Although the analyses that we performed identified two classes, we cannot ascertain whether these classes are truly distinct or reflect a spectrum. There was no evidence for segregation of these populations across the surface of M2 (Supplementary Fig. 10) and we were not able to determine whether the profiles segregated by layer. An intriguing possibility is that the transient activity reflects neurons in layer 2/3, as sequences imaged in posterior parietal cortex28.
Integration model
The data supported our hypothesis that action timing could be explained by an integration-to-bound process, a computation hypoth-esized to underlie choices based on perceptual, mnemonic, value and other forms of decision variables2–4,32,33. Our data strengthen the evidence for the applicability of this class of models to cases where there is no evidence per se. In the model, transient waiting-time predictive neurons constitute the input, ‘voting’, for short or long waiting times.
They fire with different rates from trial-to-trial and are connected to the integrator with positive or negative weights. Ramping neurons, on the other hand, are represented by the output of the integrator. By implementing a model based on this integration-to-bound theory, we were able to compare predictions of the theory to our data. The integration-to-bound model explains a number of salient features of the data parsimoniously. First, it explains the properties of ramping neurons, both the correlation between ramp rate and waiting time and the existence of a uniform threshold at action initiation. It also explains the observation that ramping neurons reach a lower threshold when the rat responds to a tone that arrives while waiting. Second, by using inputs modeled on the observed transient responses, the model explains the neuronal-behavioral correlations between transient neuron activity and waiting time. Notably, despite the existence of correlations, in this model, the decision to act is only made just before movement is observed. The observation of correlations of antecedent neural activity with action timing is a consequence of their causal con-nection through the integrator and do not imply a decision.
In addition to explaining these observations, the model also led to predictions concerning inter-neuronal correlations that we did not anticipate. We chose to introduce correlations in the model using a single shared noise source. The contribution of the shared noise to each input neuron’s firing rate was proportional to the weight of its connec-tion to the integrator. The model predicted that transient neurons must have specific inter-neuronal correlations if individual neurons’ correla-tions with behavior are to be maintained in large pools of neurons.
It is notable that two aspects of this prediction were met. First, the magnitude of shared noise required to achieve the observed fraction of neurons with significant behavioral correlations at population sizes on the order of 103 to 104 imply a magnitude of inter-neuronal correla-tions of around 0.2, as seen in the data. Second, in this model, pairs of neurons with the same sign of behavioral correlations will themselves be positively correlated and pairs of neurons with the opposite sign will be negatively correlated34. The model and data also suggest an overall mean correlation level near zero, consistent with balanced net-work theory35. We believe these predictions to be general features of the proposed theory. The biophysical mechanisms supporting integra-tion are an important and unresolved issue. One class of biophysical models suggests that ramping arises from attractor dynamics depend-ing on recurrent excitatory connections2. However, we have not tested the predictions of these models. Further elements introduced into the present model, such as variable weighting of inputs have also been considered biophysically36. The integration-to-bound mechanism represents a cognitive primitive that may be assembled into diverse computations together with other motifs, such as divisive normaliza-tion, spike timing–dependent plasticity or reinforcement learning.
Anatomical context
As to the neural substrates of the proposed integrator, two general hypotheses could be considered. Because we observed all the constitu-ents of the model in M2, it could be that M2 is capable of supporting integration in local circuitry. Alternatively, integration could occur with a larger circuit comprising a larger network of cortical and subcortical regions to which M2 is connected. Although the data do not present much evidence bearing on this question, our default is to consider the latter hypothesis to be more likely. One observation favoring this alter-native is that ramp-to-threshold activity has already been observed in many other areas5–7,18,27. A second argument favoring a widely dis-tributed network is that this would allow more kinds of evidence to be integrated into the same process. Finally, we also conjecture that the slow dynamics that we observed, compared with the much more rapid
npg
© 201
4 Nature
America, Inc.
dynamics in stimulus-driven response, would be produced more readily in larger size networks (R. Chaudhuri et al., Soc. Neurosci. Abstr. 597.10, 2012). A specific possibility worth investigating is that integration takes place as a ‘reverberation’ in the goal-directed circuit including not only M2 (ref. 37), but also ventrolateral orbitofrontal cortex (VLO)12,23,38, prelimbic cortex39,40 and dorsomedial striatum22,38.
Rat M2, also known as medial agranular cortex (AGm), and partly overlapping with lateral agranular cortex (AGl22,23), is considered on anatomical and physiological grounds to be homologous to the pri-mate higher motor cortices, including premotor cortex, supplementary motor complex and frontal eye field19,22,23. At a single-neuron level, M2 (including areas at around anterior-posterior axis (AP) 2–3 mm from Bregma, somewhat more caudal than our center of recordings) contains action predictive choice signals19–21. Our recordings spanned a large area of rostral M2 (AP 1.8–5.6, medial-lateral axis (ML) 0.8–2.6 mm from Bregma) and waiting time predictive neurons were present uniformly throughout this extent. The caudal part of M2 partly overlaps with a whisker-related area of medial agranular cortex (AP 0.5–4.5 mm)41,42, but the majority of our recordings (70%) were from a more rostral sub-region of M2 (>AP +4.6 mm’ Supplementary Fig. 10). Important M2 outputs include primary motor cortex, the dorsocentral region of the striatum and the subthalamic nucleus22, as well as brain stem motor nuclei43, the superior colliculus and other midbrain motor regions22,43. In particular, the superior colliculus, which is involved in orienting deci-sions in rats44, has been proposed to be a key element supporting the threshold nonlinearity in integration45.
Origin of trial-by-trial fluctuations
In our task, waiting times exhibited near Poisson variability. To account for this variability with the integration-to-bound model, it was neces-sary to introduce large amounts of noise in model units. We do not take this as evidence for noise introduced by the brain, but rather as a call for further scrutiny of the contributors to this variability. One source of vari-ability in trial-by-trial neural activity might be varivari-ability in movements or posture during waiting. To test this, we performed video tracking and extracted time series of position and orientation of the rat’s body. Although the rats’ behavior during waiting was relatively constrained by the requirement of keeping the snout inside the waiting port (or paw on the lever), multilinear regression analysis showed that around 20% of waiting time predictive neurons activity could be explained by these features, whereas 80% remained significant (Supplementary Fig. 8). We consider it plausible that transients reflect input from sensory areas, especially somatosensory and proprioceptive input, given the strong connections between motor cortices and somatosensory cortices.
A recent anatomical study suggested the existence of an entire body map in the rodent M2 (ref. 46). We did not determine precisely the somatic locations linked to the recording locations, but the wide distribution of waiting time correlated activity suggests the recruitment of multiple body areas in this task. Specific micro-movements may have been incidentally reinforced, leading to ‘superstitious’ behavior (R. Kawai et al., Soc. Neurosci. Abstr. 790.1, 2010) and amplifying the trial-to-trial variability. In addition to these somatic-motor loops, we could expect additional contributions to transient fluctuations from interoceptive systems and other sensory systems. Under the hypothesis that M2 is a general locus of integrated signals, in tasks in which reward is contingent on specifically controlled sensory input, we would expect to observe similar ramping activity, but with inputs dominated by the appropriate sensory modalities.
Value and intertemporal choice
Another likely source of variability in waiting time predictive neurons is variability in decision values originated from the past trial history of
waiting decisions and reward outcomes. Waiting and responding were associated with different decision outcomes (small versus large water amount) and different costs (waiting time), which might be updated through experience. Waiting-time predictive neurons might therefore reflect, in part, decision values as well as action plans21. Although substantial evidence against abstract value coding is provided by our experiment showing that M2 neurons are strongly selective for spe-cific action sequences, even when they were associated with similar reward sizes and waiting times (Fig. 6), it is possible that the decision value associated with specific actions is multiplexed with waiting time predictive signals. A multiple regression analysis did reveal a contri-bution of past trial decisions and outcomes to activity in subsequent trials, but this reflected only 9% of the trial-by-trial variance. Small increments and decrements in activity according to the trial history would allow subjects to adjust their mean waiting time in the face of changing motivational conditions. Finally, from these considerations, we infer that other functionally relevant variables may gain access to influencing M2 input, thereby suggesting a hypothesis for how confidence signals47 may be read out by waiting time48.
Implications for self-initiated actions
Slow building activity has been theorized for nearly 50 years as a neural mechanism for generation of self-initiated actions13–17. Here, we have strengthened these concepts in four dimensions. First, our data strengthen the evidence that an observer can ‘forecast’ a simple decision by observing the state of the brain before a decision on a single trial basis17,18. Second, our results provide the strongest level of quanti-tative evidence supporting the involvement of an integration-to-bound mechanism. Notably, our model predicted previously unobserved patterns of inter-neuronal correlation. Third, these recordings provide compelling evidence linking neurons in the rat premotor cortex to neural activity observed both in human electroencephalogram (readiness potential13,14) and primate frontal cortices15–18. These cortices are considered function-ally homologous to rodent M2 (refs. 22,23). Our experiments provide a rodent model of an important cognitive phenomenon with physiological and anatomical justification and extend the applicability of this class of experiments across species. Fourth, these results identify, to the best of our knowledge for the first time, a possible driving force or causal anteced-ent for ramping activity (that is, transianteced-ent input neurons; Figs. 4 and 5). This finding strengthens the plausibility of the integration-to-bound model to the case of voluntary actions. It also opens doors to further studies to elucidate the properties of these antecedent signals and dissect neural mechanisms underlying concepts such as ‘will’ and ‘self’ that are used to describe this class of actions.
Supported by these considerations, an integration-to-bound theory of voluntary action provides a potential resolution to the long-standing controversy over the interpretation of previous experiments showing that readiness potentials precede the subjective conscious intention to move14. The theory explains how activity preceding bound crossing, either input or accumulated activity, can be said to participate causally in the timing of an action, but does not uniquely specify it. The integration-to-bound theory implies that no decision has been made until the bound has been reached. Thus, assuming a threshold above the size of an individual input, more than one individual input must occur to reach a decision; no indi-vidual neuron contributing to the integrator is a unique cause.
The crossing of an arbitrary lower threshold by ramping activity13,14 may partially forecast action, but logically it cannot fully predict action, as at any moment up to bound crossing the arrival of opposing inputs may avert an action no matter how strongly it is forecasted49. In contrast, after reaching the action bound, an action is inevitable. Thus, sub-bound activity may be associated with predictive, causal activity of a qualitatively
npg
© 201
4 Nature
America, Inc.
different nature than super-bound activity, similar to a proposed distinc-tion between subconscious and conscious neural processes50. The relative delay between threshold crossing and movement initiation observed in rat M2 (around 150 ms) were consistent with the delay between human subjects’ awareness of their intention to act and movement (around 200 ms)14. It could therefore be inferred that crossing the threshold from unawareness to awareness is a reflection of bound crossing. In this way, the integration-to-bound theory may help to resolve the con-tradiction between the subjective report of free will and the requirement for causal antecedents to non-capricious, willed actions. Finally, insofar as simple voluntary actions constitute an appropriate experimental con-text, our results provide a starting point for investigating mechanisms underlying concepts such as self, will and intention to act, which might be conserved among mammalian species.
METhODS
Methods and any associated references are available in the online version of the paper.
Note: Any Supplementary Information and Source Data files are available in the
online version of the paper.
AcknowledgmentS
We thank the members of the Mainen laboratory for discussion, M. Terrelonge for assistance with recording experiments, B. Burbach and M. Vinhas for technical assistance, E. Lottem for daily discussions, and C. Feierstein, H. Shteingart, Y. Loewenstein, J. Erlich, J. Paton and B. Atallah for helpful comments on the manuscript. This work was supported by the Uehara Memorial Foundation (M.M.), Fundação Bial (127/08, M.M.), Fundação para a Ciência e a Tecnologia SFRH/ BPD/46314/2008, M.M.; SFRH/BD/33274/2007, M.I.V.; SFRH/BD/32947/2006, G.M.C.), European Research Council Advanced Investigator Grant (250334, Z.F.M.) and Champalimaud Foundation (Z.F.M.). G.M.C. was supported by Fundação para a Ciência e a Tecnologia, as part of the BEB/CNC PhD programme.
AUtHoR contRIBUtIonS
M.M. and Z.F.M. designed the experiments, analyses and models and wrote the manuscript. M.M. conducted the experiments with assistance from M.I.V. and G.M.C. M.M. analyzed the data and implemented the model.
comPetIng FInAncIAl InteReStS The authors declare no competing financial interests.
Reprints and permissions information is available online at http://www.nature.com/ reprints/index.html.
1. Uchida, N., Kepecs, A. & Mainen, Z.F. Seeing at a glance, smelling in a whiff: rapid forms of perceptual decision making. Nat. Rev. Neurosci. 7, 485–491 (2006). 2. Wang, X.J. Probabilistic decision making by slow reverberation in cortical circuits.
Neuron 36, 955–968 (2002).
3. Mazurek, M.E., Roitman, J.D., Jochen, D. & Shadlen, M.N. A role for neural integrators in perceptual decision making. Cereb. Cortex 13, 1257–1269 (2003).
4. Gold, J.I. & Shadlen, M.N. The neural basis of decision making. Annu. Rev. Neurosci. 30, 535–574 (2007).
5. Hanes, D.P. & Schall, J.D. Neural control of voluntary movement initiation. Science 274, 427 (1996).
6. Ratcliff, R., Cherian, A. & Segraves, M. A comparison of Macaque behavior and superior colliculus neuronal activity to predictions from models of two-choice decisions. J. Neurophysiol. 90, 1392–1407 (2003).
7. Roitman, J.D. & Shadlen, M.N. Response of neurons in the lateral intraparietal area during a combined visual discrimination reaction time task. J. Neurosci. 22, 9475–9489 (2002).
8. Berns, G.S., Laibson, D. & Loewenstein, G. Intertemporal choice—toward an integrative framework. Trends Cogn. Sci. 11, 482–488 (2007).
9. McGuire, J.T. & Kable, J.W. Rational temporal predictions can underlie apparent failures to delay gratification. Psychol. Rev. 120, 395–410 (2013).
10. Mischel, W., Ebbesen, E.B. & Zeiss, A.R. Cognitive and attentional mechanisms in delay of gratification. J. Pers. Soc. Psychol. 21, 204–218 (1972).
11. Cardinal, R.N., Winstanley, C.A., Robbins, T.W. & Everitt, B.J. Limbic corticostriatal systems and delayed reinforcement. Ann. NY Acad. Sci. 1021, 33–50 (2004).
12. Roesch, M.R., Calu, D.J., Burke, K.A. & Schoenbaum, G. Should I stay or should I go? Transformation of time-discounted rewards in orbitofrontal cortex and associated brain circuits. Ann. NY Acad. Sci. 1104, 21–34 (2007).
13. Deecke, L., Scheid, P. & Kornhuber, H.H. Distribution of readiness potential, pre-motion positivity and motor potential of the human cerebral cortex preceding voluntary finger movements. Exp. Brain Res. 7, 158–168 (1969).
14. Libet, B., Gleason, C.A., Wright, E.W. & Pearl, D.K. Time of conscious intention to act in relation to onset of cerebral activity (readiness-potential). Brain 106, 623–642 (1983).
15. Okano, K. & Tanji, J. Neuronal activities in the primate motor fields of the agranular frontal cortex preceding visually triggered and self-paced movement. Exp. Brain Res. 66, 155–166 (1987).
16. Romo, R. & Schultz, W. Role of primate basal ganglia and frontal cortex in the internal generation of movements. III. Neuronal activity in the supplementary motor area. Exp. Brain Res. 91, 396–407 (1992).
17. Fried, I., Mukamel, R. & Kreiman, G. Internally generated preactivation of single neurons in human medial frontal cortex predicts volition. Neuron 69, 548–562 (2011). 18. Lebedev, M.A., O’Doherty, J.E. & Nicolelis, M.A.L. Decoding of temporal intervals
from cortical ensemble activity. J. Neurophysiol. 99, 166–186 (2008). 19. Erlich, J.C., Bialek, M. & Brody, C.D. A cortical substrate for memory-guided
orienting in the rat. Neuron 72, 330–343 (2011).
20. Guo, Z.V. et al. Flow of cortical activity underlying a tactile decision in mice. Neuron 81, 179–194 (2014).
21. Sul, J.H., Jo, S., Lee, D. & Jung, M.W. Role of rodent secondary motor cortex in value-based action selection. Nat. Neurosci. 14, 1202–1208 (2011).
22. Reep, R.L., Corwin, J. & Hashimoto, A. Efferent connections of the rostral portion of medial agranular cortex in rats. Brain Res. Bull. 19, 203–221 (1987). 23. Reep, R.L. & Goodwin, G. Topographic organization in the corticocortical connections
of medial agranular cortex in rats. J. Comp. Neurol. 294, 262–280 (1990). 24. Jaramillo, S. & Zador, A.M. The auditory cortex mediates the perceptual effects of
acoustic temporal expectation. Nat. Neurosci. 14, 246–251 (2011).
25. Lauwereyns, J., Watanabe, K., Coe, B. & Hikosaka, O. A neural correlate of response bias in monkey caudate nucleus. Nature 418, 413–417 (2002).
26. Zohary, E., Shadlen, M.N. & Newsome, W.T. Correlated neuronal discharge rate and its implications for psychophysical performance. Nature 370, 140–143 (1994). 27. Maimon, G. & Assad, J.A. A cognitive signal for the proactive timing of action in
macaque LIP. Nat. Neurosci. 9, 948–955 (2006).
28. Harvey, C.D., Coen, P. & Tank, D.W. Choice-specific sequences in parietal cortex during a virtual-navigation decision task. Nature 484, 62–68 (2012).
29. Fujisawa, S., Amarasingham, A., Harrison, M.T. & Buzsáki, G. Behavior-dependent short-term assembly dynamics in the medial prefrontal cortex. Nat. Neurosci. 11, 823–833 (2008).
30. Lau, B. & Glimcher, P.W. Action and outcome encoding in the primate caudate nucleus. J. Neurosci. 27, 14502–14514 (2007).
31. Stuphorn, V., Brown, J.W. & Schall, J.D. Role of supplementary eye field in saccade initiation: executive, not direct, control. J. Neurophysiol. 103, 801–816 (2010). 32. Milosavljevic, M., Malmaud, J. & Huth, A. The drift diffusion model can account
for the accuracy and reaction time of value-based choices under high and low time pressure. Judgm. Decis. Mak. 5, 437–449 (2010).
33. Ratcliff, R. A theory of memory retrieval. Psychol. Rev. 85, 59–108 (1978). 34. Machens, C.K., Romo, R. & Brody, C.D. Flexible control of mutual inhibition: a
neural model of two-interval discrimination. Science 307, 1121–1124 (2005). 35. Renart, A. et al. The asynchronous state in cortical circuits. Science 327, 587–590
(2010).
36. Soltani, A. & Wang, X.-J. Synaptic computation underlying probabilistic inference. Nat. Neurosci. 13, 112–119 (2010).
37. Gremel, C.M. & Costa, R.M. Premotor cortex is critical for goal-directed actions. Front. Comput. Neurosci. 7, 110 (2013).
38. Gremel, C.M. & Costa, R.M. Orbitofrontal and striatal circuits dynamically encode the shift between goal-directed and habitual actions. Nat. Commun. 4, 2264 (2013). 39. Narayanan, N.S. & Laubach, M. Top-down control of motor cortex ensembles by
dorsomedial prefrontal cortex. Neuron 52, 921–931 (2006).
40. Botvinick, M.M., Cohen, J.D. & Carter, C.S. Conflict monitoring and anterior cingulate cortex: an update. Trends Cogn. Sci. 8, 539–546 (2004).
41. Brecht, M. et al. Organization of rat vibrissa motor cortex and adjacent areas according to cytoarchitectonics, microstimulation, and intracellular stimulation of identified cells. J. Comp. Neurol. 479, 360–373 (2004).
42. Neafsay, E.J. et al. The organization of the rat motor cortex: a microstimulation mapping study. Brain Res. 396, 77–96 (1986).
43. Stuesse, S.L. & Newman, D.B. Projections from the medial agranular cortex to brain stem visuomotor centers in rats. Exp. Brain Res. 80, 532–544 (1990). 44. Felsen, G. & Mainen, Z.F. Neural substrates of sensory-guided locomotor decisions
in the rat superior colliculus. Neuron 60, 137–148 (2008).
45. Lo, C.-C. & Wang, X.-J. Cortico-basal ganglia circuit mechanism for a decision threshold in reaction time tasks. Nat. Neurosci. 9, 956–963 (2006).
46. Zingg, B. et al. Neural networks of the mouse neocortex. Cell 156, 1096–1111 (2014).
47. Kepecs, A., Uchida, N., Zariwala, H.a & Mainen, Z.F. Neural correlates, computation and behavioural impact of decision confidence. Nature 455, 227–231 (2008). 48. Lak, A. et al. Orbitofrontal cortex is required for optimal waiting based on decision
confidence. Neuron (in the press).
49. Schall, J.D. Neural basis of deciding, choosing and acting. Nat. Rev. Neurosci. 2, 33–42 (2001).
50. Dehaene, S., Changeux, J.-P., Naccache, L., Sackur, J. & Sergent, C. Conscious, preconscious, and subliminal processing: a testable taxonomy. Trends Cogn. Sci. 10, 204–211 (2006).
npg
© 201
4 Nature
America, Inc.