Early Detection of Peripheral
Neuropathy in Diabetes Patients
Bárbara Maria Alves Moreira
Supervisor at FEUP: Miguel Velhote Correia, PhD Supervisor at FhP: Inês Nunes de Sousa, PhD
Mestrado Integrado em Bioengenharia
c
Faculdade de Engenharia da Universidade do Porto
Early Detection of Peripheral Neuropathy in Diabetes
Patients
Bárbara Maria Alves Moreira
Dissertação submetida para obtenção de grau de Mestre em
Bioengenharia
Chair President: João Paulo Cunha, PhD External Examiner: Dr. Miguel Oliveira, PhD Supervisor at FEUP: Miguel Correia Velhote, PhD Supervisor at FhP: Inês Nunes de Sousa, PhD
Abstract
Neuropathy is one of the most common and costly complication of diabetes, being unnoticed in 50% of the patients with this condition. Gait analysis of diabetic patients with peripheral neu-ropathy has received interest by the authors since the alteration of walking patterns is a common characteristic of this disease.
In this project, a study was made regarding the necessity to identify early signs of diabetic neuropathy by the analysis of walking patterns.
With reference on previous studies, plantar pressure sensors and smartphones built-in ac-celerometers were used to collect gait data. After data collection, features were extracted and selected from signals, which allowed the training of a classifiers to learn, based on these metrics, how to differentiate the different groups of interest. In order to evaluate differences in terms of performance, two classifiers were tested - k-Nearest Neighbours and Support Vector Machine.
Two datasets were analysed - dataset 1 and dataset 2. Ideally, it would be necessary use both accelerometers and plantar pressure sensors to collect data from healthy subjects, diabetic patients without peripheral neuropahty, and diabetic patients with peripheral neuropathy. However, none of the analysed datasets met all these desirable requirements.
In dataset 1, features were extracted only from plantar pressure sensors and two tests were performed - conditioned and free tests. The more accurate results were obtained when the subject walked freely, without the examination of any physician/doctor. Additionally, the best perfor-mances achieved, in dataset 1, to identify the presence of diabetes and neuropathy were 80.50% and 90% , respectively.
In dataset 2, data was collected with both accelerometers and plantar pressure sensor. How-ever, none of the diabetes patients were diagnosed with neuropathy. As a results, the diabetes patients were split based on disease durations - lower ans higher than 20 years. This division was chosen since the prevalence of neuropathy increases with the duration of diabetes. Hereupon, it is expected that the results obtained from this division are similar to the ones encountered if the presence of neuropathy was tested. Moreover, in dataset 2, the best accuracy of classifications was 96% for both classification (identify the presence of diabetes and differentiate disease duration).
The performances obtained, in dataset 2, were higher than in dataset 1, suggesting that the both use of plantar pressure sensors and accelerometer data is important to characterize the gait of diabetes and identify the presence of diabetic neuropathy. However, the dimension of dataset 2 was small. Consequently, additional validation on a larger number of subjects is need.
ii
Finally, statistical analysis suggested that diabetes and the increased disease duration could lead to a non-gradual and imbalance plantar pressure distribution.
Keywords:Diabetes, Diabetic Neuropathy, Plantar Pressure Sensors, Accelerometer Data, Machine Learning
Resumo
A neuropatia é uma das condições mais comum e dispendiosa da diabetes, passando despercebida em cerca de 50% dos pacientes com esta condição. A análise da marcha de pacientes diabéticos com neuropatia tem despoletado bastante interesse uma vez que, normalmente, esta doença leva à alteração dos padrões de marcha.
Neste projecto, for realizado um estudo sobre a necessidade de identificar sinais relacionados com a neuropatia diabética, através da análise de padrões de marcha.
Com referência em estudos anteriores, foram utilizados sensores de pressão plantar e aceleromet-ros para recolher dados de marcha de individuos saudáveis e diabéticos. Seguidamente, foram extraídas e seleccionadas características específicas, o que permitiu a utilização de classificadores que, com bases nestas métricas, diferenciaram diferentes grupos de interesse. Com o objectivo de avaliar e comparar a performance de diferentes classificadores, dois classificadores foram aplica-dos - k-Nearest Neighbours and Support Vector Machine.
Para estes efeitos, foram avaliadas duas bases de dados, Base de Dados 1 e Base de Dados 2. Idealmente, os dados constituintes das duas base de dados deveriam englobar a recolha de sinais de marcha a individuos saudáveis e diabéticos - com e sem neuropatia -, recorrendo a sensores de pressão plantar e acelerómetros. No entanto, nenhuma das bases de dados analisadas cumpriu todos estes requisitos.
Na Base de Dados 1, os dados foram recolhidos apenas recorrendo a sensores de pressão plantares e em duas situações diferentes de marcha: teste condicionado e teste livre. Os resultados mais precisos foram obtidos aquando do teste livre, onde o participante realizava uma marcha livre de examinação de um médico e sem uma rota definida. O melhor desempenho obtido pelos classificadores na identificação de presença de diabetes e identificação da presença de diabetes e neuropatia foi de 80, 50% e 90%, respetivamente.
Na Base de Dados 2, os dados foram recolhidos através de sensores de pressão plantar e acelerómetros. No entanto, nenhum individuo com diabetes e cujo padrão de marcha foi recolhido, padecia diabetes neuropatia. Para ultrapassar esta limitação, os dados foram subdivididos tendo como base a duração da doença - inferior e superior a 20 anos. Este processamento de dados foi escolhida uma vez que a prevalência da neuropatia aumenta com a duração da diabetes. Assim sendo, é esperado que os resultados obtidos com esta divisão sejam semelhantes aos que seriam encontrados se a indentificação de estados de neuropatia tivesse sido avaliada. Com os sinais de marcha desta base de dados, o melhor desempenho obtido pelos classificadores na identificação da presença de diabetes e na diferenciação da duração da doença foi de 96%, para ambas as classificações.
Os desempenhos obtidos na Base de Dados 2 foram superiores, sugerindo que o uso com-binado de sensores de pressão plantar e acelerómeteros é importante para caracterizar a marcha de diabéticos e identificar a presença da neuropatia. No entanto, é importante mencionar que a
iv
dimensão da Base de Dados 2 foi inferior à da Base de Dados 1. Consequentemente, é necessária uma validação destes resultados com uma base de dados de igual ou maior dimensão que a 2.
Finalmente, a análise estatística sugeriu que tanto a diabetes como o aumento da duração da doença pode causar não só uma distribuição nao gradual das pressões plantares, mas também um desiquilíbrio nessa mesma distribuição.
Keywords: Diabetes. Neuropatia. Sensores de pressão plantar. Acelerómetros. Machine Learning.
Acknowledgments
I would like to express my gratitude:
To my supervisor at FEUP, Miguel Velhote Correia, for his help and recommendations during the development of this dissertation.
To Inês Sousa, my supervisor at Fraunhofer AICOS, for all the suggestions, discussions, and to share some of her knowledge and experience.
To Dr. Miguel Oliveira for share his dataset and to all the participants in the dataset collection, that kindly contributed to this project.
To Joana Costa for dealing with my moments of insanity.
To Inês for all the support and for never gave up, even when I no longer believed. Thank you for knowing me so well.
Finally, to my family who always supported me, I am sure that without them I would not be the person I am today.
Bárbara Moreira
"The important thing is to never stop questioning”
Albert Einstein
Contents
List of Figures xii
List of Tables xiii
List of Abbreviations xv
1 Introduction 1
1.1 Motivation and Objectives . . . 1
1.2 Structure of the Dissertation . . . 2
2 Literature Review 3 2.1 Diabetic Peripheral Neuropathy . . . 3
2.1.1 Alterations associated with DPN . . . 7
3 Methodology 13 3.1 Machine Learning Technology . . . 13
3.2 Data acquisition . . . 14
3.2.1 Inertial Sensors . . . 14
3.2.2 Plantar Pressure Sensors . . . 15
3.3 Preprocessing Techniques . . . 17 3.4 Feature Extraction . . . 18 3.5 Feature selection . . . 19 3.6 Classification . . . 20 4 Preliminary Tests 23 4.1 Methodology . . . 23 4.1.1 Data Acquisition . . . 23 4.1.2 Feature Extraction . . . 24
4.2 Results and Discussion . . . 25
4.2.1 Preprocessing Results . . . 25
4.2.2 Discriminate Walking Speeds . . . 29
4.2.3 Discriminate Walking Environments . . . 31
4.3 Summary and Conclusions . . . 32
5 Implementation 33 5.1 Methodology . . . 33 5.1.1 Data Acquisition . . . 33 5.1.2 Feature Extraction . . . 37 5.2 Summary . . . 39 ix
x CONTENTS
6 Results and Discussion 41
6.1 Dataset 1 . . . 41
6.2 Dataset 2 . . . 46
7 Conclusions and Future Work 51
7.1 Future work . . . 52
Bibliography 55
List of Figures
2.1 DPN causes pain or loss of feeling in toes, feet, legs, hands, and arms . . . 4
2.2 Effect of disease duration (left) and age (right) on prevalence of diabetic neuropathy. 5
3.1 Schematic representation of a machine learning process . . . 14
3.2 WalkinSense Device . . . 16
3.3 Coordinate system (relative to a device) that’s used by the Android Sensor API. . 17
3.4 10-fold cross validation . . . 21
3.5 Support vector machine example . . . 22
4.1 Multiresolution wavelet decomposition of level 4 . . . 25
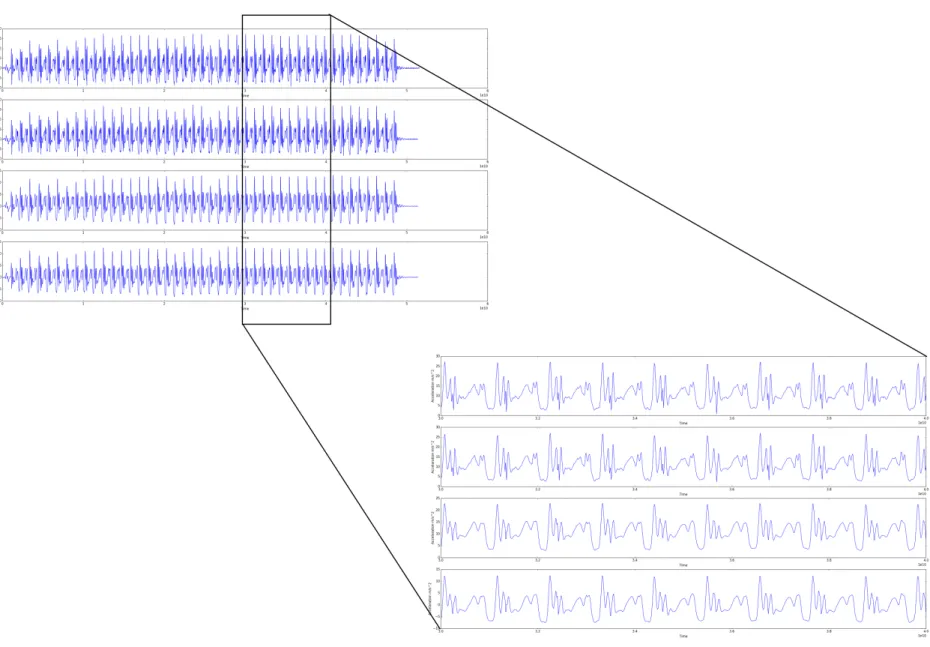
4.2 Preprocessing results. First Graphic - raw data; Second graphic - After
Linearization; Third graphic After the application of smooth algorithm; Fourth graphic -After ran the signal through the high pass filter. . . 28
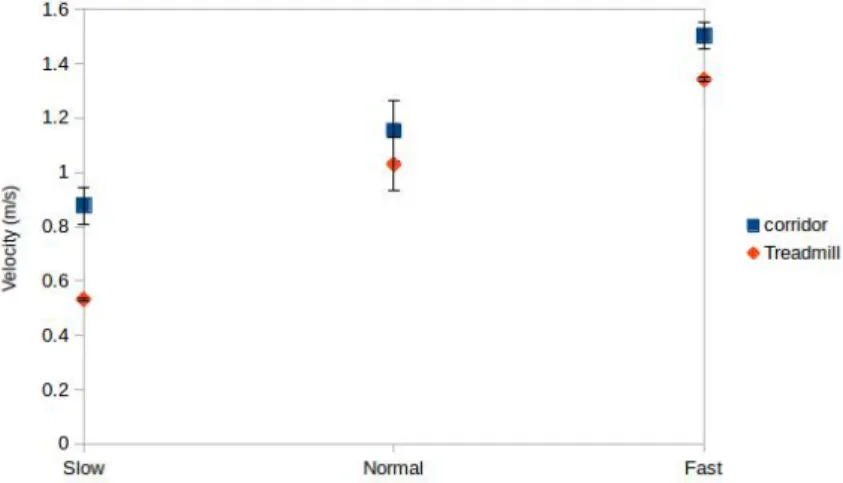
4.3 Average of the velocities and standard deviations in the three walking speeds for
the two tested environments (corridor and treadmill) . . . 29
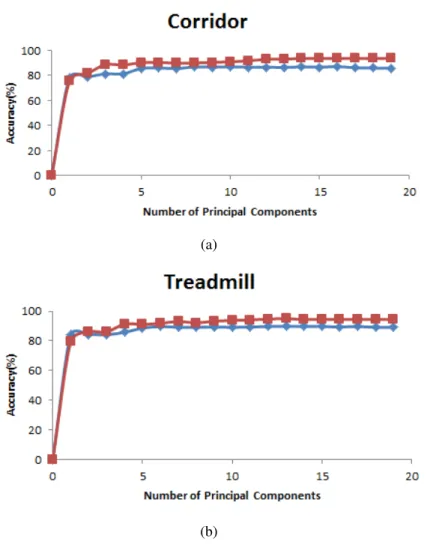
4.4 Accuracy of the classifiers - SVM (blue line) and kNN (red line) - discriminating
walking speeds on corridor (a) and on treadmill (b) versus the number of principal
components used for classification . . . 30
4.5 Accuracy of the classifiers - SVM (blue line) and kNN (red line) -
discriminat-ing walkdiscriminat-ing environments versus the number of principal components used for classification. . . 31
4.6 Accuracy of the classifiers - SVM (blue line) and kNN (red line) - discriminating
walking environments versus the number of features selected by FS algorithm used for classification. . . 32
5.1 Evaluation of the presence of peripheral neuropathy through the Nylon
monofila-ment 10gr from Bailey. . . 35
5.2 Placement of the Walkinsense device on the anterior side of the leg (a) and
place-ment of the eight Walkinsense sensors beneath the flat insole (b) . . . 36
5.3 Illustration of a gait cycle . . . 38 6.1 Placement of the sensors with significantly different activation time (a) and plantar
pressures (b) in healthy subjects and diabetes patients from dataset 1 . . . 44
6.2 Placement of the sensors with significantly different activation time comparing
DPN and NDPN patients from dataset 1 . . . 45
6.3 Accelerometer data divide into gait cycle. Red and green lines represent the initial and final time of each step, respectively. . . 46 6.4 Placement of the sensors with significantly different activation time (a) and plantar
pressures (b) in healthy subjects and diabetes patients from dataset 2 . . . 48
xii LIST OF FIGURES
6.5 Placement of the sensors with significantly different activation time (a) and plantar pressures (b) in diabetes patients with disease duration lower and higher than 20 years from dataset 2 . . . 49
List of Tables
3.1 WalkinSense System Characteristics . . . 16
4.1 Experimental Protocol . . . 24
4.2 Time-domain features . . . 27
4.3 Frequency-domain features . . . 27
4.4 Best classification results discriminating walking speeds . . . 29
5.1 Exclusion criteria implemented in the collection of dataset 1 . . . 34
5.2 Features extracted the from database1. . . 37
5.3 Walkinsense features extracted from dataset 2 . . . 39
6.1 Clinical details of the subjects and machine learning results for the database 1 when performing the conditioned test . . . 41
6.2 Clinical details of the subjects and machine learning results for the database 1 when performing the free test . . . 42
6.3 Selected features to distinguished healthy subjects and diabetes patients in condi-tioned test . . . 44
6.4 Selected features to distinguished healthy subjects and diabetes patients in free test 44 6.5 Selected features to distinguished patients with and without neuropathy in condi-tioned test . . . 45
6.6 Selected features to distinguished patients with and without neuropathy in free test 45 6.7 Clinical details of the subjects and machine learning results for the database 2 . . 48
6.8 Features selected to distinguished healthy subjects and diabetes patients . . . 48
6.9 Selected features to distinguished disease duration < 20 years and disease duration > 20 years . . . 49
A.1 Feature with significant differences extracted from dataset 1 in free test . . . 59
A.2 Feature with significant differences comparing healthy subjects and diabetes pa-tients. Features extracted from dataset 2 . . . 60
A.3 Feature with significant differences comparing different disease duration in dia-betes patients. Features extracted from dataset 2 . . . 60
List of Abbreviations
WHO World Healthy Organization
DPN Diabetic Peripheral Neuropathy
T2DM Type 2 of Diabetes Mellitus
T1DM Type 1 of Diabetes Mellitus
UKPDS UK Prospective Diabetes Study
EDIC Epidemiology od Diabetes Intervation and Complications
DCCT Diabetes Control and Complications Trial
DN4 Douleur neuropathique 4 questions
NDPN Diabetes without peripheral neuropathy
ML Machine Learning
MRA Multiresolution analysis
PCA Principal Components analysis
FS Forward Selection
kNN k-nearest neighbours
SVM Support Vector Machine
OSH Optimal separating hyperplane
TP True Peaks
Chapter 1
Introduction
Analysis of human gait begun in the 19th century, being at the present time subject of many
re-search projects [1]. This type of analysis has been centered on achieving quantitative objective measurement of different parameters that characterize gait in order to apply them to various fields such as identification of people for security purposes and medicine [1].
In the medical field, accurate reliable knowledge of gait characteristics at a given time, and even more importantly, monitoring and evaluating them over time, will enable early diagnosis of diseases, prevention of their complication and help to find the best treatment [1]. Therefore, gait analysis has special interest when searching for decisive information on the evolution of different diseases, namely [1]:
• Neurological diseases such as multiple sclerosis or Parkinson’s • Systemic diseases such as cardiopathies
• Alterations in deambulation dynamic due to sequelae from stroke
• Diseases caused by ageing, which affect a large percentage of the population • Diabetes
This first chapter will focus on the main motivations and objectives for the development of this thesis as well as summarizes the main steps of this study. A structure of the dissertation is also presented.
1.1
Motivation and Objectives
Neuropathy is a common and costly complication of diabetes, being the leading cause of non-traumatic limb amputations [2]. There is increasing evidence that even pre-diabetic conditions are also associated with some forms of neuropathy.
In some cases, diabetic neuropathy may be unnoticed, since up to 50% of the patients with this condition have no symptoms [3]. Therefore, the motivation behind this project is the identification of early signs that allow the discrimination of diabetic neuropathy stages.
2 Introduction
Several studies have analysed gait characteristics of diabetic neuropathy patients, suggesting that this disease significantly alters the walking patterns of the patients.
The aim of this work was to devise a methodology able to identify the presence of diabetic neu-ropathy through gait analysis. The data was collected using smartphones built-in accelerometers and plantar pressure sensors (Walkinsense system).
Initially, preliminary tests were performed in order to evaluate the methodology and the best experimental protocol to achieve the aim of this study.
Afterwards, two datasets were tested:
• Dataset 1 - collected by Oliveira and Correia in the study "Evaluation Gait Cycle and Plantar pressure in Diabetic Patients with Walkinsense" [4].
• Dataset 2 - collect at Fraunhofer AICOS installations, with elderly volunteers.
After data acquisition, the data was processed and a machine learning methodology was ap-plied in order to identify gait patterns. Additionally, it was studied suitable features and classifiers with the highest performance.
1.2
Structure of the Dissertation
Apart from this Introduction, this dissertation consists of six chapters. Chapter 2 is a literature review focused on the diabetic peripheral neuropathy and the alterations associated with this dis-ease. In chapter 3, the devices and methodology implemented are present. In Chapter 4, prelimi-nary tests are described and evaluated. In Chapter 5, the implemented methodology is described, in detail, and its results and discussion are presented in Chapter 6. Finally, in the last Chapter, the major conclusions are summarized and some future work are also summed up.
Chapter 2
Literature Review
This chapter describes the literature review related with the diabetic neuropathy (section 2.1), focusing on the problems associated with this disease and the main alterations suffered by its patients (subsection 2.1.1) - gait and plantar pressures alterations.
2.1
Diabetic Peripheral Neuropathy
Diabetes is a metabolic disorder primarily characterized by elevated blood glucose levels and by microvascular and cardiovascular complications. It is also associated with several neuromuscu-loskeletal impairments, physical disability and lower health-related quality of life. World Health Organization (WHO) estimates that 347 million people worldwide have diabetes and more than 80% of live in low-and middle-income countries [5]. In 2012, an estimated 1.5 million deaths were directly caused by this disease and WHO also projects that diabetes will be the 7th leading cause death in 2030 [5]. Moreover, in 2012 the economic cost of diabetes in the United States was estimated to be $245 billion (109), of which $176 billion were direct medical costs, being diabetes a major cause of cardiovascular morbidity and mortality [6]. Additionally, in Portugal, the Annual Report of the National Diabetes Centre - "Diabetes: Facts and Numbers" [7] - estimated that in 2013 the prevalence of diabetes in the Portuguese population aged between 20 and 79 years (7.8 million individuals) was 13.0%, i.e, more than 1 million Portuguese in this age have diabetes [7]. Comparing this values with the results from 2009, where the diabetes prevalence was 11.7%, it can be seen an increase of 1.3 percentage points in the rate of diabetes in Portugal between 2009 and 2013 [7]. Recent advances in knowledge, therapies, and technology have enhanced the ability to help patients with diabetes. However, the patients still experience several health problems, putting them at risk for the development of acute and chronic complications [6]. Much of the disability and cost associated with diabetes are related to the care of chronic complications [6].
Incidence of diabetes and the longer life expectancy of the diabetes patients result in increase prevalence and clinical importance of musculoskeletal alterations. Connective tissue disorders, neuropathy, vasculopathy or combinations of these problems may cause these musculoskeletal
4 Literature Review
alterations [8], being diabetic neuropathy, among the others, one of the most accused and investi-gated problems in the pathogenesis of musculoskeletal alterations associated with diabetes [6].
Diabetic neuropathy is a common complication and greatest source of morbidity and mortality in diabetes patients. The term diabetic neuropathy includes a spectrum of clinical syndromes with differing anatomic distributions, clinical courses, and underlying pathogenic mechanisms [6]. Each clinical syndrome is characterized by diffuse or focal damage to peripheral somatic or autonomic nerve fibers resulting from hyperglycemia. Diabetic neuropathy is typically divided into diabetic peripheral neuropathy (DPN) and autonomic neuropathy. DPN has been defined as the presence of symptoms and/or signs of peripheral nerve dysfunction after the exclusion of other causes (i.e., traumatic, compressive, neoplastic, or other systemic illnesses) [6]. DPN causes pain or loss of feeling in the toes, feet, legs, hands and arms (figure 2.1) and may cause muscle weakness and loss of reflexes, especially at the ankle, resulting in compensatory walking mechanisms, leading to foot deformities, such as hammertoes and the collapse of the midfoot [9]. Additionally, blisters and sores may appear on numb areas of the foot because pressure or injury goes unnoticed. If an ulceration occurs and is not treated promptly, the infection may spread to the bone, and the foot may then have to be amputated. Many amputations are preventable if minor problems are diagnosed and treated in time [9].
Figure 2.1: DPN causes pain or loss of feeling in toes, feet, legs, hands, and arms [9]
In practice, the diagnosis of painful DPN is a clinical one, which relies on the patients de-scription of pain. The symptoms are distal, symmetrical, often associated with nocturnal exarcer-bations, and commonly described as prickling, deep aching, sharp, like an electrical shock, and
2.1 Diabetic Peripheral Neuropathy 5
burning with hyperalgesia and frequently allodyna upon examination [10]. The symptoms are usually associated with the clinical signs of peripheral neuropathy, although occasionally in acute painful DPN, the symptoms may occur in the absence of signs [10].
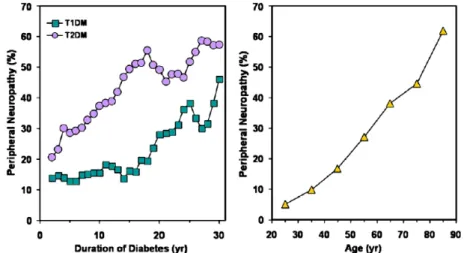
The prevalence of diabetic neuropathy in newly diagnosed patients with diabetes is estimated to be 8% and greater than 50% in patients with long-standing disease [6]. However, it is impossi-ble to accurately approximate the true prevalence of diabetic neuropathy, because the criteria for diagnosis vary, epidemiologic studies are limited to patients receiving medical care, and diabetes remains undiagnosed in a large population of diabetes patients. Notwithstanding, several stud-ies have shown that the prevalence of DPN increases with age and disease duration, and tends to be more common in patients with type 2 of diabetes mellitus (T2DM) than in those with type 1 (T1DM) [11]. The prevalence of DPN as a function of disease duration is illustrated in figure 2.2. This figure is from an cross-sectional study of 6487 patients (˜37 % with T1DM), and shows that the prevalence of DPN was significantly higher in patients with T2DM (32.1%) than in T1DM patients (22.7%, P<0.01), and there was a significantly higher correlation between age and preva-lence of neuropathy in both T1DM and T2DM [11] [2]. Rochester Diabetic Neuropathy Study [12] also reported that 54% of patients with T1DM with average disease duration of 14.5 years has DPN, while 45% of T2DM patients with average disease duration of 8.1 years present DPN. Moreover, Caselli et al. evaluated diabetic patients with different degrees of peripheral neuropathy. They have shown that the groups with moderate or severe neuropathy had a significantly longer duration of diasese (P<0.001) [13].
Figure 2.2: Effect of disease duration (left) and age (right) on prevalence of diabetic neuropathy. Adapted from [2]
Additional studies have shown that smoking, dyslipidemia, and hypertension increase an in-dividual’s risk of developing diabetic neuropathy. Therefore, the high prevalence of diabetic neu-ropathy results in significant morbidity, including and increased risk of recurrent lower-extremity infection, ulcerations, foot and ankle fractures and lower-limb amputations [6]. As a result, the frightening statistic that diabetic neuropathy is implicated in 50-75% of nontraumatic amputations is merely an exclamation point in the overall impact [14].
6 Literature Review
Improved glycemic control has been shown to improve nerve function in patients with dia-betes. Intensive glycemic control has also been suggested to reduce the risk of developing diabetic neuropathy in T1DM patiens. However, the evidence for glycemic control and the prevention of neuropathy T2DM patients is not as strong [6]. The UK Prospective Diabetes Study (UKPDS) reported a 25% risk reduction in microvascular complications after 10 years of intensive treat-ment. However, most of the risk reduction was due by the reduction in retinopathy [15]. Some studies have shown a slowing of the progression of diabetic neuropathy with improved glycemic control in patients with type 2 diabetes. Thereby, intensive glycemic control, particularly in early stages of the disease, seems to provide a long-term benefit for the prevention of diabetic neu-ropathy [6] [16]. The Epidemiology of Diabetes Intervention and Complications (EDIC) study followed approximately 95% of the subjects enrolled in the Diabetes Control and Complications Trial (DCCT) cohort for several years [16]. One of the main goals of this study was to describe the development and progression of cardiovascular (coronary, peripheral vasculopathy, and cerebral) T1DM [16]. Additionally, another objective was to examine the long-term effects of differences in prior diabetes treatment (conventional versus intensive therapy) during the DCCT on the subse-quent development and progression of diabetes complication and cardiovascular disease in T1DM. During the EDIC trial, the glycemic separation between the intensively treated group and the stan-dard treatment group disappeared. Patients with previous intensive treatment of their T1DM had a decrease in the prevalence of neuropathy that persisted through the EDIC follow-up despite deterioration of their glycemic control [16].
Several questionnaires have been developed to assist clinicians in the diagnosis of DPN. The douleur neuropathique 4 questions (DN4) questionnaire can be completed rapidly and is easy to use, with reported good specificity (83%) and sensitivity (90%) [17]. There are several simple clinical tests that should be used to screen patients for DPN. The combined use of appropriate tools and clinical examination has been shown to provide greater than 87% specificity in the detection of DPN [16]. The most frequently used instrument for detecting neuropathy is the nylon Semmes-Weinstein monofilament [18]. Inability to perceive the 10g of force a 5.07 monofilament applies is associated with clinically significant large-fiber neuropathy [18]. In some prospective studies, the Semmes-Weinstein monofilament identified persons at increased risk of foot ulceration with a sensitivity of 66% to 91%, a specificity of 34% to 86%, a positive predictive value of 18% to 39%, and a negative predictive value of 94% to 95% [19] [20] [21]. However, the accuracy of the monofilament depends on the number of tested points of the feet [18].
Social and economic repercussions due to high morbidity, premature deaths, work disability and high treatment expenses have increased the concern about diabetes – included health prob-lems in the population. In order to decrease the morbidity of patients with diabetes, international guidelines and consensus documents emphasize the need for educating the patients and health care providers against foot ulcers, amputations, and falls. It has been shown that an intensified prevention strategy including patient education, foot care and footwear is cost-saving [8].
Current understanding of the pathophysiology is complicated and incomplete, but basic ex-perimental research is on the threshold of producing the first disease-modifying therapies. The
2.1 Diabetic Peripheral Neuropathy 7
available treatments consist in an array of drugs and are modestly to moderately effective in re-lieving symptoms but are limited by adverse effects and drug interactions [14].
One of the biggest problems of DPN is that 50% of patients have no symptoms and are only diagnosed by careful, regular and thorough clinical examination [3]. Therefore, in early stages this condition may be unnoticed. Hereupon, it is important to identify parameters that allow dis-criminating early peripheral neuropathy stages in order to take protective measures to prevent feet injuries, and improve the diagnosis, treatment, and follow-up of DPN patients.
2.1.1 Alterations associated with DPN
2.1.1.1 Gait Alterations
DPN usually starts with sensory nerve damage and progresses with the motor involvement, muscle atrophy and physical dysfunction. Significant deficits in vibration sense, tactile sensitivity, propri-oception and kinesthesia, all leading to postural instability and uncoordinated gait, increases the risk of foot ulcers and falling [8].
Computerized gait analysis has been used to objectively quantify changes in the biomechanics of walking. Thus, it can be used to objectively study musculoskeletal mechanisms and strategies, developed to compensate for some pathological conditions of human body. Identification of the movement adaptations and possible associated clinical parameters might help prevention and di-agnosis of future risks of ulcer development and falls of diabetic patients [8]. Therefore, the main goal of oriented rehabilitation programs for diabetic patients is to prevent postural instability, gait deviations, falls and/or foot ulcerations through exercises to maintaining muscle strength, balance and coordination [8].
Gait analysis of DPN patients has received an increasing interest. Patients with diabetes, and peripheral neuropathy have a high incidence of injuries during walking and a low level of perceived safety [22]. Various authors have found an association between neuropathy and gait abnormalities and/or falls. Cavanagh et al. [23], for example, demonstrated that peripheral neuropathy affects gait and posture. They reported that subjects in a group of patients with DPN were 15 times more likely to report an injury (fall, fracture, sprained ankle, or cuts and bruises) during walking or standing than subjects in a control group of patients with diabetes but no peripheral neuropathy (NDPN) [23]. They stated that peripheral neuropathy, rather than ocular changes are responsi-ble for gait proresponsi-blems and conclude that neuropathy could well represent the mechanism for gait abnormalities and increased risk of falls [23]. Moreover, Katoulis et al. [24] have demonstrated that diabetic subjects with peripheral neuropathy show alterations in some gait parameters during walking. These alterations could facilitate foot injuries, thus contributing to frequent foot ulcer-ation [24]. In addition, some studies suggested that DPN is a risk factor for developing plantar ulcers once most of these ulcers are thought to develop during walking [22].
Although, several studies have suggested that altered gait patterns of diabetic persons are largely related to peripheral neuropathy [23] [24], similar aberrations have been detected in di-abetic patients free of clinically significant neuropathies [8]. Yavuzer et al. [8] have shown that
8 Literature Review
NDPN patients had significant gait deviations, such as slower gait, shorter steps, limited knee and ankle mobility than normal control group. However, these gait abnormalities were not found in DPN patients, suggesting that neuropathy may be not the only reason for gait deviations of diabetic patients [8]. Furthermore, Yavuzer et al. [8] have presented that walking velocity and step length of NDPN group were less than DPN patients, and control group, supporting previous findings that the decrease in walking speed in patients with diabetes may be a compensatory strategy adopted to improve stability or to maintain balance rather than direct result of neuropathy [8]. Petrofsky et al. [25] also found gait impairments in NDPN patients. These authors emphasized that whatever the mechanisms, diabetic patients develop gait alterations well before the appearance of peripheral neuropathy, suggesting that in diabetic patients free of peripheral neuropathy, it may be a loss of motor control that causes diabetic ulcers [25].
This apparent contradiction between authors underscores the need for further research in order to understand the role of DPN in gait abnormalities and the increased risk of falls in diabetic patients.
In most existing studies authors assessed gait indoor, i.e. in specialized gait laboratories or on a flat indoor surface. Few authors have attempted to evaluate gait under various conditions such as irregular surfaces, a poorly lit pathway or an obstacle course since gait analysis performed indoors, on a predefined, clean and essentially flat, specific pathway is not representative of a real life situ-ation [26] [27]. For this reason, Allet et al. [26] considered that gait analysis should be performed in a real life environment to correctly understand what makes individuals fall. Thus, they analyzed gait parameters in diabetic patients and investigated the surface effect on their walking pattern compared to healthy controls. Diabetic patients with and those without neuropathy, adjusted to the variety of different surfaces using identical strategies. These strategies were similar to those used by healthy controls. In general, the surface altered significantly all gait parameters. This study identified gait abnormalities in both diabetic patient groups (with and without neuropathy) and the deterioration of gait parameters increases with disease severity (neuropathy). Patients with neuropathy have more difficulty adapting their gait to irregular surfaces when compared to those without neuropathy, or healthy controls [26]. However, they have shown that some of the gait parameters of the diabetes patients are already significantly altered before neuropathy is clinically detected [26]. Although Allet et al. [26]
Richardson et al. [27] identified differences in gait based on fall history among a group of older subjects with peripheral neuropathy in 2 environments: standard and challenging. The analysis of gait in the challenging environment effectively identified gait characteristics associated with falls in an older population with DPN, whereas analysis of gait in the standard environment did not [27]. Therefore, peripheral neuropathy-associated gait dysfunction is more sensitively detected on an irregular rather than on a flat surface [27]. Additionally, Menz et al. [28] have shown that DPN participants had reduced walking speed, cadence, and step length, and less rhythmic acceleration patterns at the head and pelvis compared with controls. These differences were particularly evident when participants walked on the irregular surface [28]. Participants with DPN also presented impaired peripheral sensation, reaction time, and balance [28].
2.1 Diabetic Peripheral Neuropathy 9
Gaining insight into gait pattern alterations that occur in NDPN individuals is essential for developing strategies to effectively prevent mobility impairment in early diabetes stages[29]. Ko et al. [29] compared gait parameters from the fast-walking (walking as fast as possible) and usual walking (like “walking in the street”) between participants with and without T2DM. This study have shown that during fast-walking all gait pattern differences, e.g. shorter stride length, indi-cate that persons with diabetes tend to have a less efficient gait pattern with higher intensity effort than during usual walking [29]. It is noteworthy that these inefficiencies are present in persons in relatively early stages of diabetes who have not yet developed the full range of diabetes compli-cations. It would appear that fast-walking task, which places greater demand on motor control, is an important adjuvant to better differentiate gait performance in generally healthy older persons in the early stages of potentially debilitating conditions such as diabetes [29].
Some studies suggested that gait analysis during turns provides a much more sensitive analysis of the early onset of gait abnormalities [25]. This is due to the inability of the body to compensate for rapidly changing gravity vectors if any vestibular or sensory pathology is present. As such, falls do not usually occur during walking in a linear path but rather in turns. Thus, Petrofsky et al. [25] performed one of the first studies that analyzed the gait of subjects with diabetes making turns. This study have shown that diabetes patients walked significantly slower and used more steps to complete the linear walk compared to control. These characteristics were seen when the subjects do not performed turns, however, during turns, gait was even slower and the steps wider [25]. In addition, velocity of the turns in subjects with diabetes was about half the velocity when compared to control subjects. Stride was much wider in the subjects with diabetes than in control subjects [25].
Some studies have indicated that even with mild or none neuropathy, diabetic patients with poor glycemic control have similar gait deviations increasing the risk of falling and foot ulcers [8], suggesting that glycemic control improves motor control in diabetic patients.
2.1.1.2 Plantar Pressures Alterations
The presence of foot ulcers in the clinical history of a diabetic subject is a sign of worsening neuropathy [30]. This happens because the development of ulceration is considered the probable result of progressive neurological, vascular, and autonomic damage. These events only prove the progression of the disease over time [30].
The research literature has reported the existence of a strong association between diabetic neuropathy and higher plantar loads that may be responsible for foot ulceration and re-ulceration. One of the first studies on plantar pressure in diabetic patients was published by Stokes et al in 1975 [31]. They noted not only that patients with present ulcer had the highest maximum load, but when compared with normal subjects, a lateral shift in pressure (an increased pressure in 4th and 5th metatarsal heads) was observed [31]. Since then, many studies confirmed a high plantar pressure as a principal factor in the development and non-healing of plantar ulcers in diabetic patients [32]. However, some authors have not found elevated peak pressures for all ulcerated patients [33]. Hereupon, the coexistence of increased peak pressure and the pathogenesis of ulcer
10 Literature Review
formation are considered speculative at best. Although re-ulceration is common in patients with diabetic neuropathy even with adequate footwear use, the differences in the distribution patterns of plantar pressure following a completely healed ulcer and its relationship with ulceration recurrence after one year of resolution is still unknown [34].
An ideal approach to study the biomechanical effects of diabetic neuropathy in ulcer develop-ment would be a long-term longitudinal study to analyze plantar pressure distribution during gait before and after the ulcer formation. A short-term option is a comparison study of two different groups of neuropathic patients at different stages of the neuropathy to address deficits in sensitiv-ity and previous history of ulceration in order to predict the incidence of re-ulceration under high plantar pressures [34]. Based on this, Bacarin et al. [34] investigated and compared the influence of previous history of foot ulcers on plantar pressure variables during gait. This study has shown that neuropathic groups, both non-ulcerated and ulcerated, presented alterations in plantar pres-sure distribution patterns, and the ulcerated patients presented higher loads than non-ulcerated. The history of foot ulcers in the clinical history of the diabetic neuropathy subjects influenced plantar pressure distribution, resulting in an increased load under the midfoot and rearfoot and an increase in the variability of plantar pressure during barefoot gait [34]. In addition, Boulton et al. [35] have shown that all patients with diabetic neuropathy and an history of ulcers had abnormally high pressures at the previous site of ulcers, compared with only 31% of feet with no evidence of ulceration, supporting the theory that the long-term effects of peripheral neuropathy, with loss of pain sensation and proprioception and weakness of the intrinsic muscle of the foot, have been said to alter the weight distribution under the foot, leading to increase loading under the metatarsal heads. In other words, they suggested that foot pressure abnormalities might represent an early marker of DPN [35]. Shaw et al. showed that vertical forces through the heel during walking were increased in diabetic neuropathy and they suggested that this might explain increased plantar heel pressures and contribute to the risk of foot ulceration [36].
Information in the field of plantar pressure distribution in T2DM without any complication and with short duration of the diabetes was limited [30]. Therefore, Pataky et al. [30] quanti-fied the abnormalities and distribution of both plantar pressure and its duration in T2DM patients without complications during normal walking and compared with healthy subjects. Their results demonstrated plantar pressure abnormalities in diabetic patients without complications, suggest-ing that abnormalities appear before loss of sensation, as an early sign of diabetic neuropathy [30]. They have shown that the more the plantar surface is reduced, the more the foot-floor con-tact is prolonged at each step. This could contribute to ulceration in the neuropathic where the contact plantar surface may be even more reduced as a result of additional neurological or vas-cular pathology [30]. In short, they conclude that plantar pressure elevation, together with the prolonged duration of the foot–floor contact time may be an early sign of neuropathy once these abnormalities were detected even in diabetic patients without complications [30].
The mechanisms by which the peripheral diabetic neuropathy causes plantar pressure elevation are well described [30]. One relates to altered proprioception with an imbalance between the long flexors and extensors of the toes, which, in its advanced form, give rise to the claw toes and
2.1 Diabetic Peripheral Neuropathy 11
prominent metatarsal heads. Clawing of the toes is accompanied by anterior displacement of the submetatarsal head fat pads. These structural changes lead to increased supinatory moments in neuropathic feet with an increased pressure under 4th and 5th metatarsal heads. Such changes in plantar pressure may occur before clinically evident peripheral neuropathy [30].
The tendency to plantar pressure displacement has been reported by Caselli et al. [13]. They evaluated both the relationship between forefoot and rearfoot plantar pressures in diabetic pa-tients with different degrees of peripheral neuropathy and their role in ulcer development [13]. They observed that both rearfoot and forefoot pressures were increased in diabetic neuropathic foot, whereas the forefoot-to-rearfoot plantar pressure ratio increased only in severe diabetic neu-ropathy, indicating an imbalance in pressure distribution with increasing degrees of neuropathy. However, they did not evaluate non-diabetic controls [13].
In summary, several studies have shown that high plantar foot pressures in diabetic patients are strongly predictive of subsequent plantar ulceration, especially in the presence of neuropathy. Moreover, Pataky et al. [30] also suggested that prolonged duration of foot-floor contact duration may be an early sign of diabetic neuropathy [30] and should also be taken in consideration.
Chapter 3
Methodology
This section presents the technological concepts and devices used to achieve the goals of this study.
3.1
Machine Learning Technology
A major problem in bioinformatics analysis or medical science is to attain the correct diagnosis of certain important information. For the ultimate diagnosis, generally many tests are done that involve clustering or classification of large scale data. All of these test procedures are said to be necessary in order to reach the ultimate diagnosis. However, too many tests could complicate the main diagnosis process and lead to the difficulty in obtaining the end results, particularly in the case where many tests are performed [37]. This kind of difficulty could be resolved with the aid of Machine Learning (ML) which could be used directly to obtain the end result with the aid of several artificial intelligence techniques.
There are several applications for ML, the most significant of which is data mining. People are often prone to making mistakes during analyses or, possibly, when trying to establish relationships between multiple features. This makes it difficult for them to find solutions to certain problems. ML can often be successfully applied to these problems, improving the efficiency of systems and the designs of machines [37].
ML covers such a broad range of processes that it is difficult to define it precisely. A dictionary definition includes phrases such as to gain knowledge or understanding of or skill by studying the instruction or experience and modification of behavioral tendency by experienced zoologists and psychologists study learning in animals and humans. The extraction of important information from a large pile of data and its correlation is often the advantage of using machine learning [37]. Several studies have reported, in literature, the use of ML on diagnosis of diabetes complica-tions:
• Carnimeo and Giaquinto [38] proposed automatic detection of diabetic symptoms in retinal images by using machine learning technology
14 Methodology
• Radha and Rajagopalan [39] introduced an application of fuzzy logic to diagnosis of dia-betes
• Sapna et al. [40] proposed a technique based on diabetic neuropathy. They used the risk factors and symptoms of diabetic neuropathy to make the fuzzy relation equation.
The ML process used to characterize the gait follows the signal processing flow presented in figure 3.1. Following, it will be explain, in detail, each step of this process.
Figure 3.1: Schematic representation of a machine learning process
3.2
Data acquisition
To perform learning techniques there is the need to collect a set of data for studying. The sensors to collect this data were chosen based on the limitations associated with DPN patients (presented in last chapter). Ideally, in order to identify stages of DPN, the data should be collected from healthy subjects, NDPN, and DPN patients. Following, the sensors used to collect the gait data are explain in detail.
3.2.1 Inertial Sensors
As was mentioned in subsection 2.1.1, one of the alterations associated with DPN patients is gait abnormalities. Thus, one of the focus of this study was sensors that allow the detection of temporal and spatial features of gait.
3.2 Data acquisition 15
The traditional approach to quantitative motion analysis has proven to be clinically very useful. However, the implementation can be critical, once traditional motion analysis systems are quite expensive and difficult to be operated, only capture a limited number of consecutive gait strides, and these systems must operate in controlled environments, which hinders them from gathering information about the extent subjects perform functional activities outside the laboratory setting. These reasons lead to the recent surge of interest in ambulatory monitoring systems [41]. There-fore, inertial sensors, e.g., accelerometers, used alone or combined with other sensing devices, are becoming increasingly popular, due to their low cost, small size, light weight, and limited power requirements [41].
An accelerometer basically uses the fundamentals of Newton’s Laws of Motion, which say that the acceleration of a body is proportional to the net force acting on the body. Knowing the proportionality quotient (mass of the object), and all the forces (measured with the sensors), it is possible to calculate the acceleration. By taking the integral of the acceleration, it is obtain the velocity, and by integrating the velocity, it is obtain the position [1].
The signal obtained with accelerometers has two components, a gravitational acceleration component (static) - provides information on the postural orientation of the subject - and a body acceleration component (dynamic) - provides information on the movement of the subject [42].
In this context, several studies have been published with the purpose of demonstrating that inertial sensors can be used to detect simple temporal or spatial features of gait:
• Bouten et al. [43] developed a triaxial accelerometer and a portable data processing unit for assessment of daily physical activities.
• Veltink et al. [44] proposed and tested a three dimensional inertial sensing system, embed-ded in a two-channel implantable foot-drop stimulator, for measure foot movements during gait.
• Sabatini et al. [41] concluded that foot inertial sensing is a promising method for which sev-eral applications in rehabilitation, sport medicine, and health monitoring can be considered Nowadays, inertial sensors can be find built-in smartphones. These devices are practical, small and unobtrusive, and have the possibility to be wearable, which allows to work always next to the user, in real-time, and be used for long-term monitoring. Therefore smartphones can be used to acquire accelerometer data, being considered by the users an important personal device, with an exponential availability.
3.2.2 Plantar Pressure Sensors
Plantar pressures abnormalities are also presented in diabetes patients with neuropathy. There are a variety of plantar pressure measurement systems but in general they can be classified into one of the two types: platform systems and in-shoe systems [45]. In this work, the attention it will be focus on in-shoe systems.
16 Methodology
In-shoe plantar pressure systems have been widely used by researcher and clinicians in the fields of clinical rehabilitation, ergonomics, and sport activities [46]. Such systems allow moni-toring of foot plantar pressure during either static or dynamic activities, allowing measurements in real conditions without the limits of laboratorial setup. The operating principal behind each in-shoe system is generally the same: these systems use different sensors/insoles to collect and send to a hub, generally attached to the lateral malleolus or pelvic girdle, which records data in a memory card or transfers them in real-time to a computer by cable, bluetooth, or other wireless means [46].
WalkinSense (Kinematix SA, formerly Tomorrow Options) (Figure 3.2) is a user-friendly device designed for in-shoe monitoring and long-term storage of plantar pressure and spatial-temporal parameters during locomotion, such as gait speed, distance traveled, stride length and frequency, without the need for a standardized calibration and the constraints of a laboratorial setup [46]. This device allows for daily, continuous monitoring of plantar pressure through a data acquisition and a processing unit and individual sensors for plantar pressure measurement which can be attached to either and insole or patient’s sock [47]. Some characteristics of the WalkinSense system are presented in table 3.1.
Figure 3.2: WalkinSense Device. Adapted from [48]
Table 3.1: WalkinSense System Characteristics. Adapted from [46] WalkinSense System Weight 68g Length 78mm Width 48mm Thickness 18mm Components Micro-electromechanical system Triaxial accelerometer Gyroscope Force-sensing Piezoresistors Sensor Size 1.8cm
Number of Sensors 8 (freely positioned under or over any insole)
Frequency 100 Hz
Operation’s Mode Offline mode: data are stores to an SD memory card;
3.3 Preprocessing Techniques 17
One preliminary study has already explored the repeatability of the plantar pressures recorded by the WalkinSense. The system was found to be as repeatable as other plantar pressure measure-ment systems. However, when compared to F-Scan, WalkinSense appears to consistently report higher pressure values. Nevertheless, the authors assessed only three subjects and no statistical procedure was performed, suggesting that further investigation with a larger sample size should be performed to fully ascertain the repeatability and reliability of the system [47]. Another pre-liminary study assessed the spatial-temporal parameters of the WalkinSense in a small sample of 15 participants and found good accuracy and repeatability for these parameters [49]. Therefore, Castro et al. [46] measured the accuracy and repeatability of the gait analysis performed by the WalkinSense system. They have shown that the WalkinSense has good-to-excellent levels of accu-racy and repeatability for plantar pressure variables during static-bench and dynamic gait analysis [46].
3.3
Preprocessing Techniques
The goal of the preprocessing step is transform the raw data into some desired form from which useful features can be extracted [50]. The preprocessing techniques further explain were only applied to accelerometer data.
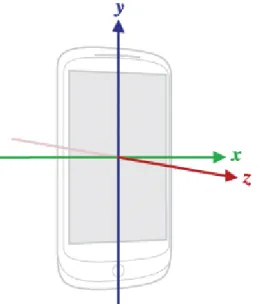
The accelerometer in Android phones measures the acceleration of the device on the x (lateral), y (vertical), and z (longitudinal) axes, as it is shown in figure 3.3. The acceleration is measure in the International System units, m/s2.
Figure 3.3: Coordinate system (relative to a device) that’s used by the Android Sensor API. Adapted from [51]
In some studies, features from individual acceleration axes may be important in determining activities where directional information is relevant [52]. However, in this study, the overall theme in the acceleration was deemed to be sufficient for the recognition of gait patterns. As a result, the
18 Methodology
first step taken in the preprocessing techniques was merge the three-dimensional input signal into one acceleration magnitude. The magnitude of the acceleration vector was determined by taking the euclidean magnitude of the three individual acceleration values (equation 3.1) [52]
α = p
x2+ y2+ z2 (3.1)
Irregular sampling rates created by the Android framework’s implementation of sampling mechanisms and the noise inherent in discrete physical sampling of continuous functions are the two principal sources of noise in the received signal [52]. The process used to handle the irreg-ular sampling of the received acceleration signal was data linearization. This process consists in choose a desired regular sampling rate and then interpolates all the holes in the data using linear interpolation [52]. One significant problem in the linearization process was to determine an ideal sampling rate. In order to ensure that not too much data was calculated via interpolation - which could have resulted in a false recreation of the original signal, the sample frequency chosen was 100Hz once is the sample rate of the Walkinsense.
After linearization, in order to reduce any additional noise, the signal was then ran through a 5-point smoothing algorithm. This algorithm calculates each point to be the average of its four neighbors, the two nearest before and the two nearest after [52]. The 5-point smooth was chosen so that spikes with an observable, steady progression would be preserved while sudden spikes would be eliminated [52]. Finally, the signal was passed through a 4th order Butterworth high-pass filter to remove the gravitational acceleration component (static - provides information on the postural orientation of the subject) [53]. The cut-off frequency was set at 1Hz [53].
3.4
Feature Extraction
The extraction of features from the collected gait signal is crucial for the efficient gait characteri-zation. In this study, features could be extracted from accelerometer and plantar pressures data.
From accelerometers, it is possible to extract feature from two broad domains - time and frequency-domain [54]. However, a combination of them is desirable.
Time-domain features are often used to select key signal characteristics or features. These metrics consist in simple mathematical and statistical measurements used to extract basic signal information from raw data [54]. Additionally, frequency-domain features have been often used to capture the repetitive nature of a sensor signal [54].
The Walkinsense system provides information, that allows the extraction of plantar pressure and spatial-temporal parameters. As mentioned in subsection 2.1.1, these characteristics are also crucial to evaluate the gait of DPN patients.
During this work, different experiments were performed. Therefore, the the features extracted for each performed analysis are summarized further, in detail.
3.5 Feature selection 19
3.5
Feature selection
After feature extraction, the next step is select the most relevant and informative features. In machine learning, feature selection is used to find the subset of the available input features that accurately predicts the output and remove the ones that are redundant and/or irrelevant. Conse-quently, feature selection improves predictive performance of the model, provides faster and more cost-effective predictors and provides a better understanding of the underlying process that gen-erated the data. Two different methods were tested for feature selection: principal components analysis (PCA) and forward selection (FS).
PCA is a useful statistic technique and is a common method for finding patterns in data of high dimension [55]. After find these patterns, PCA compress the data by reducing the number of dimensions, without much loss of information [55].
PCA was applied for the final feature matrix so that the features would undergo an orthogonal transformation to be converted to a set of different features called principal components. The main steps of the PCA are following described [55]:
1. Get feature matrix: MxN matrix, where M are the observations and N the number of features.
2. Subtract the mean: the mean is subtract from each of the features. The mean subtracted is the average across each feature. This produces a dataset whose mean is zero.
3. Calculate the covariance matrix: covariance is always measured between 2 features. In this study, the dataset has more than 2 features, thus there is more than one covariance measure-ment that can be calculated. The number of different covariance values that can be calculated for n-features data is given by the following equation:
n!
(n − 2)! ∗ 2 (3.2)
In addition, a n-features dataset originates a square matrix of order n, where each entry is the result of the covariance calculated between two separate features.
4. Calculate the eigenvectors and eigenvalues of the covariance matrix: The eigenvectors extracted from the covariance matrix allow the characterization of the data. let A be an n x n matrix. The number λ is an eigenvalue of A if there exists a non-zero vector υ such that Aυ = λ υ In this case, vector υ is called an eigenvector of A corresponding to λ . From a square matrix of order n it is possible to extract n eigenvectors.
5. Choosing the principal components: the eigenvectors extracted from the covariance ma-trix are order by the correspondent eigenvalues, from highest to lowest. This gives the compo-nents in order of significance. In fact, the eigenvector with the highest eigenvalues is the principal component. After having the components in order of significance, it is possible to ignore the com-ponents of lesser significance. Some information is lost, however if the eigenvalues is small, the information lost is not significant. In short, the choose of some principal components leads to data compression and dimensionality reduction.
20 Methodology
FS method selects the most relevant attributes through a highly efficient implementation of the forward selection scheme. This method starts with an empty selection of attributes and, in each round, it adds each unused attribute. For each added attribute, the performance is estimated using inner operator. Only attributes giving the highest increase of performance is added to the selection. Then a new round is started with the modified selection [56]. The iteration ran as long as there was any increase in performance. This implementation avoids any additional memory consumption besides the memory used originally for storing the data and the memory which might be needed for applying the inner operator [56].
3.6
Classification
The development of robust pattern classifiers from limited training set of observations (i.e, fea-tures vectors) has long been one of the most relevant and challenging tasks in in machine learning and statistical pattern recognition [57]. In all machine learning algorithms, the goal of the learning algorithm is to build a model which makes accurate predictions on the training set. Therefore, ma-chine learning classifiers tend to perform very well on the data they were trained on (phenomenon called overfitting) [58]. However, training set accuracy is not a good indication about the classifier performance when classifying unseen data. Cross-validation is a tool meant for evaluating the per-formance of a system and its accuracy. In order to avoid the overfitting, cross-validation precess divides the dataset into a large training set and a smaller validation set, then train on the training set and use the validation set to measure the accuracy [58]. However, to assure that the data is not biased it is important to take two considerations [58]:
1. Validation set should be diverse. Thus, the validation set should be randomly select from the existing collection of data;
2. Accuracy and usefulness of the cross-validation process depends on having a dataset repre-sentative of the range of possible expected inputs.
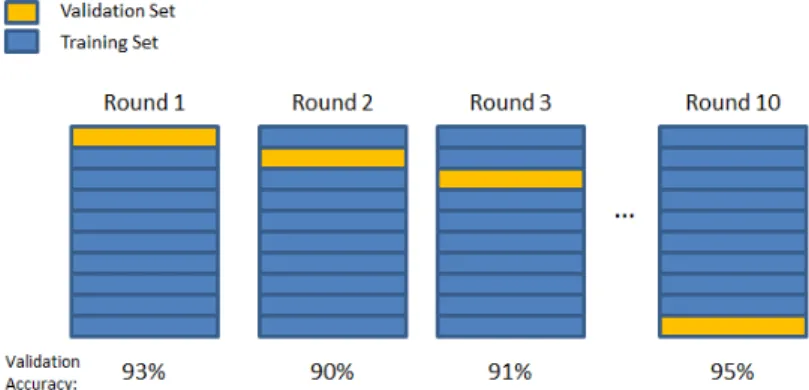
Cross-validation method has different approaches to select the training and validation sets. In this study, the method used was k-fold cross-validation, which consists in divide the data into k folds (in this case 10 folds) [58]. One fold was designated as the validation set, while the remaining nine folds were all combined and used for training. The validation accuracy was computed for each of the ten validation sets, and averaged to get a final cross-validation accuracy [58]. This process is shown in figure 3.4.
After split the dataset into train set and validation set, classifiers were applied to predict the unseen data. The intention of using a different classifier for the same conditions was to evaluate the differences in terms of performance. Based on literature [50] [59], the classifiers chosen were k-nearest neighbours (kNN) and support vector machine (SVM).
The kNN is a non-parametric classification method, which is simple but effective in many cases [60]. Classification of a test example is done by finding the training set example that is
3.6 Classification 21
Figure 3.4: 10-fold cross-validation. The accuracy numbers shown are just for illustration.
Adapted from [58]
most similar to it based on the lowest euclidean distance, considering the entire feature vector, and assigning the label of this nearest neighbour to the test sample [61]. This algorithm contains following three steps to classify objects [62]:
1. Calculate distances of all training vectors to test vector; 2. Pick k closest vector;
3. Calculate average/majority.
If k=1, then the object is simply assigned to the class of the its nearest neighbour [62]. The best choice of k depends upon the data; generally, larger values of k reduce the effect of noise on the classification, but make boundaries between classes less distinct. Choosing an appropriate k is essential to make the classification more successful [62].
Nearest-neighbour classification works very well if there is a small number of features, it tends to fare worse in situation where there are many features and only a few are informative. Hence, it is generally used in conjunction with feature selection methods [61].
SVM is a machine learning tool and has emerged as a powerful technique for learning from data. The aim is to find an optimal separating hyperplane (OSH) between two datasets. SVM finds the OSH by maximizing the margin between the classes [63]. In the case of linearly separable data, once the OSH is found, data points that lie on its margin are known as support vector points, and the solution is represented as a linear combination of only these points. Other data points are ignored. Figure 3.5 represents an example of SVM method.
There are different ways to evaluate the performance of a recognition algorithm. In this study the metric used was accuracy (equation 3.3 [64]) which estimates the overall success rate, it is measure of the global performance of the algorithm in what concerns correct decisions [64].
accuracy= T P+ T N
22 Methodology
where TP, TN, FP, and FN are true positive, true negative, false positive, and false negative, respectively. These values are obtained from the confusion matrix.
Figure 3.5: An example of two-class (+ and ◦) problem showing optimal separating hyperplane (dotted line) that SVM uses to divide two groups data and the associated suppor vectors. Adapted from [63]
Chapter 4
Preliminary Tests
This chapter describes and evaluates the preliminary tests. The purpose of these tests was to infer the more suitable experimental protocol to identify stages of DPN. Two main goals were identified:
1. Evaluate if the velocity should be controlled during the data acquisition.
2. Evaluate if the data acquisition should be performed on a challenging environment, since diabetes patients have a tendency to have a less efficient gait pattern in this condition. These preliminary tests were performed on a dataset collected at Fraunhofer AICOS installa-tions, with healthy volunteers. After data collection, ML methodology was implemented.
4.1
Methodology
The input of the system was accelerometer data collected from healthy subjects walking with different speeds and in different environments. In order to reach the goals of these preliminary tests two classifications were performed: discriminate walking speeds and distinguish gait envi-ronments.
The methodology implemented was already explain, in detail, in section 3.1. PCA and FS were applied to select suitable features. SVM and kNN performed the classification. The processes used to record the dataset and extract the features are explained further in detail.
4.1.1 Data Acquisition
Five healthy subjects participated in the acquisition of this dataset. The accelerometer data was acquired from smartphones (Samsung GalaxyS and Nexus 5) placed on the front pockets of the trousers. Each participant walked across a 63 m corridor with three different walking speeds: slow, normal, and fast. Additionally, in the second part of the experiment, each subject walked on a treadmill with three controlled walking speeds: 0.56 m/s, 1 m/s, and 1.39 m/s. Table 4.1 summarizes the experiments performed by each subject.
24 Preliminary Tests
Table 4.1: Experimental Protocol Experimental Protocol
Walking Environment Walk on 63m corridor Walk on treadmill
Walking speed Slow Normal Fast 0.56 m/s 1 m/s 1.39 m/s
4.1.2 Feature Extraction
During the experiment, only accelerometer data was collected. Initially, the accelerometer data was divided into sequential windows in order to extract features from each window. One of the most used approach to split the data is the sliding window technique, where the signal is divided into equal windows with no gaps. A sample window of 512 samples with an overlap of 50% were chosen based on the recommendations of prior studies, because it was deemed sufficient to characterize the gait [52].
As mentioned in section 3.4, it is desirable extract a combination of time and frequency-domain features from the accelerometer data.
Tables 4.2 and 4.3 summarize and explain the extracted time and frequency-domain features. Following, the wavelet coefficients extraction is describe in detail.
Fourier Transform technique is a commonly used signal transformation which allows the rep-resentation in the frequency domain (or spectrum) important characteristics of a time-based signal [54]. However, one of the major shortcomings of the Fourier transform is that it does not offer good localization in time,i.e. the transformed representation contains only information in the fre-quency domain [50]. The wavelet transform is a technique that cuts up the data into different frequency components, and then studies each component with a resolution matched t its scale (time-frequency representation) [50]. The wavelet transform of a signal depends on two variables: scale (or frequency) and time, and provides a tool for time-frequency localization [50].
A mother wavelet ψ (x) is a finite length and fast-decaying oscillating waveform. The mother wavelet is origins an entire family of wavelets by means of two operation: dyadic dilations (repre-sented by j)and integer translations (repre(repre-sented by k) [50]:
ψj,k(x) = 2
j
2ψ (2jx− k) (4.1)
The set {ψj,k, j, k∈ Z} constitutes a complete orthonormal system for L2(R) [50]. A wavelet transform is the representation of the original signal by wavelets [50]:
cj,k= h f (x), ψj,k(x)i (4.2) f(x) = ∞
∑
j ∞∑
k cj,kψj,k(x) (4.3)4.2 Results and Discussion 25
Multiresolution analysis (MRA) is one wavelet method which decomposes the signal into approximate spaces and detail spaces. One of the advantages of this method is that preserves interesting features of the original function, but express the function in terms of a relatively small set of coefficients [50].
It was used the Daubechies 4 tap wavelet family and a multiresolution decomposition level of 4. Figure 4.1 represents a typical decomposition, wheres s is the original signal, d1, d2, ... are detail coefficients, and a1, a1, ... are approximate coefficients. The original signal is completely characterized by the coefficients [a4,d4,d3,d2,d1] [50].
After extract the coefficients, in order to include only the most relevant information and reduce the dimension of the feature space, the Euclidean norms of each level of coefficients calculated: [ka4k, kd4k, kd3k, kd2k, kd1k]
Figure 4.1: Multiresolution wavelet decompostion of level 4. Adapted from [50]
Tables 4.2 and 4.3 summarize and explain the time and frequency domain features extracted from accelerometer data.
4.2
Results and Discussion
This section summarizes the relevant results obtained with the proposed methods as well as a rel-evant discussion. This section is divided into: preprocessing results, discriminate walking speeds, and discriminate walking environments.
4.2.1 Preprocessing Results
Figure 4.2 represents the results obtained from the implementation of the preprocessing methods described in section 3.3
The first graphic, in figure 4.2, represents the raw data after calculate the magnitude of accel-eration. Then, the signal before and after data linearization can be seen in the first two graphics
![Figure 2.1: DPN causes pain or loss of feeling in toes, feet, legs, hands, and arms [9]](https://thumb-eu.123doks.com/thumbv2/123dok_br/15857359.1086407/24.892.328.520.588.999/figure-dpn-causes-pain-loss-feeling-toes-hands.webp)
![Table 3.1: WalkinSense System Characteristics. Adapted from [46]](https://thumb-eu.123doks.com/thumbv2/123dok_br/15857359.1086407/36.892.93.769.841.1138/table-walkinsense-system-characteristics-adapted-from.webp)
![Figure 4.1: Multiresolution wavelet decompostion of level 4. Adapted from [50]](https://thumb-eu.123doks.com/thumbv2/123dok_br/15857359.1086407/45.892.295.640.428.729/figure-multiresolution-wavelet-decompostion-level-adapted.webp)
![Table 4.2: Time-domain features [54, 65]](https://thumb-eu.123doks.com/thumbv2/123dok_br/15857359.1086407/47.1262.140.1089.251.384/table-time-domain-features.webp)