Fernando K. Almeida, Jorge L. Gross, Ticiana C. Rodrigues
Serviço de Endocrinologia do Hospital de Clínicas de Porto Alegre1; Universidade Federal do Rio Grande do Sul2, Porto Alegre, RS - Brazil
Mailing address: Ticiana da Costa Rodrigues •
Rua Ramiro Barcelos, 2350 - Bom Fim - 90520-100 - Porto Alegre, RS - Brazil E-mail: [email protected]
Manuscript received October 17, 2010; revised manuscript received December 23, 2010; accepted January 11, 2011.
Abstract
Background: The presence of cardiac autonomic neuropathy (CAN) in patients with diabetes mellitus (DM) is associated with increased mortality and chronic microvascular complications of diabetes.
Objective: To investigate a possible association between specific findings of CAN during exercise testing (ET) and nephropathy and retinopathy in patients with type 1 DM.
Methods: We conducted a cross-sectional study of 84 patients with type 1 DM. All patients underwent clinical laboratory evaluation and performed ET, and those who presented findings suggesting myocardial ischemia were excluded from data analysis (n = 3). The assessment of microvascular complications (retinopathy and nephropathy) was performed in the sample.
Results: Patients with nephropathy and those with retinopathy achieved a lower heart rate (HR) at peak exercise (HR max) and smaller increase in HR in relation to rest (Peak ΔHR) compared with those without these complications. These patients also had a smaller reduction in HR in the second and 4th minutes after the end of the test (ΔHR recovery 2 and
4 minutes). After performing a multivariate analysis with control for possible confounding factors, the ΔHR recovery in two and four minutes, maximum HR and Peak ΔHR remained significantly associated with retinopathy; and ΔHR recovery in the second and 4th minutes remained associated with the presence of nephropathy.
Conclusion: The ET can be considered an additional tool for early detection of CAN and to identify patients at increased risk for microvascular complications of diabetes. (Arq Bras Cardiol. 2011; [online].ahead print, PP.0-0)
Keywords: Diabetes mellitus, type 1/complications; diabetic neuropathies; diabetic angiopathies; exercise test.
as the autonomic response to standing posture, the Valsalva maneuver and the change in heart rate (HR) during cycles of profound inspiration4.
Typical manifestations of autonomic neuropathy include: loss of awareness of hypoglycemia, gastrointestinal disorders (diarrhea, constipation, fecal incontinence and gastroparesis), urinary disorders (neurogenic bladder, manifested by incontinence and urinary retention), sexual dysfunctions, abnormal sweat glands (dry skin) and cardiovascular diseases. The cardiovascular autonomic disorders are reflected in an early reduction of HR variability, a phenomenon that predisposes to postural hypotension, exercise intolerance and cardiovascular instability during surgery, and tachycardia at rest4. Concurrently, there is a smaller reduction in the levels of diastolic blood pressure at night, a phenomenon that could also be implicated in the development of target organ damage7,8. The frequency of CAN increases with age and with the duration of diabetes, and its presence is associated with retinopathy, nephropathy and peripheral neuropathy3,4,9,10.
In patients with type 1 diabetes (T1DM), cardiac autonomic disorders, as assessed by HR during inspiration and expiration and the cardiac response during induction of standing, related to the development of diabetic nephropathy (DN) over the years11. Other studies havereported that autonomic disturbances detected by pupillometry increase the risk of
Introduction
kidney disease in the future12. Patients with nephropathy and abnormal variation in HR during the cycle of inspiration and expiration present a risk of fatal and nonfatal cardiovascular events higher than those with only nephropathy and without autonomic disorders13.
HR variation in relation to peak exercise and the first minutes of recovery after exercise testing (ET) has been validated as a prognostic cardiovascular factor14,15. However, the association of this marker of cardiac autonomic dysfunction with renal complications of diabetes has not been demonstrated. The purpose of this study was to describe the association of chronotropism variation with microvascular disease in patients with DM1.
Methodology
We conducted a cross-sectional study with patients with DM1, which were selected from a cohort of more than 300 patients followed up at Hospital de Clínicas de Porto Alegre16. The Research Ethics Committee of the Hospital (project 08-470) previously approved the study and all patients, before participating in this study, signed an informed consent. All patients selected had undergone ET as established in the research protocol, and as a criterion for inclusion, patients should not demonstrate the presence of myocardial ischemia or cardiac arrhythmias during the test. This criterion was used because patients with myocardial ischemia were using medications with interference on heart rate and have limited maximum physical exertion. To be eligible, the individuals should also have normal peripheral sensitivity test (monofilament) and have no symptoms of autonomic neuropathy or postural hypotension during the clinical evaluation. Through such criteria, we obtained a sample consisting of 84 patients.
The demographic and anthropometric variables in this group were obtained by interview and clinical examination. Patients were also evaluated for the presence of diabetic nephropathy (DN) and diabetic retinopathy (DR). The presence of DR was assessed by ophthalmoscopy after mydriasis performed by the same ophthalmologist. Patients with any degree of retinopathy during the test were classified as positive for the presence of this variable. Patients were categorized as the presence of nephropathy through urine sample analysis or 24-hour urine. Those with urinary albumin excretion exceeding 17 mg/dl in the sample or greater than 20 μg/min in the 24-hour urine15, confirmed by at least two samples with interval of 06 months, were considered with nephropathy.
The ET was performed according to Bruce protocol16. Information on symptoms, rhythm, heart rate and blood pressure were collected at baseline and during the stages of the protocol: maximal exercise, 1, 2 and 4 minutes after the test. The workload was assessed by the number of metabolic equivalents achieved (METs), defined in standardized tables and corresponding to 3.5 ml of oxygen obtainned per kilogram of body weight per minute17. The increase in HR was defined as the difference between the maximum exercise HR and
baseline resting (Peak ΔHR). The recovery HR was defined
as the difference between the peak of maximal exercise and HR of recovery phases with 1, 2 and 4 minutes after the test
(ΔHR recovery 1, 2 and 4 minutes). Likewise, we can calculate
the increase in systolic and diastolic blood pressure to peak exercise and recovery BP in 1, 2 and 4 minutes after the end
of the exertion (ΔSBP peak, recovery 1, 2 and 4 minutes; ΔDBP peak, recovery 1, 2 and 4 minutes).
Urinary albumin excretion (UAE) was measured in casual samples or in 24-hour collections by immunoturbidimetric (MicroAlb Sera-Pak™ immuno microalbuminuria, Roche™, USA) in at least two measurements with an interval of 06 months18. The glycosylated hemoglobin (HbA1c) was measured by high performance liquid chromatography (reference values between 4.7 and 6.0%; Merck-Hitachi 9100, Germany). Fasting glucose was measured by enzymatic colorimetric method of glucose-peroxidase (Biodiagnóstica, Brazil). Serum creatinine was measured by Jaffé method and serum total cholesterol and triglycerides were measured by enzymatic colorimetric methods (Merck Diagnóstica,
Boeringher Manheim, Germany). To measure HDL cholesterol,
we used the direct homogeneous method (AutoAnalyzer, ADVIA 1650, Siemens Healthcare Diagnostics, Germany).
LDL cholesterol was calculated by the Friedwald formula19.
Statistical analysis
For analysis of clinical and laboratory variables, we used Student t for quantitative variables (presented as mean ± standard deviation) and chi-square test for qualitative variables (presented as percentage of total sample). Quantitative variables without normal distribution were transformed log and are presented as median and minimum-maximum value. Multivariate analyses were performed with the variables of change in HR as independent variables and the presence of retinopathy or nephropathy as dependent variables. The comparisons were adjusted for multiple possible confounding factors. We considered p values below 0.05 statistically significant.
Results
The sample consisted of 84 patients with type 1 diabetes, three patients were excluded after the test because they had signs suggestive of ischemic heart disease during the test. Out of the sample, 81 patients remained: 54.3% (n = 44) male, 17.2% (n = 14) were smokers at the time of this study and 46.9% (n = 38) had previously diagnosed hypertension (HTN). The patients had 17.6 ± 11.2 years of average duration of the disease and mean age of 40.5 ± 10.8 years. After the investigation for microvascular complications of diabetes, 54.3% (n = 44) of patients demonstrated some degree of retinopathy and 33.3% (n = 27) of them were considered as having nephropathy according to the microalbuminuria results. Out of the patients with nephropathy, 37.0% (n = 10) had albumin excretion in urine levels of macroalbuminuria. On the other hand, among patients with retinopathy, 20 (45.5%) had mild nonproliferative retinopathy, two (4.5%) had moderate non-proliferative form, 06 (13.6%) had severe non-non-proliferative retinopathy and 16 (36.4%) had proliferative retinopathy.
of diabetic retinopathy had longer duration of diabetes than those without DR (11.4 ± 7.8 vs 23.4 ± 11.3 years; p < 0.01). The prevalence of previous diagnosis of hypertension was higher among patients with DR (28.1% vs. 59.1%, p = 0.014), and higher serum creatinine levels and higher UAE. Glycemic control, assessed by glycated hemoglobin, was not associated with this complication (8.15% ± 1.9 vs 8.7% ± 1.7, p = 0.24). There was no difference regarding age, sex or smoking. During the ET, it was observed that those patients who had no retina disorders reached higher values of HR (HR max) during exercise, and also have a higher increase in HR in response to exercise
in relation to baseline HR at rest (Peak ΔHR), compared to those who had DR. Likewise, the ΔHR recovery in two and 04
minutes was also higher in those who had no DR.
Considering the measures of blood pressure during exercise, patients with DR showed higher values of systolic and diastolic blood pressure at rest, and there was also a greater
increase in systolic pressure to peak exercise (ΔSBP Peak).
There was no difference in the number of METs achieved by the two groups. The figures for exercise testing in patients with and without DR are shown in Table 1.
When we stratified the patients by varying degrees of DR, we observed that patients with light nonproliferative
DR (NPDR) had higher Peak ΔHR than those with moderate NPDR; patients without DR showed higher peak ΔHR than
those with moderate NPDR and proliferative DR. Moreover, patients without DR had a higher maximum HR, higher 2 min
ΔHR and higher 4 min ΔFC than those with proliferative DR.
Patients with diabetic nephropathy had higher duration of diabetes mellitus at the time of the ET than those without nephropathy (11.4 ± 7.8 vs 23.4 ± 11.3 years; p < 0.01). Higher values of triglycerides and creatinine were also associated with this complication. The prevalence of hypertension was higher in patients with nephropathy (34% vs 73.1%; p = 0.04), without differences by gender and smoking. In this comparison, we found no difference in the glycemic control in patients with nephropathy (8.15 ± 1.9% vs 8.7% ± 1.7, p = 0.38). Individuals without DN also showed
higher Peak ΔHR, maximum HR and higher ΔFC at rest in two and 04 minutes. In this study, we find a ΔDBP at rest in two
and 04 minutes significantly higher among patients without nephropathy, a finding that had not been observed in relation to retinopathy. Again, the number of METs achieved were very similar between groups (Table 2).
We performed a logistic regression controlling for possible confounding factors in order to confirm whether the findings of chronotropism variation previously associated with diabetic retinopathy would remain statistically significant. After controlling for the presence of hypertension and DM duration,
the ΔHR recovery in two and 04 minutes, maximum ΔHR and Peak ΔHR remained significantly associated with retinopathy; peak ΔSBP lost significance after this adjustment (Table 3).
In relation to the DN, the analysis was also performed controlling for the presence of hypertension and diabetes
mellitus duration. Only the ΔHR recovery in two and 04
minutes was statistically significant in this analysis (Table 4). The difference between peak exercise HR values for baseline rest was negatively correlated with diurnal and
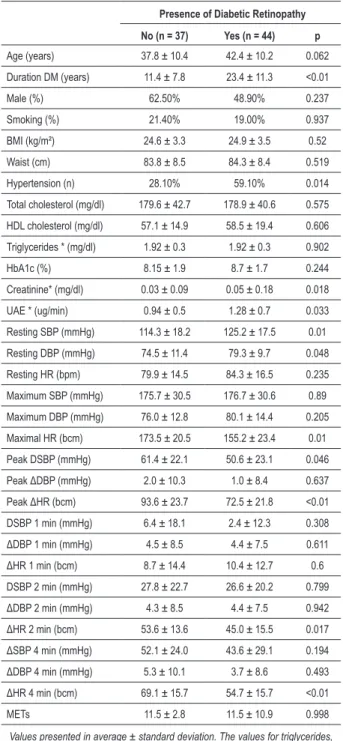
Table 1 - Clinical and laboratory characteristics of patients with and without retinopathy
Presence of Diabetic Retinopathy
No (n = 37) Yes (n = 44) p
Age (years) 37.8 ± 10.4 42.4 ± 10.2 0.062
Duration DM (years) 11.4 ± 7.8 23.4 ± 11.3 <0.01
Male (%) 62.50% 48.90% 0.237
Smoking (%) 21.40% 19.00% 0.937
BMI (kg/m²) 24.6 ± 3.3 24.9 ± 3.5 0.52
Waist (cm) 83.8 ± 8.5 84.3 ± 8.4 0.519
Hypertension (n) 28.10% 59.10% 0.014
Total cholesterol (mg/dl) 179.6 ± 42.7 178.9 ± 40.6 0.575
HDL cholesterol (mg/dl) 57.1 ± 14.9 58.5 ± 19.4 0.606
Triglycerides * (mg/dl) 1.92 ± 0.3 1.92 ± 0.3 0.902
HbA1c (%) 8.15 ± 1.9 8.7 ± 1.7 0.244
Creatinine* (mg/dl) 0.03 ± 0.09 0.05 ± 0.18 0.018
UAE * (ug/min) 0.94 ± 0.5 1.28 ± 0.7 0.033
Resting SBP (mmHg) 114.3 ± 18.2 125.2 ± 17.5 0.01
Resting DBP (mmHg) 74.5 ± 11.4 79.3 ± 9.7 0.048
Resting HR (bpm) 79.9 ± 14.5 84.3 ± 16.5 0.235
Maximum SBP (mmHg) 175.7 ± 30.5 176.7 ± 30.6 0.89
Maximum DBP (mmHg) 76.0 ± 12.8 80.1 ± 14.4 0.205
Maximal HR (bcm) 173.5 ± 20.5 155.2 ± 23.4 0.01
Peak DSBP (mmHg) 61.4 ± 22.1 50.6 ± 23.1 0.046
Peak ΔDBP (mmHg) 2.0 ± 10.3 1.0 ± 8.4 0.637
Peak ΔHR (bcm) 93.6 ± 23.7 72.5 ± 21.8 <0.01
DSBP 1 min (mmHg) 6.4 ± 18.1 2.4 ± 12.3 0.308
ΔDBP 1 min (mmHg) 4.5 ± 8.5 4.4 ± 7.5 0.611
ΔHR 1 min (bcm) 8.7 ± 14.4 10.4 ± 12.7 0.6
DSBP 2 min (mmHg) 27.8 ± 22.7 26.6 ± 20.2 0.799
ΔDBP 2 min (mmHg) 4.3 ± 8.5 4.4 ± 7.5 0.942
ΔHR 2 min (bcm) 53.6 ± 13.6 45.0 ± 15.5 0.017
ΔSBP 4 min (mmHg) 52.1 ± 24.0 43.6 ± 29.1 0.194
ΔDBP 4 min (mmHg) 5.3 ± 10.1 3.7 ± 8.6 0.493
ΔHR 4 min (bcm) 69.1 ± 15.7 54.7 ± 15.7 <0.01
METs 11.5 ± 2.8 11.5 ± 10.9 0.998
Values presented in average ± standard deviation. The values for triglycerides, creatinine and UAE (*) were log transformed. P values < 0.05 were considered statistically signiicant, after performing the Student t test for continuous variables and chi-square test for categorical variables. HbA1c - glycosylated hemoglobin, UAE - urinary albumin excretion, SBP - systolic blood pressure, DBP - diastolic blood pressure, HR - heart rate, MET - metabolic equivalents. Peak Δ - Difference between peak exercise and rest values, Δ 1 min - difference between peak exercise values and after 1 minute of recovery, Δ 2 min - difference between peak exercise values and after 2 minutes of recovery, Δ 4 min - difference between peak of exercise values and after 4 minutes of recovery.
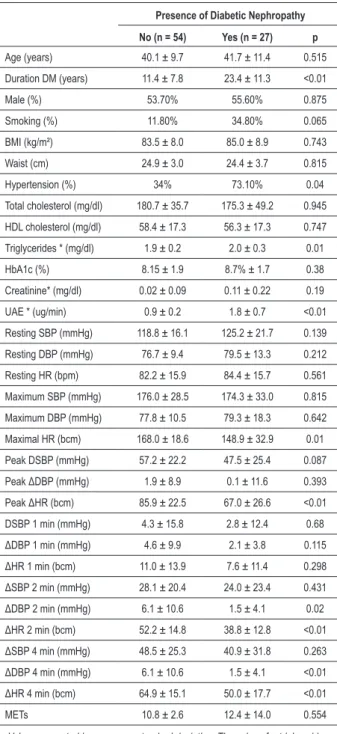
Table 2 - Clinical and laboratory characteristics of patients with and without nephropathy
Presence of Diabetic Nephropathy
No (n = 54) Yes (n = 27) p
Age (years) 40.1 ± 9.7 41.7 ± 11.4 0.515
Duration DM (years) 11.4 ± 7.8 23.4 ± 11.3 <0.01
Male (%) 53.70% 55.60% 0.875
Smoking (%) 11.80% 34.80% 0.065
BMI (kg/m²) 83.5 ± 8.0 85.0 ± 8.9 0.743
Waist (cm) 24.9 ± 3.0 24.4 ± 3.7 0.815
Hypertension (%) 34% 73.10% 0.04
Total cholesterol (mg/dl) 180.7 ± 35.7 175.3 ± 49.2 0.945
HDL cholesterol (mg/dl) 58.4 ± 17.3 56.3 ± 17.3 0.747
Triglycerides * (mg/dl) 1.9 ± 0.2 2.0 ± 0.3 0.01
HbA1c (%) 8.15 ± 1.9 8.7% ± 1.7 0.38
Creatinine* (mg/dl) 0.02 ± 0.09 0.11 ± 0.22 0.19
UAE * (ug/min) 0.9 ± 0.2 1.8 ± 0.7 <0.01
Resting SBP (mmHg) 118.8 ± 16.1 125.2 ± 21.7 0.139
Resting DBP (mmHg) 76.7 ± 9.4 79.5 ± 13.3 0.212
Resting HR (bpm) 82.2 ± 15.9 84.4 ± 15.7 0.561
Maximum SBP (mmHg) 176.0 ± 28.5 174.3 ± 33.0 0.815
Maximum DBP (mmHg) 77.8 ± 10.5 79.3 ± 18.3 0.642
Maximal HR (bcm) 168.0 ± 18.6 148.9 ± 32.9 0.01
Peak DSBP (mmHg) 57.2 ± 22.2 47.5 ± 25.4 0.087
Peak ΔDBP (mmHg) 1.9 ± 8.9 0.1 ± 11.6 0.393
Peak ΔHR (bcm) 85.9 ± 22.5 67.0 ± 26.6 <0.01
DSBP 1 min (mmHg) 4.3 ± 15.8 2.8 ± 12.4 0.68
ΔDBP 1 min (mmHg) 4.6 ± 9.9 2.1 ± 3.8 0.115
ΔHR 1 min (bcm) 11.0 ± 13.9 7.6 ± 11.4 0.298
ΔSBP 2 min (mmHg) 28.1 ± 20.4 24.0 ± 23.4 0.431
ΔDBP 2 min (mmHg) 6.1 ± 10.6 1.5 ± 4.1 0.02
ΔHR 2 min (bcm) 52.2 ± 14.8 38.8 ± 12.8 <0.01
ΔSBP 4 min (mmHg) 48.5 ± 25.3 40.9 ± 31.8 0.263
ΔDBP 4 min (mmHg) 6.1 ± 10.6 1.5 ± 4.1 <0.01
ΔHR 4 min (bcm) 64.9 ± 15.1 50.0 ± 17.7 <0.01
METs 10.8 ± 2.6 12.4 ± 14.0 0.554
Values presented in average ± standard deviation. The values for triglycerides, creatinine and UAE (*) were log transformed. P values < 0.05 were considered statistically signiicant, after performing the Student t test for continuous variables and chi-square test for categorical variables. HbA1c - glycosylated hemoglobin, UAE - urinary albumin excretion, SBP - systolic blood pressure, DBP - diastolic blood pressure, HR - heart rate, MET - metabolic equivalents. Peak Δ - Difference between peak exercise and rest values, Δ 1 min - difference between peak exercise values and after 1 minute of recovery, Δ 2 min - difference between peak exercise values and after 2 minutes of recovery, Δ 4 min - difference between peak of exercise values and after 4 minutes of recovery.
peak exercise and after 04 minutes of recovery also showed a negative correlation with the diurnal and nocturnal SBP in these patients (r = - 0, 329, p = 0.009, r = -0.359, p = 0.004, respectively).
Discussion
An inadequate cardiac chronotropic response to physical activity strongly suggests vagal dysfunction20. Patients with diabetes and cardiac dysautonomia admittedly have a reduced exercise tolerance and reduced HR variability in several situations4. Kramer et al6 observed the association between low HR response to physical exercise in the presence of DR in a group of patients with DM1 and DM2. In the same study, the variability in ET showed a significant Table 3 - Odds ratio for the presence of retinopathy
Odds ratio for the presence of retinopathy
OR 95% CI p
Peak ΔHR * 0.95 0.92 - 0.99 0.01
ΔHR 2 min** 0.94 0.90 - 0.99 0.03
ΔHR 4 min*** 0.91 0.86 - 0.96 0.002
Maximal HR**** 0.95 0.92 - 0.99 0.04
Peak ΔSBP 0.99 0.95 - 1.01 0.25
OR - odds ratio. CI 95% - conidence interval 95%. Peak ΔHR - difference between HR at peak exercise and at rest, ΔHR - 2 min difference between HR at peak exercise and after 2 minutes of recovery, ΔHR - 4 min difference between HR at peak exercise and after 4 minutes of recovery, maximal HR - HR at peak exercise, peak ΔSBP - difference between SBP at peak exercise and at rest. We considered p values ≤ 0.05 statistically signiicant. Analysis controlled for the following confounding factors: DM duration and presence of hypertension. *DM Duration (years): 1.22 (1.08 to 1.37), p = 0.001, SBP: 1.92 (0.47 to 7.84), p = 0.36. **DM Duration: 1.24 (1.10 to 1.40), p = 0.001, SBP: 2.53 (0.66 to 9.64), p = 0.17. **DM Duration: 1.27 (1.11 – 1.45), p < 0.001; SBP: 2.0 (0.46 – 9.00), p = 0.34. **** DM Duration: 1.21 (1.09 – 1.36), p <0.001, SBP: 2.14 (0.55 – 8.25), p = 0.26.
Table 4 - Odds ratio for the presence of nephropathy
Odds ratio for the presence of nephropathy
OR 95% CI p
Peak ΔHR 0.98 0.95 - 1.00 0.10
ΔHR 2 min* 0.92 0.88 - 0.97 0.004
ΔHR 4 min** 0.94 0.90 - 0.98 0.01
Maximal HR 0.97 0.94 - 1.00 0.12
ΔDBP 2 min 0.92 0.83 - 1.01 0.08
ΔDBP 4 min 0.91 0.83 - 1.00 0.07
OR - odds ratio. CI 95% - conidence interval 95%. Peak ΔHR - difference between HR at peak exercise and at rest, ΔHR 2 min - difference between HR at peak exercise and after 2 minutes of recovery, ΔHR 4 min - difference between HR at peak exercise and after 4 minutes of recovery, maximal HR - HR at peak exercise, peak ΔSBP 2 min - difference between SBP at peak exercise and after 2 minutes of recovery, ΔDBP 4 min - difference between peak DBP and after 4 minutes of recovery. We considered p values ≤ 0.05 statistically signiicant. Analysis controlled for the following confounding factors: DM duration and presence of hypertension. *DM Duration: 1.00 (0.94 – 1.08), p = 0.8; SBP: 6.4 (1.64 – 24.9), p = 0.007. ** DM Duration: 1.00 (0.93 – 1.08), p = 0.81; SBP: 5.45 (1.47 – 20.0), b p = 0.01.
monitoring (ABPM) (r =-0.367, p = 0.003; r = -0.412, p =
correlation with HR variability in standard tests for CAN6. Our data confirmed the findings of Kramer; the presence of DR was associated with lower HR variation on ET, as well as the same finding for nephropathy. The lower HR recovery in the second and 4th minutes of rest after the ET showed a significant association with the presence of nephropathy. The fact that the HR increase from baseline to peak exercise has shown an association with retinopathy only, rather than with nephropathy may be due to the higher prevalence of retinopathy in our sample of patients.
The association between CAN and nephropathy has been demonstrated previously in patients with diabetes9-12,20,21, however, more complex methods were used to detect autonomic neuropathy. The presence of CAN is also associated with smaller nocturnal blood pressure reduction in patients with DM120,21. This fact allows us to consider the slightest pressure variability during sleep-wake cycle in patients with autonomic neuropathy as a possible physiopathological mechanism for the higher prevalence of nephropathy in these individuals. In our sample, we observed that a smaller increase in heart rate during exercise and a smaller reduction in HR after 04 minutes of cessation of exercise correlated with higher measures of SBP during the day and night in those patients who underwent ABPM. A more detailed analysis of these findings may eventually contribute to a better understanding of the relationship between CAN and microvascular complications. Among the limitations of our study, we can cite the small sample size and cross-sectional design. The latter prevents us from establishing relationships of cause and effect between variables and to better understand the influence of risk factors on previous outcomes (e.g., poor glycemic control and microvascular complication). We expect to fix these limitations
through a larger sample and conducting a prospective analysis of these patients.
The advantage of using the ET for evaluation of CAN is that it is a diagnostic method often used for other purposes in medical care to patients with DM. Careful observation of data from the test, especially the variation in HR, enriches the evaluation of the patient, allowing to suspect of the presence of autonomic neuropathy and recognize patients at increased risk for microvascular complications. This can expand the clinically relevant information obtained when patients were tested, even though this is not done specifically for this indication. Thus, if used correctly, it would be possible to recognize early cardiac autonomic changes, since specific tests for CAN are not routinely performed by most clinicians because of its complex implementation.
The relevance of this finding is evidenced not only by the symptoms involved with this condition, but also by increased vascular risk already recognized in these patients. Thus, those patients in whom the alterations were identified to be suggestive of autonomic dysfunction, even if at an initial stage, should be more closely investigated for microvascular complications and have their modifiable risk factors such as blood pressure and glycemic control, more tightly controlled.
Conclusion
Alteration of cardiac chronotropism evaluated by ET is a manifestation of CAN and is associated with the presence of microvascular complications, specifically DR and DN. Additional studies are needed to know what are the values of HR variation that may indicate increased risk for the presence or development of these complications.
References
1. Ko SH, Park SA, Cho JH, Song KH, Yoon KH, Cha BY, et al. Progression of cardiovascular autonomic dysfunction in patients with type 2 diabetes: a 7-year follow-up study. Diabetes Care. 2008;31(9):1832-6.
2. Tesfaye S, Chaturvedi N, Eaton SE, Ward JD, Manes C, Ionescu-Tirgoviste C, et al. Vascular risk factors and diabetic neuropathy. N Engl J Med. 2005;352(4):341-50.
3. Rolim LC, Sá JR, Chacra AR, Dib SA. Diabetic cardiovascular autonomic neuropathy: risk factors, clinical impact and early diagnosis. Arq Bras Cardiol. 2008;90(4):e24-31.
4. Vinik AI, Maser RE, Mitchell BD, Freeman R. Diabetic autonomic neuropathy. Diabetes Care. 2003;26(5):1553-79.
5. Maser RE, Mitchell BD, Vinik AI, Freeman R. The association between cardiovascular autonomic neuropathy and mortality in individuals with diabetes: a meta-analysis. Diabetes Care. 2003;26(6):1895-901.
6. Kramer CK, Leitão CB, Azevedo MJ, Valiatti FB, Rodrigues TC, Canani LH, et al. Diabetic retinopathy is associated with early autonomic dysfunction assessed by exercise-related heart rate changes. Braz J Med Biol Res. 2008;41(12):1110-5.
7. Pecis M, Azevedo MJ, Moraes RS, Ferlin EL, Gross JL. Autonomic dysfunction and urinary albumin excretion rate are associated with an abnormal blood pressure pattern in normotensive normoalbuminuric type 1 diabetic patients. Diabetes Care. 2000;23(7):989-93.
8. Garcia C, Mayaudon H, Bordier L, Le Berre JP, Dupuy O, Bauduceau B. Modifications of 24-h blood pressure profile associated with reduction of
the heart rate variability in type 1 diabetic patients. Arch Mal Coeur Vaiss. 2007;100(8):699-703.
9. Bilal N, Erdogan M, Ozbek M, Cetinkalp S, Karadeniz M, Ozgen AG, et al. Increasing severity of cardiac autonomic neuropathy is associated with increasing prevalence of nephropathy, retinopathy, and peripheral neuropathy in Turkish type 2 diabetics. J Diabetes Complications. 2008;22(3):181-5.
10. Chen HT, Lin HD, Won JG, Lee CH, Wu SC, Lin JD, et al. Cardiovascular autonomic neuropathy, autonomic symptoms and diabetic complications in 674 type 2 diabetes. Diabetes Res Clin Pract. 2008;82(2):282-90.
11. Forsén A, Kangro M, Sterner G, Norrgren K, Thorsson O, Wollmer P, et al. A 14-year prospective study of autonomic nerve function in Type 1 diabetic patients: association with nephropathy. Diabet Med. 2004;21(8):852-8.
12. Maguire AM, Craig ME, Craighead A, Chan AK, Cusumano JM, Hing SJ, et al. Autonomic nerve testing predicts the development of complications: a 12-year follow-up study. Diabetes Care. 2007;30(1):77-82.
13. Astrup AS, Tarnow L, Rossing P, Hansen BV, Hilsted J, Parving HH. Cardiac autonomic neuropathy predicts cardiovascular morbidity and mortality in type 1 diabetic patients with diabetic nephropathy. Diabetes Care. 2006;29(2):334-9.
15. Shetler K, Marcus R, Froelicher VF, Vora S, Kalisetti D, Prakash M, et al. Heart rate recovery: validation and methodologic issues. J Am Coll Cardiol. 2001;38(7):1980-7.
16. Rodrigues TC, Pecis M, Canani LH, Schreiner L, Kramer CK, Biavatti K, et al. Characterization of patients with type 1 diabetes mellitus in southern Brazil: chronic complications and associated factors. Rev Assoc Med Bras. 2010;56(1):67-73.
17. Fletcher GF, Balady G, Froelicher VF, Haartley LH, Haskell WL, Pollock ML. Exercise standards: a statement for health acre professionals from the American Heart Association. Writing Group. Circulation. 1995;91(2):580-615. 18. Gross JL, de Azevedo MJ, Silveiro SP, Canani LH, Caramori ML, Zelmanovitz
T. Diabetic nephropathy: diagnosis, prevention, and treatment. Diabetes Care. 2005; 28(1):164-76.
19. Friedewald WT, Levy RI, Fredrickson DS. Estimation of the concentration of low-density lipoprotein cholesterol in plasma without use of the preparative ultracentrifuge. Clin Chem. 1972;18(6):499-502.
20. Monteagudo PT, Nóbrega JC, Cezarini PR, Ferreira SR, Kohlmann O Jr, Ribeiro AB, et al. Altered blood pressure profile, autonomic neuropathy and nephropathy in insulin-dependent diabetic patients. Eur J Endocrinol. 1996;135(6):683-8.