Universidade de Aveiro
2015
Departamento de Ciências Médicas
Ana Raquel
Gonçalves
Pandeirada
Associação
entre
polimorfismos
genéticos
comuns do metabolismo lípidico e o risco de
adenocarcinoma colo-retal esporádico
Association between common lipid metabolism
genes polymorphisms and sporadic colorectal
adenocarcinoma risk
Dissertação apresentada à Universidade de Aveiro para cumprimento dos requisitos necessários à obtenção do grau de Mestre em Biomedicina molecular, realizada sob a orientação científica da Professora Mestre Sandra dos Santos Caramujo Balseiro, Professora assistente na Escola Superior de Saúde Dr. Lopes Dias do Instituto Politécnico de Castelo Branco, e sob a co-orientação da Professora Doutora Odete Abreu Beirão da Cruz e Silva, Professora auxiliar no Departamento de Ciências Médicas da Universidade de Aveiro.
Este trabalho contou com a colaboração do Instituto de Anatomia Patológica e Patologia Molecular da Faculdade de Medicina da Universidade de Coimbra e foi financiado pelos projetos da CIMAGO (projeto nº17/2009) e do GAI (projeto LCarvalho.GAI2015) da FMUC.
o júri
Presidente PProfessora Doutora Ana Gabriela da Silva Cavaleiro Henriques Prof. Associada do Departamento de Ciências Médicas, Universidade de Aveiro
Professora Mestre Sandra dos Santos Caramujo Balseiro Prof. Assistente da Escola Superior de Saúde Dr. Lopes Dias, Instituto Politécnico de Castelo Branco
Professora Doutora Lina Maria de Rodrigues Carvalho Prof. Agregada da Faculdade de Medicina,
Agradecimentos A realização desta dissertação de mestrado foi possível graças ao apoio de várias pessoas imprescindíveis, as quais gostaria de deixar o meu agradecimento.
Quero começar por agradecer à minha orientadora, Sandra Balseiro por todo o apoio, colaboração e partilha de ensinamentos durante a realização desta tese. Pelas opiniões e críticas, e também pela sua amizade e enorme paciência.
À Maria João, Natália, Patrícia, Sofia, Tiffany e Zé pedro por todo o apoio no laboratório mas também pela sua amizade. Também quero agradecer à Maria pela bondade que demonstrou sempre que tinha alguma dúvida e por me incentivar nas decisões mais difíceis.
À Diretora do Instituto de Anatomia Patológica da Faculdade de Medicina da Universidade de Coimbra pela oportunidade de realizar a minha tese de mestrado neste serviço.
Ao meu Pai (e mãe) um muito obrigado por todo o apoio incondicional e incentivo na superação dos obstáculos que surgiram durante este percurso. Principalmente por toda a sua positividade e força que me transmite todos os dias. Também por todas as “ferramentas” e ensinamentos transmitidos permitindo ser a pessoa que sou hoje.
À minha mãe e à minha madrasta, que apesar de estarem presentes apenas em pensamento sei que me dão força todos os dias para ultrapassar os momentos mais difíceis e lutar pelos meus sonhos. Em especial à minha madrasta, Lucinda, que sempre acreditou em mim e ensinou-me a ver sempre algo bom mesmo nas piores coisas e fases da vida, mostrando-me que para se conseguir algo tem que se lutar.
Aos meus avós, por todo o aconchego.
Ao meu namorado, David, por todo o carinho, companheirismo e apoio durante este percurso, essencialmente, por toda a compreensão que teve comigo nestes últimos meses, pois o tempo era sempre contado. Também por me apoiar em todas as decisões, mesmo nas mais difíceis.
Às minhas grandes amigas, o meu grande pilar, Lurdes e Rita, pela sua enorme amizade, ajuda, concelhos, disponibilidade, gargalhadas nos dias mais difíceis e por provarem todos os dias que as amizades verdadeiras e puras realmente existem. Quero agradecer por apesar da distância a que vivemos umas das outras, estão sempre presentes e prontas para ouvir os meus desabafos.
À Cristiana, Bela, Mariana, Catarina, Marcela, Inês e Patrícia por toda a amizade e apoio.
À CIMAGO (projeto nº17/2009) e ao GAI (projeto LCarvalho.GAI2015) pelo financiamento.
palavras-chave Adenocarcinoma colo-rectal esporádico, metabolismo lípidico, APOA1, APOB, APOC3, APOE, CETP, NPY, PON1, PPARG, polimorfismos comuns.
resumo Os lípidos podem modular o risco de desenvolver Adenocarcinoma Colo-rectal Esporádico (ACE), uma vez que alterações nas vias do metabolismo e do transporte lipídico podem influenciar diretamente a absorção do colesterol e dos lípidos pelas células do cólon e indiretamente a síntese de espécies reativas de oxigénio (ERO) no reto, devido à acumulação de lípidos. O metabolismo lipídico é regulado por várias proteínas (APOA1, APOB, APOC3, APOE, CETP, NPY, PON1, PPARG) que podem influenciar o metabolismo e o transporte de lípidos. Tem sido reportados nestes genes, vários polimorfismos comuns (SNP) que podem alterar a sua função e/ ou a expressão, causando um desequilíbrio no metabolismo dos lípidos. Estas alterações genéticas podem influenciar o desenvolvimento de ACE, no entanto a maioria dos polimorfismos nunca foram estudados nesta patologia. Além disso, existem resultados contraditórios entre alguns dos polimorfismos e o risco de ACE. Deste modo, o objetivo deste estudo foi explorar e descrever o efeito dos polimorfismos comuns de genes associados ao metabolismo lipídico (APOA1 -75 G>A; APOB R3500Q; APOC3 C3175G, APOC3 T3206G;
APOE Cys112/158Arg; CETP G279A, CETP R451Q; NPY Leu7Pro; PON1
Q192R; PPARG Pro12Ala) no ACE e a sua relação com o risco de desenvolver ACE.
A genotipagem dos polimorfismos comuns de genes associados ao metabolismo lipídico (APOA1 -75 G>A; APOB R3500Q; APOC3 C3175G,
APOC3 T3206G; APOE Cys112/158Arg; CETP G279A, CETP R451Q;
NPY Leu7Pro; PON1 Q192R; PPARG Pro12Ala) foi efetuada pela técnica de PCR-SSP, a partir de biópsias incluídas em parafina e fixadas em formol de 100 indivíduos saudáveis e de 68 indivíduos com ACE.
Os genótipos mutantes APOA1 -75AA (32% vs 12%; p=0.001; OR=3.51; 95% CI 1.59-7.72); APOB 3500AA (7% vs 0%; p=0.01); APOC3 3175GG (19% vs 2%; p=0.0002; OR=11.58; 95% CI 2.52-53.22), APOC3 3206GG (19% vs 0%; p<0.0001); CETP 279AA (12% vs 1%; p=0.003; OR=13.20; 95% CI 1.61-108.17), CETP 451AA (16% vs 0%; p<0.0001); NPY 7CC (15% vs 0%; p<0.0001); PPARG 12GG (10% vs 0%; p=0.001); e o genótipo heterozigótico PON1 192AG (56% vs 22%; p<0.0001; OR=4.49; 95% CI 2.29-8.80) demonstraram estar associados à prevalência de ACE. Enquanto, o haplótipo mutante APOE E4/E4 (0% vs 8%; p=0.02) mostrou ter um efeito protetor no ACE. Adicionalmente, também foram encontradas diferenças entre a prevalência e a localização tumoral (cólon ou reto) para os genótipos APOB 3500GA, APOC3 3206TG, CETP 279AA e para o alelo PPARG 12Ala.
Estes resultados sugerem uma associação positiva entre a maioria dos polimorfismos genéticos comuns estudados envolvidos no metabolismo lipídico e a prevalência de ACE. A desregulação dos genes APOA1, APOB, APOC3, CETP, NPY, PON1,PPARG poderá estar associada com a diminuição dos níveis plasmáticos de colesterol e o aumento de ERO na mucosa do colon e do reto. Para além disso, estes resultados também suportam a hipótese de que o CCR esta relacionado com a diminuição da absorção intestinal e com o aumento da produção de ácidos biliares secundários. Adicionalmente, os polimorfismos estudados podem desempenhar um importante papel como biomarcadores de suscetibilidade para ACE.
keywords Sporadic colorectal adenocarcinoma, lipid metabolism, APOA1, APOB, APOC3, APOE, CETP, NPY, PON1, PPARG, common polymorphisms
abstract Lipids can modulate the risk of developing sporadic colorectal adenocarcinoma (SCA), since alterations into lipid metabolism and transport pathways influence directly cholesterol and lipids absorption by colonic cells and indirectly reactive oxygen species (ROS) synthesis in rectum cells due to lipid accumulation. Lipid metabolism is regulated by several proteins APOA1, APOB, APOC3, APOE, CETP, NPY, PON1 and PPARG that could influence both metabolism and transport processes. Is been reported that several common single-nucleotide polymorphisms (SNPs) in these genes could influence their function and/or expression, changing lipid metabolism balance. Thus, genetic changes in those genes can influence SCA development, once the majority of them were never studied in this disease. Furthermore, there are contradictory results between some studied polymorphisms and SCA risk. Thus, the aim of this study was to explore and describe lipid metabolism-associated genes common polymorphisms (APOA1 -75 G>A; APOB R3500Q; APOC3
C3175G, APOC3 T3206G; APOE Cys112/158Arg; CETP G279A, CETP R451Q; NPY Leu7Pro; PON1 Q192R; PPARG Pro12Ala) status among SCA, and their relationship with SCA risk.
Genotyping of common lipid metabolism genes polymorphisms (APOA1 -75 G>A; APOB R3500Q; APOC3 C3175G, APOC3 T3206G; APOE
Cys112/158Arg; CETP G279A, CETP R451Q; NPY Leu7Pro; PON1
Q192R; PPARG Pro12Ala) were done by PCR-SSP techniques, from formalin-fixed and paraffin-embedded biopsies of 100 healthy individuals and 68 SCA subjects.
Mutant genotypes of APOA1 -75AA (32% vs 12%; p=0.001; OR=3.51; 95% CI 1.59-7.72); APOB 3500AA (7% vs 0%; p=0.01); APOC3 3175GG (19% vs 2%; p=0.0002; OR=11.58; 95% CI 2.52-53.22), APOC3 3206GG (19% vs 0%; p<0.0001); CETP 279AA (12% vs 1%; p=0.003; OR=13.20; 95% CI 1.61-108.17), CETP 451AA (16% vs 0%; p<0.0001); NPY 7CC (15% vs 0%; p<0.0001); PPARG 12GG (10% vs 0%; p=0.001); and heterozygote genotype PON1 192AG (56% vs 22%; p<0.0001; OR=4.49; 95% CI 2.29-8.80) were found associated with SCA prevalence. While, APOE E4/E4 (0% vs 8%; p=0.02) mutant haplotype seemed to have a protective effect on SCA. Moreover, it also been founded differences between APOB
3500GA, APOC3 3206TG, CETP 279AA genotypes and PPARG 12Ala allele prevalence and tissue localization (colon vs rectum).
These findings suggest a positive association between most of common lipid metabolism genes polymorphisms studied and SCA prevalence. Dysregulation of APOA1, APOB, APOC3, CETP, NPY, PON1 and PPARG
genes could be associated with lower cholesterol plasma levels and increase ROS among colon and rectum mucosa. Furthermore, these results also support the hypothesis that CRC is related with intestinal lipid absorption decrease and secondary bile acids production increase. Moreover, the polymorphisms studied may play an important role as biomarkers to SCA susceptibility.
Index
Abbreviations……… 16
Capther I: Introduction …..………. 20
1. Introduction ... 22
1.1. Epidemiology of colorectal cancer ... 23
1.1.1. Incidence and mortality ... 23
1.1.2. Etiology ... 25
1.2. Histological classification ... 26
1.3. Environmental and genetic risk factors ... 28
1.4. Lipid metabolism genes and CRC ... 29
1.4.1. Apolipoprotein A (APOA1) ... 32
1.4.2. Apolipoprotein B (APOB) ... 33
1.4.3. Apolipoprotein C3 (APOC3) ... 34
1.4.4. Apolipoprotein E (APOE) ... 36
1.4.5. Cholesterol ester transfer protein (CETP) ... 37
1.4.6. Neuropeptide Y (NPY) ... 38
1.4.7. Paraoxonase 1 (PON1) ... 39
1.4.8. Peroxisome proliferator-activated receptor gamma (PPARG) ... 40
1.5. Lipid transport and metabolism genes in Sporadic Colorectal Cancer (SCA) ... 41
Capther II: Materials and methods ………..………. 44
2. Materials and methods ... 46
2.1. Biological samples ... 46
2.2. DNA extraction ... 47
2.2.1. Analysis of concentration and quality of the extracted DNA ... 48
2.3. Genotyping ... 48
2.3.1. Amplification by Polymerase Chain Reaction-Sequence Specific Primers (PCR-SSP) ... 49
2.3.2. Electrophoresis in agarose gel ... 50
2.4.1. Analysis of purity and concentration of DNA ... 51
2.4.2. Allele and genotype frequencies of polymorphisms ... 51
Capther III: Results ………..……….………. 42
3. Results ... 54
3.1. Clinical pathology data ... 54
3.2. Analysis of DNA purity and concentration ... 54
3.3.1. APOA1 -75 G>A, APOB R3500Q, APOC3 C3175G, APOC3 T3206G and APOE Cys112/158Arg distribution among SCA and controls ... 56
3.3.2. CETP G279A and CETP R451Q (G>A) polymorphisms distribution among SCA and controls ... 59
3.3.3. NPY Leu7Pro, PON1 Q192R (A>G) and PPARG Pro12Ala polymorphisms distribution among SCA and controls ... 62
3.4. Lipid metabolism genes polymorphisms in SCA stratified by clinical pathological features ………..……… 65
3.4.1. Gender ... 65
3.4.2. Tumour localization ... 68
Capther IV: Discussion ……….……..………. 74
4. Discussion... 76
4.1. Influence of common lipid metabolism genes polymorphism among SCA and controls ... 78
4.1.1. Influence of APOA1 polymorphism in SCA ... 79
4.1.2. Influence of APOB polymorphism in SCA ... 80
4.1.3. Influence of APOC3 polymorphisms in SCA ... 81
4.1.4. Influence of APOE polymorphisms in SCA ... 81
4.1.5. Influence of CETP polymorphisms in SCA ... 82
4.1.6. Influence of NPY polymorphism in SCA ... 83
4.1.7. Influence of PON1 polymorphism in SCA ... 83
4.1.8. Influence of PPARG polymorphism in SCA ... 84
4.2. Influence of lipid transport and metabolism genes polymorphisms in SCA ... 84
4.4. Distinction between colonic and rectal adenocarcinomas... 85
4.5. Future perspectives ... 86
4.6. Study limitations ... 87
Capther V: Conclusion ………..……….………. 88
5. Conclusion ... 90
Capther VI: References ………..………. 92
6. References ... 94
Capther VII: Appendix ………..………..………. 112
Figures Index
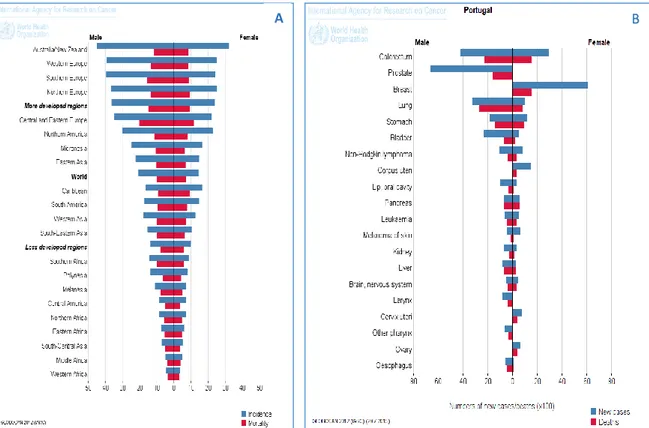
Figure 1. Epidemiology. (A) Colorectal cancer incidence and mortality to both genres in
the worldwide. (B) News cases and deaths of different cancers in Portugal. ... 24
Figure 2. Schematic classification of colorectal cancers. ... 26
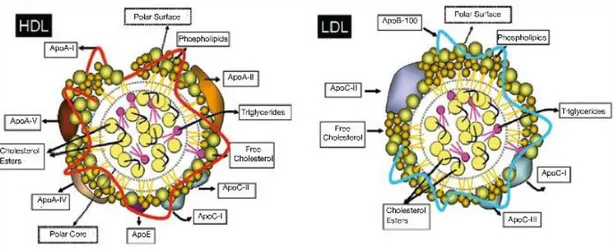
Figure 3. Schematic of high density lipoproteins (HDL) and low density lipoproteins (LDL) structure. Apo indicates apolipoprotein. ... 30
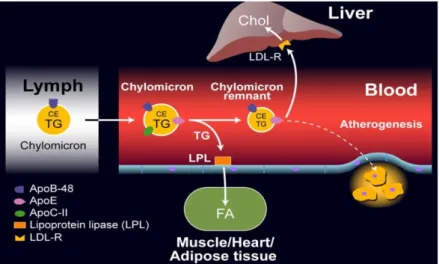
Figure 4. Schematic representation of exogenous cholesterol transport pathway. ... 31
Figure 5. Schematic representation of endogenous cholesterol transport pathway. ... 31
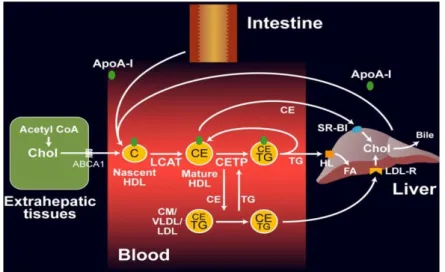
Figure 6. Schematic representation of reverse cholesterol transport pathway. ... 32
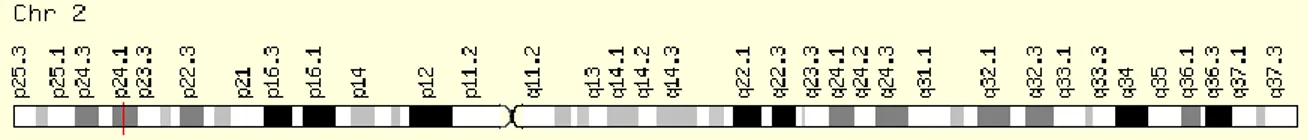
Figure 7. Cytogenetic localization of APOA1 gene. ... 33
Figure 8. Cytogenetic localization of APOB gene. ... 34
Figure 9. Representation APOC3 effects in lipoprotein metabolism pathways. APOC3 can modulate enzymes that are involved in cholesterol transport from extrahepatic tissues to the liver. APOC3 inhibits (↓) LCAT activity, VLDL TGs clearance and TRLs lipolysis. Furthermore, APOC3 also stimulates (↑) CETP activity. ... 35
Figure 10. Cytogenetic localization of APOC3 gene. ... 36
Figure 11. Cytogenetic localization of APOE gene. ... 37
Figure 12. Cytogenetic localization of CETP gene. ... 38
Figure 13. Cytogenetic localization of NPY gene. ... 39
Figure 14. Effect of dietary components on regulation of PON1 activity and its interaction with genetic factors. ... 39
Figure 15. Cytogenetic localization of PON1 gene. ... 40
Figure 16. Cytogenetic localization of PPARG gene. ... 41
Figure 17. (A), (B) Histologic image of normal colonic mucosa: 40x HE (Haematoxylin-eosin), 200x HE; (C), (D) Histological image of well differentiated sporadic colorectal adenocarcinoma (According to WHO criteria). 100x HE; 200x HE. Images from IAP-FMUC. ... 46
Figure 18. Allele and genotype frequencies of apolipoproteins genes polymorphisms
among the SCA and controls subjects: (A) Allele frequencies and (B) Genotype frequencies of APOA1 -75 G>A; (C) Allele frequencies and (D) Genotype frequencies of APOB R3500Q;
(E) Allele frequencies and (F) Genotype frequencies of APOC3 C3175G; Genotype
frequencies of (G) APOC3 T3206G and (H) APOE Cys112/158Arg (* p≤0.05; **p≤0.001; ***p≤0.0001). ... 57
Figure 19. Allele and genotype frequencies of CETP gene polymorphisms among SCA and
controls subjects: (A) Allele frequencies and (B) Genotype frequencies of CETP G279A; (C) Allele frequencies and (D) Genotype frequencies of CETP R451Q (G>A) (**p≤0.001; ***p≤0.0001). ... 60
Figure 20. Allele and genotype frequencies distribution among SCA and controls subjects: (A) Allele and (B) Genotype frequencies of NPY Leu7Pro polymorphism; (C) Allele and (D)
Genotype frequencies of PON1 Q192R (A>G) polymorphism; (E) Allele and (F) Genotype frequencies of PPARG Pro12Ala polymorphism (*p≤0.05; **p≤0.001; ***p≤0.0001). ... 63
Figure 21. Allele frequencies of PPARG Pro12ala in (A) Colon SCA and Rectum SCA (B)
Rectum SCA and control subjects (*p≤0.05; **p≤0.001). ... 70
Figure 22. Genotype frequencies in Colon SCA and Rectum SCA to (A) APOB R3500Q, (B)
APOC3 T3206G and (C) CETP G279A (*p≤0.05). ... 71
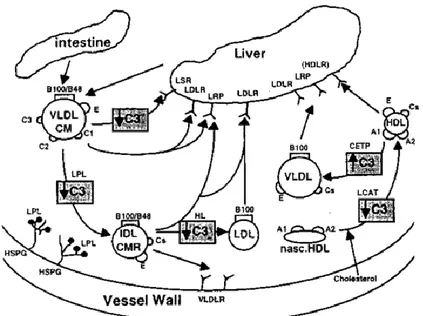
Figure 23. Diagram of SCA progression and development from increase of bile acid levels
Tables Index
Table 1. Estimated incidence, mortality and 5-year prevalence for colorectal cancer, in
World, Europe and Portugal to men and women... 24
Table 2. Histological classification according to the 7th version (2012) from World Health Organization (WHO). ... 27
Table 3. Clinical pathological data SCA and controls. ... 47
Table 4. Lipid metabolism common polymorphisms analyzed in this study. ... 49
Table 5. Protocol of the program to amplification by PCR-SSP (Polymerase Chain Reaction – Sequence Specific Primers), from Genebox, Cantanhede – Portugal. ... 50
Table 6. Gender distribution among colon and rectum groups. ... 54
Table 7. Means and standard-deviations of DNA samples purity and concentration values ... 55
Table 8. Allele frequencies distribution of APOA1 -75 G>A, APOB R3500Q, APOC3 C3175G, APOC3 T3206G and APOE Cys112/158Arg among SCA and control subjects. ... 58
Table 9. Genotype frequencies distribution of APOA1 -75 G>A, APOB R3500Q, APOC3 C3175G, APOC3 T3206G and APOE Cys112/158Arg among SCA and control subjects. ... 59
Table 10. Allele frequencies distribution of CETP G279A and CETP R451Q (G>A) among SCA and control subjects. ... 61
Table 11. Genotype frequencies distribution of CETP G279A and CETP R451Q (G>A) among SCA and control subjects. ... 61
Table 12. Allele frequencies distribution of NPY Leu7Pro, PON1 Q192R (A>G) and PPARG Pro12Ala among SCA and control subjects. ... 64
Table 13. Genotype frequencies distribution of NPY Leu7Pro, PON1 Q192R (A>G) and PPARG Pro12Ala among SCA and control subjects. ... 64
Table 14. Allele frequencies distribution between genders. ... 65
Table 15. Genotype frequencies distribution between genders. ... 66
Table 16. Allele frequencies distribution in colon versus rectum SCA. ... 68
Table 17. Allele frequencies of PPARG Pro12Ala distribution among colon SCA and controls subjects. ... 70
Table 18. Allele frequencies of PPARG Pro12Ala distribution among rectum SCA and
controls subjects. ... 70
Table 19. Genotype frequencies distribution in colon and rectum SCA samples. ... 72 Table 20. Hardy-Weinberg Equilibrium to common lipid metabolism genes
Common lipid metabolism genes polymorphisms and SCA risk | Pandeirada R. 2015 16
Abbreviations
ABCA1 ATP-binding cassette transporter A1 ABCG1 ATP-binding cassette transporter G1
APC Adenomatous polyposis coli
APOA1 Apolipoprotein 1 APOB Apolipoprotein B APOC3 Apolipoprotein C3 APOE Apolipoprotein E BAs Bile acids
BAs I Bile acids primary BAs II Bile acids secundary BMI Body mass index
CETP Cholesterol esters transport protein CI Confidence interval
CIN Chromosomal instability CM Chylomicrons
CRC Colorectal cancer CVD Cardiovascular diseases
EGFR Epidermal growth factor receptors FAP Familiar adenomatous polyposis FDB Familial defective apolipoprotein B-100 FFA Free fatty acid
FFPE Formalin-fixed and paraffin-embedded FH Familial hypercholesterolemia
GWAS Genome-wide association studies HE Haematoxylin-eosin
HDL High density lipoprotein
HDL-C High density lipoprotein - cholesterol IDL Intermediary density lipoprotein
Common lipid metabolism genes polymorphisms and SCA risk | Pandeirada R. 2015 17
LDL Low density lipoprotein
LDL-C Low density lipoprotein-cholesterol LDL-R Low density lipoprotein receptor LOH Loss of heterozygosity
LOOHs Hydroperoxides LPL Lipoprotein lipase MMR Mismatch repair
MSI Microsatellite instability NF-B Nuclear factor kappa B NPY Neuropeptide y
OD Optical density OR Odds ratio
PCR-SSP Polymerase chain reaction – sequence specific primers PKC Protein kinase C
PON1 Paraoxonase 1
PPARG Peroxisome proliferator-activated receptor gamma PTEN Phosphatase and tensin homolog
RNS Reactive nitrogen species ROS Reactive oxygen species
RR Relative risk
SCA Sporadic colorectal adenocarcinoma SNP Single-nucleotide polymorphism SR-B1 Scavenger receptor class B1
STAT3 Signal transducer and activator of transcription 3 VLDL Very low density lipoprotein
VLDL-C Very low density lipoprotein-cholesterol WHO World health organization
Wt Wild-type
TAE Tris-Acetate-EDTA TG Triglyceride
Common lipid metabolism genes polymorphisms and SCA risk | Pandeirada R. 2015 18
TRLs Triglyceride rich lipoproteins UV Ultra-violet
Common lipid metabolism genes polymorphisms and SCA risk | Pandeirada R. 2015 20
Chapter I
Introduction
Common lipid metabolism genes polymorphisms and SCA risk | Pandeirada R. 2015 22
1. Introduction
Colorectal cancer (CRC) is the fourth most common cancer cause of death worldwide.1 CRC is a serious health problem, a challenge for research, and a model for studying the molecular mechanisms involved in its development.2 This pathology comprehends to types of tissue structures colon (constituted by four sections, such as, ascending colon located on the right side, transverse colon, descending colon located on the left side and sigmoid colon) and rectum.3 Colon mucosa has multiple tubular invaginations called “crypts of Lieberkuhn”, that are wide, deep, and numerous, along the surface of its epithelium and in which the regeneration of the epithelium takes place. Because of its biological nature, the colon has a high level of cellular regeneration and a physical, chemical, and biological nature, which increases the possibility of developing several pathologies, including cancer.2 Rectum is located between sigmoid colon and anal canal, it has among 12 to 16 cm long and can be subdivided in three parts: upper rectum, middle rectum and lower rectum. Histologically is identical with colon, constituted by mucosa, submucosa, muscularis and serosa. Mucosa is constituted by typical intestinal epithelium. At anal transitional zone the columnar epithelium flattens becomes a stratified squamous non-keratinized epithelium. Submucosa contains loose connective tissue with blood vessels, lymph follicles and the Meissner's plexus. Lastly, muscularis has the typical inner circular and outer longitudinal musculature between which the Auerbach’s plexus.4
CRC development involves one or more genetically altered cells and requires many years to progress5, with a multistep process that affords nutrients an opportunity to modify the evolution of the disease. Many different dietary nutrients, such as lipids, contact epithelial cells in the colonic crypts both from the lumenal contents of the colon and from the basolateral epithelial cell membranes, thereby influencing developmental processes in both normal and transformed colonic epithelial cells.6 On other hand, rectum tissues are in contact with diet waste, including lipids that are not transported into blood stream. There are vary genetic and environmental factors involved in CRC development, namely, genes involved in metabolic processes, including lipid metabolism.7,8 There are many authors that referred an association between CRC, low cholesterol intestinal
Common lipid metabolism genes polymorphisms and SCA risk | Pandeirada R. 2015 23
absorption9,10,11 and high secondary bile acids excretion thru feces12. Additionally, single-nucleotide polymorphisms (SNP’S) in lipid metabolism genes also are determinants potentials involved in progression of CRC, being this topic more development in environmental and genetic factors.8
1.1. Epidemiology of colorectal cancer
1.1.1. Incidence and mortality
Every year more than 1,2 million patients are diagnosed with CRC , and more 600 000 die in the world with CRC.1 CRC represents 12.9% of all newly diagnosed cancers and is responsible for 12.2% of all cancer deaths, in Europe.13 CRC is the third most common cancer in men (746,000 cases, 10.0% of the total) and the second in woman (614,000 cases, 9.2% of the total) worldwide. However, CRC is not uniformly common throughout the world, about 55% of the cases occur in more developed countries (Figure 1.A). But, its mortality is higher in less developed regions because medical resources privation (Figure 1.A).14
In Portugal, CRC incidence also has been increased in recent decades; it presents a large variety, depending on the geographical region.According to 2012 data, the CRC is the cancer with higher incidence and mortality among both genders (Figure 1.B).14 Furthermore, deaths by CRC increased 3% per year between 2000 and 2005 and the overall survival rates at 1, 3 and 5 years are estimated at 73%, 55% and 46%, respectively.13
Common lipid metabolism genes polymorphisms and SCA risk | Pandeirada R. 2015 24
Figure 1. Epidemiology. (A) Colorectal cancer incidence and mortality to both genres in the worldwide. (B) News cases and deaths of different cancers in Portugal.14
Generally, according to the Globocan 2012 data, in Portugal, Europe and worldwide there is a high incidence and mortality for CRC, it can be stated that approximately half of those who diagnose this tumour die. Also, is estimated that the prevalence of CRC in both genders should duplicate in a five years range (Table 1).15
Table 1. Estimated incidence, mortality and 5-year prevalence for colorectal cancer, in World, Europe and Portugal to men and women.15
Region Gender
Number of cases
Incidence Mortality 5-year prevalence
Colorectal cancer World Men 746298 373639 1953431 Women 614304 320294 1590151 Europe Men 241813 113246 656384 Women 205323 101620 547559 Portugal Men 4209 2240 11581 Women 2920 1557 8032 A B
Common lipid metabolism genes polymorphisms and SCA risk | Pandeirada R. 2015 25
The rapid increases in the previously low-risk countries, such as Spain and several countries in eastern Europe and east Asia, have been noted, which have been ascribed to changes in dietary patterns and risk factors towards a so-called western lifestyle.16,17 However, in the USA and several other high income countries, incidence has stabilized or started to decrease, probably because of increased use of sigmoidoscopy and colonoscopy with polypectomy.3,18,19,20 In several high-income countries and countries of east Asia and eastern Europe, mortality has been decreasing since the 1980s, probably because of improved early detection and treatment.18 Nevertheless, rates are still increasing in countries or areas with poor health-care resources, including countries in Central and South America21 and rural areas in China22.
The increase of CRC cases number in the last thirty years is strongly linked to changes in lifestyle and exposure to carcinogens. The gradual abandonment of the Mediterranean diet23, increased caloric intake, increased intake of animal fats24 and red meats25, increased obesity and sedentary lifestyle26, as well as tobacco consumption are strong contributors to the increase in CRC incidence.19
1.1.2. Etiology
There are three different types of CRC development that can be distinguished: sporadic; family; and hereditary form. About 60-85% of CRC cases are sporadic type that occurs in patients with advanced ages. Sporadic cancers are caused by genetic abnormalities in tumour suppressor genes and oncogenes that give cells an evolutionary advantage over their neighbors. However, hereditary and familial CRC forms, are responsible for 5-10% and 10-30% of the cases, respectively.2 Hereditary non-polyposis colorectal cancer (Lynch Syndrome) is the most common form of hereditary CRC. It is inherited in autosomal dominant fashion, its clinical consequences develop from germline mutations in mismatch repair (MMR) genes, where occurs the inactivation of the repair system.27 Other hereditary syndrome, is familiar adenomatous polyposis (FAP) that is characterized by numerous of adenomatous colorectal polyps. FAP is an autosomal dominant hereditary cancer syndrome caused by a germline mutation in the APC gene
Common lipid metabolism genes polymorphisms and SCA risk | Pandeirada R. 2015 26
(adenomatous polyposis coli), being the first molecular event in the progress of sporadic colorectal adenocarcinoma.28,29,30
These CRC forms can develop through different genetic pathways. The chromosomal instability (CIN) pathway occurs in 80-85% of the CRC (Figure 2), known as the adenoma-carcinoma sequence.27,31,32,33 In inherited and sporadic tumours it has been demonstrated several alterations in specific genes, involved acquisition of a new or increased oncogenes function and tumour suppressor genes function loss. The genetic changes include tumour suppressor genes APC (chromosome region 5q21) and TP53 (chromosome region 17p13) function loss, proto-oncogenes (K-ras) activation and heterozygosity for the long arm of chromosome 18q (DCC, SMAD2, SMAD4) LOH loss.5,34,35,36 Beyond this, aneuploidy, amplifications, and translocations are also common in these tumours. Other genetic pathway, present in 15% of CRC cases, is microsatellite instability (MSI) characterized by DNA mismatch repair (MMR) system proficiency loss (Figure 2).27
Figure 2.Schematic classification of colorectal cancers.27
1.2. Histological classification
More than 90% of CRC are adenocarcinoma's; its origin comes from colorectal mucosa epithelial cells. Conventional adenocarcinoma is characterized by glandular formation, which is the basis for histologic tumour grading. In well differentiated
Common lipid metabolism genes polymorphisms and SCA risk | Pandeirada R. 2015 27
adenocarcinoma's (Stage I) >95% of tumours are gland forming. Moderately differentiated adenocarcinoma's (Stage II) show 50-95% gland formation. Poorly differentiated adenocarcinoma's (Stage III) are mostly solid with <50% gland formation. In general, most colorectal adenocarcinoma's (±70%) are diagnosed as moderately differentiated. Well and poorly differentiated adenocarcinoma's account for 10% and 20%, respectively. Invasive colorectal adenocarcinoma's may be seen dysplasia in adjacent mucosa. Cells with high-grade dysplasia exhibit rounded nuclei, coarse chromatin, prominent nucleoli, and loss of nuclear polarity with nuclei no longer being oriented perpendicular to the basement membrane.37,38 Histological classification of CRC is based upon the most recent classification version (7th edition, 2012) according to World Health Organization (WHO) (Table 2).39
Table 2. Histological classification according to the 7th version (2012) from World Health Organization (WHO).39
Common lipid metabolism genes polymorphisms and SCA risk | Pandeirada R. 2015 28
1.3. Environmental and genetic risk factors
Development and progression of CRC could be influenced by several risk factors, namely, genetic and environmental factors. These factors include advanced age; family and medical histories of benign adenomatous polyps and inflammatory bowel diseases; low vegetables and fruits intake; high red and processed meat intake25; smoking habits; excessive alcohol consumption; physical inactivity; obesity26; and diabetes.1,3,19,24 Furthermore, genetic alterations in tumour suppressor genes and oncogenes that are responsible for MSI; defects in the DNA mismatch repair; mutations; and SNPs in genes involved in the metabolic pathways also have been implicated in CRC.40 Individual genetic variants arrangements could affect sporadic CRC associated risk when combined with others environmental factors, especially with diet patterns.41
Diets with high fat-animal ingestions can influence highly carcinogenesis initial phases, appearing to be an important risk factor for CRC.6 Genome-wide association studies (GWAS) have identified SNPs in genes involved in the regulation of lipid biosynthesis, transport, and metabolism42, being some potentials susceptibility factors to CRC. SNPs are mutations with minor allele frequency of greater than 1% in at least one population.43 Those mutations are characterized by single nucleotide base pair insertions, deletion, or substitutions. SNPs location is also important, if SNP is in an intron, it may change the binding ability of transcription factors to the SNP area, thus influencing gene expression. On the other hand, if the SNP is located in the exon coding region it may affect the structure of the translated protein, which may affect its sensitivity to upstream signal or effectiveness in downstream function.40 Interestingly, some SNPs are associated with specific ethnic groups or geographic ancestral subpopulations. Effects of lipid metabolism genes polymorphisms associated with CRC risk can be mediated and modified through their implication in energy balance, dietary patterns, obesity or physical activity.44
Common lipid metabolism genes polymorphisms and SCA risk | Pandeirada R. 2015 29
1.4. Lipid metabolism genes and CRC
Cancer is characterized by uncontrolled cell growth with increased proliferation, decreased apoptosis and improves migrating behavior of cells by promoting their ability to invade adjacent tissues and/or metastasize to non-adjacent organs and tissues. Cell proliferation requires duplication of all macromolecular components during each cell division.45 Aberrant lipid metabolism is a key feature of cancer cells development since cell proliferation requires increased lipid biosynthesis, and lipid catabolism produces bioactive molecules that act as signal molecules to regulate cancer metastasis.45 Lipids are hydrophobic or amphipathic small molecules, which are insoluble in water but soluble in nonpolar solvents. These molecules form plasma membranes enabling the maintenance of intracellular biological events and the response to changes in the extracellular medium. In living cells, lipids play essential functions, allowing the support of cellular structure, energy supply and participation in cell signaling.46 Lipid metabolism involves the activation and regulation of multiple signaling pathways. Thus, it enables various connection signaling pathways involved in cell growth regulation, proliferation, differentiation, survival, apoptosis, inflammation, motility and membrane homeostasis. In addition, it can change membrane composition and permeability causing disease development and progression, namely CRC. Three classical lipids (fatty acids, phospholipids and cholesterol) are dramatically increased and actively biosynthesized in cancer cells. Several evidences show that fatty acid synthase expression and activity are extremely low in nearly all nonmalignant adult tissues, whereas it is significantly up-regulated in solid cancers.45
Cholesterol is an essential constituent of cell membranes. It is the most frequent steroid in the organism, playing a physiological role. Cholesterol and triglycerides are insoluble in water molecules and are transported in association with proteins. Lipoproteins are complex particles with a central core containing cholesterol esters and triglycerides, a second layer is composed by free cholesterol and phospholipids delimited by apolipoproteins (Figure 3). Plasma lipoproteins are classified into seven classes which are based on their size, lipid composition and apolipoprotein: chylomicrons (CM) and the remaining chylomicrons, VLDL (very low density lipoprotein), IDL (Intermediary density
Common lipid metabolism genes polymorphisms and SCA risk | Pandeirada R. 2015 30
lipoprotein), LDL (Low Density Lipoprotein), HDL (High Density Lipoprotein). VLDL, IDL and LDL are pro-atherogenic, while HDL is anti-atherogenic.47
Figure 3. Schematic of high density lipoproteins (HDL) and low density lipoproteins (LDL) structure. Apo indicates apolipoprotein.48
Lipoproteins metabolism is divided in three pathways: exogenous diet associated (Figure 4); endogenous liver associated (Figure 5); and reverse cholesterol transport pathway (Figure 6).49 Lipoproteins play a central role in intake-lipid absorption and transport through the small intestine; in lipids transport from liver to peripheral tissues; and in lipids transport from peripheral tissues to liver and intestine (reverse transport). Exogenous pathway (Figure 4) begins with diet-lipids incorporation into chylomicrons on intestine. Thru circulation, triglyceride are transported in chylomicrons into muscles and adipose tissue here lipoprotein lipase (LPL) metabolize them forming chylomicron remnants, used as energy storage. Cholesterol (chylomicron remnants) is then carried into liver (where it can be used for VLDL and bile acids formation), or back to intestine through bile secretion.47
Common lipid metabolism genes polymorphisms and SCA risk | Pandeirada R. 2015 31
Figure 4. Schematic representation of exogenous cholesterol transport pathway.47
Endogenous pathway (Figure 5) begins at liver with VLDL formation. Triglycerides included in VLDL are metabolized and transported into muscle and adipose tissue. In circulation, lipoprotein lipase transforms VLDL into IDL, which is metabolized into LDL. LDL is then absorbed by its receptor in several tissues, including liver, being the predominant uptake site.47
Figure 5. Schematic representation of endogenous cholesterol transport pathway.47
Finally, reverse cholesterol transport (Figure 6) begins with HDL formation on liver and intestine. The small particles can acquire HDL cholesterol and phospholipids which are expelled out of cells, a process mediated by ATP-binding cassette transporter A1 (ABCA1) resulting in mature HDL formation. Mature HDL can get cholesterol from cells bias
ATP-Common lipid metabolism genes polymorphisms and SCA risk | Pandeirada R. 2015 32
binding cassette transporter G1 (ABCG1), scavenger receptor class B1 (SR-B1), or passive diffusion. Then HDL transports cholesterol directly into liver through interaction with hepatic SR-B1; or indirectly through VLDL or LDL cholesterol transfer by a process that is facilitated by CETP. 47
Figure 6. Schematic representation of reverse cholesterol transport pathway.47
Apolipoproteins play a structural level function; they act as ligands for receptors and drive lipoproteins formation. In addition to those functions, apolipoproteins also activate and inhibit lipoprotein metabolism enzymes. Thus, they control lipoprotein transport and metabolism, and their dysregulation has been identified in several pathologies. Major apolipoproteins involved in lipid metabolism are APOA1, APOB, APOC3 and APOE.50 In addition to these proteins, also CETP51, NPY52, PON153 and PPARG54 proteins play an essential role in lipid transport and metabolism. As described in the literature genes encoding these proteins contains polymorphic variant associated with various metabolic diseases.55,56,57,58,59,60,61,62,63
1.4.1. Apolipoprotein A (APOA1)
Apolipoprotein A1 (APOA1) is a 28-kD protein with 243 amino acid residues, being considered the major surface apoprotein of HDL-C in plasma.64,65 This molecule is produced primarily in liver (80%) and small intestine (10%)66, and includes more than 30%
Common lipid metabolism genes polymorphisms and SCA risk | Pandeirada R. 2015 33
of HDL mass and 70% of HDL protein.67 APOA1 functions as a cofactor of lecithin-cholesterol acyltransferase (LCAT) and it is a fundamental element of reverse lecithin-cholesterol transport process.68 Several studies have shown that the APOA1 gene displays a key role in tumour progress, inflammation, angiogenesis, invasion and metastasis.69 The increased APOA1 levels in patients with adenocarcinomas were associated with tumour progression and lymphatic invasion.70 According to recent findings APOA1 may be considered as a potential diagnosis and prognostics marker in several cancer types.69
APOA1 gene located on chromosome 11p23.24 (Figure 7) and have a common
polymorphism in promotor region, APOA1 -75 G>A (rs670).71,72 In this variant occurs the substitution of guanine (G) by adenine (A), that is associated with HDL-C concentrations and raised serum APOA1. This particular polymorphism occurs with an allele frequency of about 30% in the population general, being 15-20% among Caucasian population.73 Thus,
APOA1 -75A individuals have higher levels this molecule and/or HDL cholesterol than
those that have the wild type allele.65,74 APOA1 -75 promoter changes the answers of small and large HDL particle distribution to exercise training.67 Some recent studies reported and association between different HDL plasma levels and cancer susceptibility, including CRC.75,76
Figure 7. Cytogenetic localization of APOA1 gene. (Adapted from: http://www.genecards.org/cgi-bin/carddisp.pl?gene=APOA1&keywords=APOA1)
1.4.2. Apolipoprotein B (APOB)
Apolipoprotein B (APOB) is a key protein in the lipid transport and metabolism, such as plasma triglyceride (TG) and cholesterol.77 Moreover, it is the main apolipoprotein of chylomicrons, as well as VLDL, IDL, LDL particles.78 APOB is used as ligand for LDL recognition and catabolism, maintaining LDL particles integrity and LDL-C plasma levels control through receptors binding.79 APOB is produced primarily in hepatocytes and enterocytes. This molecule is present in lipoprotein particles and it presents two isoforms
Common lipid metabolism genes polymorphisms and SCA risk | Pandeirada R. 2015 34
in humans, APOB-100 and APOB-48. APOB-100, full-length protein containing 4536 amino acids residues, being an indispensable structural protein for VLDL formation and secretion, APOB-100 is expressed primarily in liver.77 The interactions among dietary and
APOB genetic variants could affect individual’s plasma lipid levels and body weight.80
APOB gene is located on short arm of chromosome 2p24.1 (Figure 8), and is
composed by 28 introns and 29 exons.81 Some studies demonstrate an association between the APOB SNPs and hypercholesterolemia in Spanish56 and Hungarian82 subjects. It has been reported that point mutations in APOB receptor-binding zone can disrupt binding and impair LDL removal from circulating. LDL receptor pathway regulates cholesterol plasma concentration. Thus, defects that occur in ligand (APOB) or receptor (LDL-R) could increase LDL plasma concentrations, resulting from inefficient clearance of LDL particles by its receptor. Consequently, it can lead to LDL particles accumulation in circulation that could increase the risk of pathologies related to cholesterol imbalance. An example of these mutations, is the APOB R3500Q variant (rs5742904)83, characterized by a G to A nucleotide transition, in exon 6 of APOB gene which origin an amino acid substitution (glutamine for arginine) at position 3500. 81,84,85 In Caucasian population the mutation frequency is very low, 1:500 to 1:700, but its frequency is much higher in several cholesterol dependent disorders, including cardiovascular and cancer diseases.86
Figure 8. Cytogenetic localization of APOB gene. (Adapted from: http://www.genecards.org/cgi-bin/carddisp.pl?gene=APOB&keywords=APOB)
1.4.3. Apolipoprotein C3 (APOC3)
Apolipoprotein C3 (APOC3) is a major component of VLDL and chylomicrons, and it is associated with triglyceride rich lipoproteins (TRLs) levels.87 This molecule is synthesized by the liver and intestine.88 APOC3 is an inhibitor of lipoprotein lipase and decreases liver´s absorption of TRL and its remnants (Figure 9). Several studies have
Common lipid metabolism genes polymorphisms and SCA risk | Pandeirada R. 2015 35
demonstrated that an increase of APOC3 plasma levels is strongly correlated with high triglycerides blood levels.57
Figure 9. Representation APOC3 effects in lipoprotein metabolism pathways. APOC3 can modulate enzymes that are involved in cholesterol transport from extrahepatic tissues to the liver. APOC3 inhibits (↓) LCAT activity, VLDL TGs clearance and TRLs lipolysis. Furthermore, APOC3 also stimulates (↑) CETP activity88
APOC3 gene is located in the long arm of chromosome 11q23 (Figure 10). This
gene is about 311kb length and it has 4 exons and 3 introns. Two common polymorphisms in APOC3 have been reported, C3175G (rs5128) and T3206G (rs4225), characterized by a C to G and T to G substitution, respectively. 57,89 A study performed in Han Chinese males of APOC3 C3175G variant demonstrated that triglyceride plasma level on mutant homozygous (GG genotype) carriers were higher than APOC3 3175CG genotype carriers and APOC3 3175CG genotype has higher triglyceride plasma levels than CC genotypes (wild-type). These results suggest that G APOC3 form may influence TG lipase synthesis. Although 3175G variant is associated with total cholesterol and LDL levels increase, APOC3 3206G mutant allele seems to have an inverse effect. A study demonstrated that APOC3 3175G mutation allele represents a risk factor and APOC3 3206G variant is a benefic factor for cardiovascular diseases, since it is associated with triglycerides blood levels reduction. 57 Nevertheless their role in CRC is not clear.
Common lipid metabolism genes polymorphisms and SCA risk | Pandeirada R. 2015 36
Figure 10.Cytogenetic localization of APOC3 gene. (Adapted from: http://www.genecards.org/cgi-bin/carddisp.pl?gene=APOC3&keywords=APOC3)
1.4.4. Apolipoprotein E (APOE)
Apolipoprotein (APOE) is a glycoprotein with a molecular mass of 34 kDa of 299 amino acids.90 This molecule is crucial for cholesterol transport, lipid metabolism and synthesis.91 In addition, this protein has shown to have an important role in lipid metabolism, angiogenesis, tumour cell growth, metastasis, antioxidant and immune activities.41 Thus, all these features make APOE a potential candidate in carcinogenesis development. Also, it has a significant metabolic function in the transport and lipids deliver from one tissue or cell type to another, it is synthesized and secreted by many tissues, liver, small intestine (only secrete), brain, skin, and tissue macrophages throughout the body. Furthermore, APOE is a component of VLDL particles.90
APOE gene is localized on long arm of chromosome 19q13.2 (Figure 11) and is
constituted for four exons and three introns.92 Some studies had showed that APOE exhibit multiple isoforms: E2, E3 and E4. Those variants combine in six different genotypes: three homozygous phenotypes (E2/2, E3/3, and E4/4) and three heterozygous phenotypes (E3/2, E4/2, and E4/3).90 All alleles are different in primary structure at two sites: residues 112 (rs429358) and 158 (rs7412).41 APOE*3 has a cysteine at residue 112 and arginine at residue 158, while APOE*4 has 2 arginine and APOE*2 has 2 cysteine in both 158/112 residues. APOE*2 and APOE*4 is associated with increased and decrease APOE levels, respectively.90 The presence of different APOE variants influences the enterohepatic metabolism of cholesterol and bile acids, which promote colorectal carcinogenesis.58,93,94 A study carried in Finland showed that the presence of APOE E4 allele could provide protection from adenoma and carcinoma development on proximal colon, due to reduced bile acids production.93 On the other hand, some studies demonstrate that women with high triglycerides levels and with one or two copies of
Common lipid metabolism genes polymorphisms and SCA risk | Pandeirada R. 2015 37
APOE E4 allele had four times higher risk of developing breast cancer when compared
with women with low triglyceride levels.91,95Nevertheless, E2, E3 and E4 isoforms are associated with several cancers predisposition96,97, including colorectal cancer93, being
APOE E3 allele the most predominant form98.
Figure 11. Cytogenetic localization of APOE gene. (Adapted from: http://www.genecards.org/cgi-bin/carddisp.pl?gene=APOE&keywords=APOE)
1.4.5. Cholesterol ester transfer protein (CETP)
Cholesterol ester transfer protein (CETP) has an important role in HDL plasma levels regulation. CETP helps in cholesteryl ester and triglyceride transfer and exchange between HDL, LDL and VLDL. Moreover, it also plays a role in liver’s cholesterol ester uptake and in plasma lipoproteins quantity and quality control.51,99
CETP gene is composed by 16 exons59 and is located in 16q13 chromosome (Figure 12). Findings have described two genetic variants, involved in several diseases, CETP G279A (rs708272) and CETP R451Q (rs1800777).100 CETP G279A variant has been identified as an essential cholesterol concentration regulator within HDL fraction. CETP 279G allele (allele B1) is responsible for higher CETP activity and lower cholesterol concentration in HDL fraction. While, the presence of CETP 279A allele (allele B2) is related with lower CETP activity and higher HDL values.60 On other hand, there is R451Q mutation, in which occurs a G to A substitution, modifying arginine (451) to glutamine in CETP protein.99 CETP 451Q mutant allele appears in low frequency in general population, about 2-7%, and has been associated with higher CETP activity and lower HDL-C levels.
Common lipid metabolism genes polymorphisms and SCA risk | Pandeirada R. 2015 38
Figure 12. Cytogenetic localization of CETP gene. (Adapted from: http://www.genecards.org/cgi-bin/carddisp.pl?gene=CETP&keywords=CETP)
1.4.6. Neuropeptide Y (NPY)
Neuropeptide Y (NPY) is a neurotransmitter present in central and peripheral nervous system, several peripheral organs, and plasma. This plays an important role in glucose-stimulated insulin secretion inhibition, renal blood flow regulation and is implicated in control and management feeding behaviors and food intake.102 NPY has the ability to induce obesity; this propriety was already confirmed in animal models.103 This fact, results in an increase of plasma insulin concentration. Findings indicate that NPY gene is a prime candidate gene for obesity.104 Moreover, also have been demonstrated that NPY promotes proliferation and vascularization, stimulate migration, formation of capillary tubes, development of blood vessels and it has many immunomodulatory functions, including modulates of the functions of macrophages.105,106
NPY gene is located in chromosome 7p15.1 (Figure 13) and has a SNP, NPY
Leu7Pro (rs16139)107,associated with NPY process, levels growth hormone secretion and serum cholesterol and triglyceride levels. In the NPY Leu7Pro SNP occurs a thymidine to cytosine nucleotide substitution (T1128C) in a coding region of NPY gene, interfering with signal pathway.102 This mutation is linked with the increase of the NPY synthesis and secretion levels being more frequent in Caucasian population (6% to 15%).106 Also, higher serum total cholesterol and lipid levels, and increased body mass index (BMI) are related with the NPY Leu7Pro polymorphism.61,108,109,110 Nevertheless, its implication on CRC risk is not yet clarified, although there is a strong association between NPY and obesity, other cancer types and colorectal predisposal.111,112
Common lipid metabolism genes polymorphisms and SCA risk | Pandeirada R. 2015 39
Figure 13. Cytogenetic localization of NPY gene. (Adapted from: http://www.genecards.org/cgi-bin/carddisp.pl?gene=NPY&keywords=NPY)
1.4.7. Paraoxonase 1 (PON1)
Paraoxonase 1 (PON1) is a protein with 354 amino acids and a molecular mass of 43 KDa. This enzyme is synthesized mainly in liver and secreted into blood, where it is associated exclusively with HDL (Figure 14).113,114 In animal models and human HDLs are major carriers of plasma lipid hydroperoxides (LOOHs). Moreover, PON1 enzyme has several roles such as protection against oxidative damage and lipid peroxidation, helps in the innate immunity, reactive molecules detoxification, drugs bioactivation, endoplasmic reticulum stress modulation and cell proliferation/ apoptosis regulation.115 Some studies confirmed that PON1 prevents oxidized LDL formation and inactivates LDL-derived oxidized phospholipids once they are formed; furthermore it also protects phospholipids in HDL from oxidation.116 A diet rich in fat and cholesterol modulate PON1 activity.117
Figure 14. Effect of dietary components on regulation of PON1 activity and its interaction with genetic factors.117
Common lipid metabolism genes polymorphisms and SCA risk | Pandeirada R. 2015 40
PON1 gene is located in chromosome 7q21.3 (Figure 15) and is coded by nine
exons. This gene has a polymorphism in the coding region, involved in various diseases and conditions, PON1 Q192R (rs662;A>G), resulting in Glutamine (Q) to Arginine (R) substitution 192 codon, leading to differences in hydrolytic activity towards paraoxon.113 Like other genes ethnicity and diseases can affect its distribution frequencies. Patients with CRC exhibit low PON1 plasma, high lipid peroxide and LOOH levels. This suggests a possible involvement of oxidative stress and PON1 variants in CRC.118,119,62,120
Figure 15.Cytogenetic localization of PON1 gene. (Adapted from: http://www.genecards.org/cgi-bin/carddisp.pl?gene=PON&keywords=PON)
1.4.8. Peroxisome proliferator-activated receptor gamma (PPARG)
Peroxisome proliferator-activated receptor gamma (PPARG) belongs to a group of nuclear hormone receptor that behaves as transcription factors that regulate genes expression. When PPARG interacts with the specific ligands is translocated into the nucleus, changes its structure and regulates gene transcription. PPARG plays an essential role in lipid metabolism, adipocytes differentiation and immune regulation. There are three isoforms of PPARG occurring by alternative splicing and promotors: PPARG1; PPARG2; and PPARG3.121
PPARG gene is located in 3p25.1 chromosome (Figure 16). A common variant has
been found in PPARG, characterized by a C to G substitution at exon 2. This alteration change Proline to Alanine at codon 12 (Pro12Ala) of PPARG gene, which reduces its promoter affinity and transcriptional activity. Some studies have shown that PPARG loss-of-function is associated with the increased risk of CRC.63,122 High activity of PPARG prevents the S-phase entry into the cell cycle, inhibiting the proliferation of malignant cells. It also has been shown that the nuclear factor kappa B (NF-B) and signal transducer and activator of transcription 3 (STAT3) inflammation pathways and cell growth could be inhibited by ligand activation of PPARG, allowing apoptosis and promote differentiation in
Common lipid metabolism genes polymorphisms and SCA risk | Pandeirada R. 2015 41
colon, breast and prostate cell lines.121,123 However, other studies carried out in mice with a high fat diet, shows that the activation of PPARG is associated with the CRC progression.124
PPARG Pro12Ala (rs1801282)125 substitution is associated with reduced transactivation activity. High activation of PPARG can lead to development of tumours by inhibition of expression of prostanoid and integrin receptors, by reducing the expression of fibronectin and by inhibiting angiogenic production and inflammatory signals. Furthermore, PPARG ligands may increase tumour suppressors, such as PTEN (Phosphatase and tensin homolog) and p21, expression and/or activity.125 Some works suggest that the presence of the PPARG 12Ala allele, which is associated with reduced PPARG activity, might decrease colon cancer susceptibility.126 PPARG 12Ala was recognized to be associated with increased tissue sensitivity to insulin, a decrease in insulin plasma level, reduced release of free fatty acids by adipocytes, which may indirectly explain the lower colon cancer risk in subjects with this polymorphism.125 Nevertheless its role in rectum cancer is not entirely clarified, seeming to have an opposite role in this type of tissue.
Figure 16. Cytogenetic localization of PPARG gene. (Adapted from: http://www.genecards.org/cgi-bin/carddisp.pl?gene=PPARG&keywords=PPARG)
1.5 . Lipid transport and metabolism genes in Sporadic Colorectal
Cancer (SCA)
Gene variants associated with various environmental and dietary factors can affect sporadic colorectal cancer risk. High fat diets are a fundamental risk factor for CRC development127, and its influence appears to be stronger during post-initiation phases of carcinogenesis.6 Accordingly, molecular mechanisms and pathways that could interfere in lipid transport and metabolism should be considered as a potential risk modulators for this neoplasia. Multiple genetic determinants, comprising several gene polymorphisms,
Common lipid metabolism genes polymorphisms and SCA risk | Pandeirada R. 2015 42
involved in lipid metabolism regulation, as well as, in lipid transport had been reported as risk factors for CRC.8 APOA1, APOB, APOC3, APOE, CETP, NPY, PPARG and PON1 genes have a considerable role in lipid transport regulation and metabolism, therefore numerous studies which including their common polymorphic variants demonstrate that they could affect these pathways.55,56,57,58,59,60,61,62,63 However, for most of the studied SNPs is unowned their association and influence on CRC.
Most authors recognize that a high fat diet is essential to raise the CRC risk by increasing bile acids secretion.128,129,130 This increased secretion has a non-specific irritant effect on colonic and rectal mucosa since it stimulates secondary bile acids formation. This effect can cause damage in intestinal epithelium bias oxidative stress and lipid peroxidation, stimulating endogenous mutations and increasing tumour proliferation.
128,129,130,131
Since APOA1, APOB, APOC3, APOE, CETP, NPY, PPARG and PON1 polymorphisms are responsible for different enzymatic activities among individuals, that consequently control the bile acids metabolism, and also because the role of these polymorphisms in SCA pathological progression has not been fully explained. Our study aims to clarify these issues by coming across the relationship between APOA1, APOB, APOC3, APOE, CETP,
NPY, PPARG and PON1 genotypes and SCA, as well as their interaction with other
Common lipid metabolism genes polymorphisms and SCA risk | Pandeirada R. 2015 44
Chapter II
Material and Methods
Common lipid metabolism genes polymorphisms and SCA risk | Pandeirada R. 2015 46
2. Materials and methods
2.1. Biological samples
This study included 68 SCA biopsies samples formalin-fixed and paraffin-embedded (FFPE) (mean age of 73.7 +/-10.7 years; 75% men and 25% women), previously selected. As control group were used 100 biopsies of healthy subjects, from screening (mean age of 72.7 +/-8.9 years; 79% men and 21% women) (Table 3). Biopsies were collected from 2009 to 2011 from the archives of Institute of Anatomical Pathology, Faculty of Medicine of the University of Coimbra. SCA samples were clinically identified as belonging to colon (31 samples) and rectum (37 samples) carcinomas and were selected according to the malignant cells availability with at least 60 malignant cells. SCA cases were classified according to WHO criteria39 (Table 2), being all samples used here classified as well differentiated adenocarcinoma (Figure 17). This study was supported and approved by local ethics committee (CIMAGO - Faculty of Medicine of the University of Coimbra, Coimbra, Portugal).
Figure 17. (A), (B) Histologic image of normal colonic mucosa: 40x HE (Haematoxylin-eosin), 200x HE; (C), (D) Histological image of well differentiated sporadic colorectal adenocarcinoma (According to WHO criteria). 100x HE; 200x HE. Images from IAP-FMUC.
B A
D C
Common lipid metabolism genes polymorphisms and SCA risk | Pandeirada R. 2015 47
Table 3. Clinical pathological data SCA and controls.
Tumour localization
Distribution Age Colon Rectum
Total
Gender % Mean Stand. Dev. n % n %
SCA Male 75 73.7 10.7 25 81 26 70 51 Female 25 6 19 11 30 17 Total 100 31 100 37 100 68 Controls Male 79 72.7 8.9 Female 21 Total 100
2.2. DNA extraction
DNA genomic isolation from biopsies were made according to the extraction protocol from NZY Tissue gDNA Isolation Kit (NZYTech, Lisbon, Portugal), after microdissection of the normal and tumour tissue (5 to 10 dissections of 10µm of thickness to each sample). Samples were prepared by adding 1 ml of xylene to each tube to paraffin removal. After centrifugation at 11,000xg for 3 min, supernatant was discarded and samples were washed with 1ml of ethanol (96%-100%), repeating the centrifugation step. Next to this process, cellular membrane lysis were done by adding 25 µl of Proteinase K and 180 µl of Buffer NT1 into each sample, and mixed thoroughly by vortex and incubated at 56 ˚C overnight. Afterwards, 210 µl of ethanol (96%-100%) was load to the samples, and mixed immediately by vortex. In a next step occurred the DNA binding and the mixture was transferred to into a NZYSpin Tissue Column placed in a 2 ml collection tube, and centrifuged for 1 min at > 11,000xg. After this, the flows-through were discarded and the columns were placed back into a new collection tube. Washing silica membrane steps are essential to impurities elimination and were done by adding 500 µL of Buffer NW1 to the columns, centrifuged (for 1 min at > 11,000xg) and the flows-through were discarded. After this, the same procedure was repeated using 600 µL of Buffer NW2. Then, to dry the silica membrane the column was centrifuged for 2 min at > 11,000xg. Finally, the columns were placed into a clean microcentrifuge tube and add 100 µl of sterile water, incubated 1 min at room temperature and centrifuged at > 11,000xg for 2 min to elute DNAs.
Common lipid metabolism genes polymorphisms and SCA risk | Pandeirada R. 2015 48
Genomic DNA samples were stored at -20 ˚C following of purity and concentration determination of all DNA samples, by spectrophotometry, applying a wavelength of 260/280nm.
2.2.1. Analysis of concentration and quality of the extracted DNA
DNA samples were quantified in a spectrophotometer GeneQuant pro (Biochrom, Cambridge, England). Rnase-free water was applied as reference and 7 μl of DNA sample were inserted in the ultra-microvolume cuvette in order to perform the sample concentration and purity quantification, by reading adequate optical densities (230 nm, 260 nm and 280 nm). The presence of nucleotides and proteins were detected at a wavelength of 280 nm, while at the 260 nm wavelength only detects nucleotides. At a wavelength of 230 nm, the presence of contaminants was assessed.
2.3. Genotyping
Sample genotyping was performed by PCR-SSP (Polymerase Chain Reaction –
Sequence Specific Primers) technique, based on the specific amplification of defined
regions allele. Several polymorphic points of genes encoding: APOA1 -75 G>A, APOB R3500Q, APOC3 C3175G, APOC3 T3206G, APOE Cys112Arg, APOE Arg158Cys, CETP G279A, CETP R451Q, PON1 Q192R, NPY Leu7Pro, PPARG Pro12Ala (Table 4). Primers used were obtained by collaboration with Genebox (Biocant- Cantanhede, Portugal) "Nutri Box Kit".