Effect of
BCHE
single nucleotide polymorphisms on lipid metabolism markers
in women
Jéssica de Oliveira
1, Luciane Viater Tureck
1,3, Willian dos Santos
1, Louise Farah Saliba
1,2, Caroline
Schovanz Schenknecht
1, Débora Scaraboto
1, Ricardo Lehtonen R. Souza
1and Lupe Furtado-Alle
1 1Departamento de Genética, Universidade Federal do Paraná (UFPR), Curitiba, PR, Brazil.
2
Departamento de Nutrição, Pontifícia Universidade Católica do Paraná (PUC-PR), Curitiba, PR, Brazil.
3Departamento Acadêmico de Ensino, Universidade Tecnológica Federal do Paraná (UTFPR), Ponta
Grossa, PR, Brazil.
Abstract
Butyrylcholinesterase (BChE) activity and polymorphisms in its encoding gene had previously been associated with metabolic traits of obesity. This study investigated the association of three single nucleotide polymorphisms (SNPs) in theBCHE gene: -116G > A (rs1126680), 1615GA (rs1803274), 1914A < G (rs3495), with obesity and lipid metabo-lism markers, body mass index (BMI), total cholesterol (TC), low density lipoprotein cholesterol (LDL-C), high density lipoprotein cholesterol (HDL-C), triglyceride (TG) levels, and BChE enzymatic activity in obese (BMI³30/n = 226) and non-obese women (BMI < 25/n = 81).BCHE SNPs genotyping was obtained by TaqMan allelic discrimination assay and by RFLP-PCR. Plasmatic BChE activity was measured using propionylthiocholine as substrate. Similar allele frequencies were found in obese and non-obese women for the three studied SNPs (p > 0.05). The dominant and re-cessive models were tested, and different effects were found. The -116A allele showed a dominant effect in BChE activity reduction in both non-obese and obese women (p = 0.045 and p < 0.001, respectively). The 1914A > G and 1615GA SNPs influenced the TG levels only in obese women. The 1914G and the 1615A alleles were associated with decreased plasma levels of TG. Thus, our results suggest that the obesity condition, characterized by loss of en-ergy homeostasis, is modulated by BCHE polymorphisms.
Keywords:BCHEgene, obesity, lipid metabolism, polymorphisms.
Received: May 06, 2016; Accepted: October 17, 2016.
Introduction
The human butyrylcholinesterase (BChE, EC 3.1.1.8), encoded by theBCHEgene (3q26.1-q26.2), is a cholinesterase synthesized in the liver and found in plasma, pancreas, liver, skin, smooth muscle, endothelium, brain and heart (Wescoeet al., 1947; Chatonnet and Lockridge, 1989). Although it is able of hydrolyzing acetylcholine similar to AChE, BChE functions appear to be more varied and remain not fully understood (Valleet al., 2011). BChE activity is heritable (H2= 81.4±2.8%, p = 1.0910-32), influ-enced byBCHEgene polymorphisms (Valleet al., 2011), and associated with lipid metabolism and factors related to obesity, such as weight (Chautard-Freire-Maia et al., 1991), body mass index (BMI) (Alcântara et al., 2005; Valle et al., 2011; Silva et al., 2012; Lima et al., 2013; Milano et al., 2013) and lipid profile (Alcântara et al.,
2002; Benyaminet al., 2011, Scacchiet al., 2011; Chaves
et al., 2013; Limaet al., 2013).
The association ofBCHEgene polymorphisms with obesity and related parameters has been demonstrated by many studies.BCHEknockout mice become obese when treated with a high-fat diet similar to that given to wild-type mice (Liet al., 2008). Furthermore, people with high BChE activity have lower BMI (Chautard-Freire-Maia et al., 1991). Thus, the influence ofBCHEpolymorphisms influ-ence may be direct, through enzymatic activity variation, or indirect, through changes in the interactions between BChE and other proteins.
ThreeBCHESNPs seem to have important functional effects in this context: -116G > A (rs1803274), 1615GA (rs1126680,K variant; p. A539T), and 1914A > G (rs3495), that are in linkage disequilibrium, preferentially found in
cisconfiguration (Bartelset al., 1990) (D’ = 1 for the three loci; andR2= 0.547 (-116G > A and 1914A > G); R2= 0.208 (1615GA and 1914A > G);R2= 0.380 (-116G > A and 1615GA); data from Haploview 4.1 software) (Barrett
et al., 2005). According to Furtado-Alleet al.(2008), the
Genetics and Molecular Biology, 40, 2, 408-414 (2017)
Copyright © 2017, Sociedade Brasileira de Genética. Printed in Brazil DOI: http://dx.doi.org/10.1590/1678-4685-GMB-2016-0123
Send correspondence to Lupe Furtado-Alle. Centro Politécni-co/Setor de Ciências Biológicas, Universidade Federal do Paraná, Jardim das Américas, Rua Francisco H dos Santos 210, 81531-970 Curitiba, PR, Brazil. E-mail: [email protected]
concomitant presence of -116A and 1615A variants was re-sponsible for most of the variance in BMI and BChE activ-ity reduction. The 1914G variant was also associated with BChE activity decrease and higher mean BMI and triglyceride levels (Limaet al., 2013).
Here we evaluated the effects of these threeBCHE
gene SNPs on enzyme activity, lipid metabolism and BMI. To examine these possible effects, we tested dominant (-116G > A) and recessive (1615GA and 1914A > G) ge-netic models on BChE activity and lipid metabolism mark-ers in obese and non-obese women from Southern Brazil.
Material and Methods
Samples
The sample consisted of 307 adult women, self-declared Euro-Brazilian, 226 of which were classified as obese (BMI³30 kg/m2) and 81 as non-obese (BMI < 25 kg/m2). Weight and height were measured with an accuracy of 0.1 kg and 0.1 cm, respectively.
Women interested in participating voluntarily in the study were evaluated by a professional team of nutrition-ists, nurses and geneticists. Criteria for inclusion were: age
³20 years, apparent health, not pregnant, not breastfeed-ing, and before menopause. The study excluded women who were on diet and under treatment with weight loss medication, vegetarian, suffering from type 1 diabetes, with untreated hypothyroidism, renal chronic disease and other chronic diseases.
Twelve-hour fast blood was collected from partici-pants, and triglycerides (TG), total cholesterol (TC), high density lipoprotein cholesterol (HDL-C) and low density li-poprotein cholesterol (LDL-C) were measured by standard automated methods.
The study was approved by the ethics committee of the Federal University of Paraná (CEP/SD 1159.084.11.06/ CAAE0082.0.091.000-11), and by the ethics committee of the Pontifical Catholic University of Paraná (0005306/11).
DNA and plasma BChE analysis
DNA was extracted from peripheral blood by a modi-fied salting-out method (Lahiri and Nurnberger Jr, 1991), and diluted to the final concentration of 20 ng/mL and 100 ng/mL for TaqMan and restriction fragment length poly-morphism polymerase chain reaction (RFLP-PCR) geno-typing, respectively. Genotyping of -116G > A and 1615GA sites were obtained by a TaqMan allelic discrimi-nation assay (Applied Biosystems), according to the fol-lowing steps: (1) 50 °C for 2 min., (2) 95 °C for 10 min., (3) 50 cycles of 95 °C for 15 s and 62 °C for 1 min., (4) 60 °C for 30 s.
The RFLP-PCR for the 1914A > G site genotyping used the following pair of primers: 5’AGCAAGAAAGA AAGTTGTGTGGGTCT3’ and 3’AGCAGAGCACTGT AATTTTGGGGG5’, generating a fragment of 298 bp.
Amplification cycles were: (1) 95 °C for 30 s, (2) 95 °C for 30 s, (3) 55 °C for 30 s, (4) 72 °C for 30 s, (5) 35 cycles re-peating the steps 2 to 4, (6) 72 °C for 10 min. After amplifi-cation, the DNA was incubated for 15 h at 37 °C withXcel (Nspl) restriction enzyme (Thermo Scientific), as recom-mended by the manufacturer. The enzyme cleaves the site in the presence of the 1914A allele, generating two frag-ments (195 bp and 103 bp). The fragfrag-ments were analyzed by electrophoresis at 4 °C (250 V, 35 mA and 60 W for 90 min) in polyacrylamide gels (8%), followed by gel staining with silver nitrate (Budowleet al., 1991).
Plasmatic BChE activity was measured using pro-pionylthiocholine as substrate at -25 °C (Dietzet al., 1972).
Statistical analysis
Allele and genotype frequencies were obtained by di-rect counting, and allele frequency comparisons between groups were performed by thec2 test, as well as Hardy-Weinberg equilibrium verification. The normal distribution of variables was tested by the Kolmogorov-Smirnov test with Lilliefors correction. Comparisons between means were made by Student’st-test for unpaired variables with parametric distribution (TC) and Mann-Whitney test for variables with non-parametric distribution (BMI, BChE ac-tivity, and HDL-C, LDL-C and TG levels). Multiple regres-sion analysis was performed for parametric variables, and Spearman’s rank correlation analysis for non-parametric variables. The probability value for the comparative tests were considered significant at p < 0.05 (5%).
Results
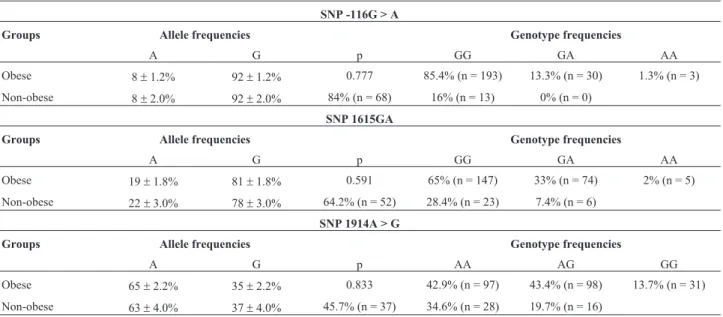
Genotype and allele frequencies in obese and non-obese women and between-group comparisons are shown in Table 1. The alleles were shown to be equally distributed between obese and non-obese women (p > 0.05), and all ge-notype distributions were in Hardy-Weinberg equilibrium (p > 0.05).
Regardless of genotype, obese women showed simi-lar BChE activity and lipid metabolism markers to non-obese women (p > 0.05), except for the triglycerides mean level, which was higher among obese women (p = 0.001) (Table 2).
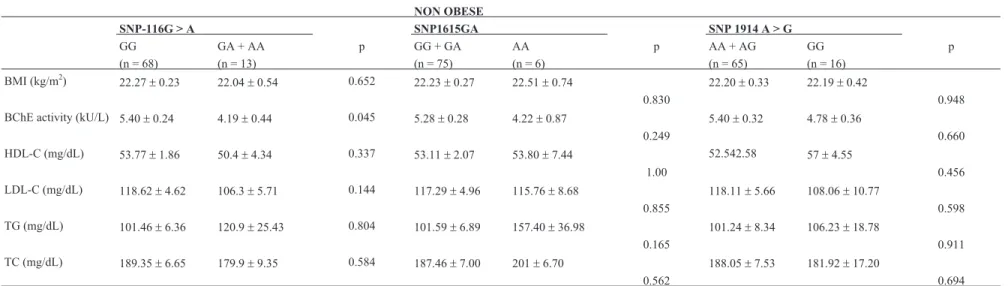
For the following analysis, the -116G > A genotypes were grouped according to the dominant model (GA + AA), due to low frequency of the A allele. The 1615GA and 1914A > G genotypes were grouped according to the reces-sive model (GG+GA and AA+AG respectively), due to the effect of each genotype when analyzed separately. The ef-fects of these models on BChE activity and lipid profile markers were tested in non-obese (Table 3) and obese women (Table 4).
com-pared with non-carriers (GG) (p = 0.045) (Table 3). Among obese women, in addition to the -116A dominant effect of lowering BChE activity (p < 0.001), the recessive effects of 1615GA and 1914A > G SNPs in the reduction of trigly-ceride levels were identified. The less common homozy-gous genotype of 1615GA and 1914A > G SNPs (AA and GG, respectively) showed lower triglyceride mean levels compared with the grouped heterozygous and common ho-mozygous genotypes (p = 0.019 and p = 0.015, respec-tively) (Table 4). The obese carriers of 1914A > G homozygous genotype (GG) also showed higher BChE ac-tivity compared with carriers of other genotypes (Table 4).
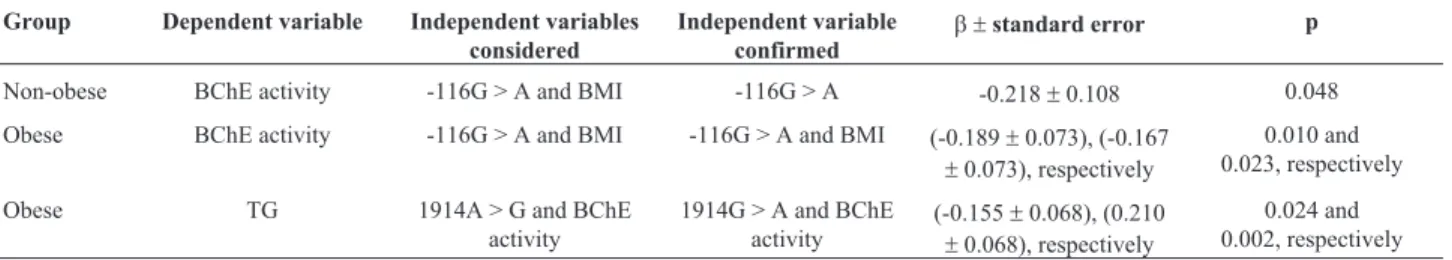
Multiple regression analysis confirmed the independ-ent effect of -116G > A SNP on mean BChE activity among non-obese women (p = 0.048) (Table 5). Among obese women, the independent effect of -116G > A SNP and BMI on the mean BChE activity were confirmed (p = 0.010 and p = 0.027 respectively) (Table 5). Multiple regression
anal-ysis also confirmed that, among obese women, the 1914A > G polymorphism acted independently on triglyceride levels (p = 0.024) (Table 5). A significant and positive correlation between BChE activity and TG levels in obese women (r= 0.1726, p = 0.0076) was found by Spearman’s correlation analysis.
Considering the linkage disequilibrium between the three sites, a combined genotype analysis was conducted. Significant differences in BChE activity and TG levels re-mained in obese women only. The less frequent allele com-binations, considering all three sites (Table S1), and two combined sites: 1615G A and 1914A > G (Table S2), -116G > A and 1914A > G (Table S3) and -116G > A and 1615GA (Table S4) showed lower means of BChE activity and TG levels (p < 0.05).
Discussion
The results presented above suggest that the 1615GA and 1914A > G polymorphisms are associated with changes in triglyceride levels in obese women. However, only the 1914A > G independent effect was confirmed by regression analysis, which may indicate that differences in TG mean levels between 1615GA genotypes were due to the linkage disequilibrium between these two sites.
The 1914A > G influence on TG levels has been de-scribed in the literature (Lima et al., 2013), besides the strong positive correlation between BChE activity and TG levels (Iwasakiet al., 2004; Benyaminet al., 2011), which was also found in our study.
The relationship between BChE and TG levels may be caused by the fatty acid increase from adipose tissue due to BChE hepatic synthesis, which is consistent with higher TG levels, ultimately leading to higher BChE activity (Cu-cuiani et al., 2002). In addition, it was suggested that
410 BCHESNPs and lipid metabolism
Table 2- Comparisons of lipid metabolism markers (mean±standard er-ror) among obese and non-obese women.
Variable Mean obese (n = 226)
Mean non-obese (n = 81)
p
BChE activity (kU/L)
5.19±0.11 5.17±0.20 0.586
HDL-C (mg/dL) 51.38±0.87 53.17±1.69 0.421
LDL-C (mg/dL) 115.24±1.94 117.10±4.04 0.320
TG (mg/dL) 142.22±4.54 105.36±6.50 0.001*
TC (mg/dL) 195.10±2.30 188.38±5.80 0.202
*Significant value in bold type. BChE: Butyrylcholinesterase TG: triglyc-erides, TC: total cholesterol, HDL-C: high density lipoprotein cholesterol, LDL-C: low density lipoprotein cholesterol.
Table 1- Comparisons of allele frequencies (p) and genotype distribution of -116G > A, 1615AG and 1914A > G SNPs (mean %±standard error) in obese and non-obese women.
SNP -116G > A
Groups Allele frequencies Genotype frequencies
A G p GG GA AA
Obese 8±1.2% 92±1.2% 0.777 85.4% (n = 193) 13.3% (n = 30) 1.3% (n = 3)
Non-obese 8±2.0% 92±2.0% 84% (n = 68) 16% (n = 13) 0% (n = 0)
SNP 1615GA
Groups Allele frequencies Genotype frequencies
A G p GG GA AA
Obese 19±1.8% 81±1.8% 0.591 65% (n = 147) 33% (n = 74) 2% (n = 5)
Non-obese 22±3.0% 78±3.0% 64.2% (n = 52) 28.4% (n = 23) 7.4% (n = 6)
SNP 1914A > G
Groups Allele frequencies Genotype frequencies
A G p AA AG GG
Obese 65±2.2% 35±2.2% 0.833 42.9% (n = 97) 43.4% (n = 98) 13.7% (n = 31)
et
al.
411
NON OBESE
SNP-116G > A SNP1615GA SNP 1914 A > G
GG GA + AA p GG + GA AA p AA + AG GG p
(n = 68) (n = 13) (n = 75) (n = 6) (n = 65) (n = 16)
BMI (kg/m2)
22.27±0.23 22.04±0.54 0.652 22.23±0.27 22.51±0.74 22.20±0.33 22.19±0.42
0.830 0.948
BChE activity (kU/L) 5.40±0.24 4.19±0.44 0.045 5.28±0.28 4.22±0.87 5.40±0.32 4.78±0.36
0.249 0.660
HDL-C (mg/dL) 53.77±1.86 50.4±4.34 0.337 53.11±2.07 53.80±7.44 52.542.58 57±4.55
1.00 0.456
LDL-C (mg/dL) 118.62±4.62 106.3±5.71 0.144 117.29±4.96 115.76±8.68 118.11±5.66 108.06±10.77
0.855 0.598
TG (mg/dL) 101.46±6.36 120.9±25.43 0.804 101.59±6.89 157.40±36.98 101.24±8.34 106.23±18.78
0.165 0.911
TC (mg/dL) 189.35±6.65 179.9±9.35 0.584 187.46±7.00 201±6.70 188.05±7.53 181.92±17.20
0.562 0.694
Significant values in bold type. BChE: Butyrylcholinesterase; BMI: body mass index; TG: triglycerides; TC: total cholesterol; HDL-C: high density lipoprotein cholesterol; LDL-C: low density lipoprotein choles-terol.
Table 4- Anthropometric and lipid metabolism markers (mean±standard error) and comparisons in obese women stratified by dominant and recessive models ofBCHEgene SNPs. OBESE
-116 G > A 1615GA 1914A > G
GG GA + AA p GG + GA AA p AA + AG GG p
Variables (n = 193) (n = 33) (n = 221) (n = 5) (n = 195) (n = 31)
BMI (kg/m2) 35.39±0.38 34.32±0.67 0.522 35.28±0.42 34.56±2.09 35.52±0.57 34.07±0.65
0.544 0.202
BChE activity (kU/L) 5.37±0.12 4.32±0.25 0.00003 5.21±0.15 5.65+1.15 5.07 ± 0.17 5.80+0.14
0.789 0.018
HDL-C (mg/dL) 50.55±0.89 52.3±2.32 0.580 50.98±1.11 51.43+5.65 51.23±1.39 49.53+2.00
0.780 0.560
LDL-C (mg/dL) 114.39±2.18 119.67±4.93 0.310 115.04±2.63 124.73+8.10 114.11±3.20 121.19+5.86
0.267 0.222
TG (mg/dL) 144.26±5.31 124.57±8.31 0.118 142.92 ± 6.54 95.57+8.52 145.12 ± 6.55 117.18+10.5
0.019 0.015
TC (mg/dL) 193.85±2.57 196.86±5.85 0.639 194.64±3.07 195.28+10.83 194.41±3.60 194.21+6.65
0.963 0.978
hyperlipidemia leads to changes in the tertiary and quater-nary BChE structure (Kálmánet al., 2004). Other factors must be considered in this context, such as the possible ef-fect of other genes that are in the interface between lipid and carbohydrate metabolism that may increase the meta-bolic risk profile and, thus, indirectly affect BChE activity through TG levels (Benyaminet al., 2011).
The molecular mechanism of this association remains uncertain, as well as whether BChE activity variation is caused by metabolic abnormalities, or if this metabolic dis-order is secondary to altered BChE activity. It is probably a feedback system, therefore it is both the cause and the ef-fect. This was suggested by Silvaet al.(2012), whose study showed the physiological regularization of BChE activity after a physical exercise program, where the BChE activity and lipid profile became normal in response to exercise.
The polymorphisms’ effects on BChE activity and TG levels in obese women seem to be independent, since the -116G > A polymorphism acted on BChE activity ac-cording to the dominant model, while the 1914A > G acted in a recessive form on TG levels. Differently from Limaet al., 2013, we found no 1914G allele association with osity, as there was no difference in allele frequencies be-tween obese and non-obese women, in our study the 1914A > G polymorphism effect on TG levels differed between groups. This discrepancy may be due to differences be-tween the samples. The study of Limaet al. (2013) was based on a population sample, therefore it was heteroge-neous, composed of obese and non-obese men and women. In our study we restricted our analysis to obese women. Specific metabolic conditions associated with obesity and the influence of sex hormones, especially estrogen, on the lipid profile (Batailleet al., 2005), can modulate the genetic polymorphisms’ effect differently, as observed in previous studies (Ordovas, 2008; Turecket al., 2014; Locke,2015).
In the evaluation of BChE activity, obesity is a major condition to be considered, since several studies showed that obese individuals tend to have increased activity of this enzyme as a result of increased levels of choline esters, which are products of free fatty acid metabolism and hepatic lipogenesis, and both metabolic traits are altered with obesity (Alcântaraet al.,2005; Randellet al., 2005; Furtado-Alleet al., 2008). In our study, however, there was no significant difference in mean BChE activity between
obese and non-obese women. This may be due to lipid pro-file similarities among these women, since only the mean TG level was higher among obese compared to non-obese. This suggests that the excess fat tissue itself is not a deter-minant factor for the increase in BChE activity, and that a metabolic disorder with an unfavorable lipid profile is more important in this regard. Iwasakiet al.(2004) evaluated the degree of hepatic steatosis based on BMI and liver function markers of liver donors, and found that obese patients with-out liver steatosis had normal BChE activity levels, whereas both obese as well as non-obese with this condi-tion showed an increased BChE activity, which strengthens our hypothesis.
Besides the influence of these endogenous factors, polymorphisms in theBCHEgene are also associated with BChE activity variation (Benyaminet al., 2011). Our find-ings suggest that the -116A allele was responsible for lower levels of enzymatic activity in both obese and non-obese women. This result was similar to that found by Furtado-Alleet al.(2008), who found a decreased BChE activity in -116A allele carriers in obese and non-obese men. The -116G > A independent effect on BChE activity was con-firmed in our study by multiple regression analysis in both groups. However, BMI was an independent factor for this variable only in the obese group. The relative BMI contri-bution to the BChE activity appears to respond to internal metabolic factors and in homeostasis imbalance situations, such as caused by obesity.
Certain limitation should be highlighted for this study, such as the small number of samples, especially in the control group, and the exclusion of men, which could have revealed a possible gender influence.
In conclusion, an unfavorable lipid status seems to be a determining factor in BChE enzymatic activity. In addi-tion, the -116G > A and 1914A > G polymorphisms influ-ence both BChE activity and TG levels, the -116G > A dominant effect on the BChE activity is independent of obesity status, and the 1914A > G recessive effect on the TG levels is obesity-dependent.
Acknowledgments
Diagnósticos do Brasil (DB) clinical laboratory per-formed the automated measurements of biochemical pa-rameters. Grants and scholarships were received by the
412 BCHESNPs and lipid metabolism
Table 5- Multiple regression analysis results.
Group Dependent variable Independent variables considered
Independent variable confirmed
b ±standard error p
Non-obese BChE activity -116G > A and BMI -116G > A -0.218±0.108 0.048
Obese BChE activity -116G > A and BMI -116G > A and BMI (-0.189±0.073), (-0.167
±0.073), respectively
0.010 and 0.023, respectively
Obese TG 1914A > G and BChE activity
1914G > A and BChE activity
(-0.155±0.068), (0.210
±0.068), respectively
0.024 and 0.002, respectively
authors from Coordenação de Aperfeiçoamento de Pessoal de Nível Superior (CAPES).
References
Alcântara VM, Chautard-Freire-Maia EA, Scartezini M, Cerci MS, Braun-Prado K and Picheth H (2002) Butyrylcholi-nesterase activity and risk factors for coronary artery dis-ease. Scand J Clin Lab Invest 62:399-404.
Alcântara VM, Oliveira LC, Rea RR, Suplicy HL and Chautard-Freire-Maia EA (2005) Butyrylcholinesterase activity and metabolic syndrome in obese patients. Clin Chem Lab Med 43:285-288.
Bataille V, Perret, B, Evans A, Amouyl P, Arveiler D, Ducime-tière P, Bard JM and Ferrières J (2005) Sex hormone-binding globulin is a major determinant of the lipid profile: The prime study. Atherosclerosis 179:369-373.
Barrett JC, Fry B, Maller J and Daly MJ (2005) Haploview: Anal-ysis and visualization of LD and haplotype maps. Bioin-formatics 21:263-265.
Bartels CF, van der Spek AFL and La Du BN (1990) Two polymorphisms in the noncoding regions of theBCHEgene. Nucleic Acids Res 18:6171.
Benyamin B, Middelberg RP, Lind PA, Valle AM, Gordon S, Nyholt DR, Medland SE, Henders AK, Heath AC, Madden PA,et al.(2011) GWAS of butyrylcholinesterase activity identifies four novel loci, independent effects within BCHE and secondary associations with metabolic risk factors. Hum Mol Genet 20:4504-4514.
Budowle B, Chakraborty R, Giusti AM, Eisenberg AJ and Allen RE (1991) Analysis of the VNTR locus D1S80 by the PCR followed by highresolution PAGE. Am J Hum Genet 48:137-144.
Chatonnet A and Lockridge O (1989) Comparison of butyryl-cholinesterase and acetylcholinesterase. Biochem J 260:625-634.
Chautard-Freire-Maia EA, Primo-Parmo SL, Picheth G, Louren-ço MAC and Vieira MM (1991) The C5 isozyme of serum cholinesterase and adult weight. Hum Hered 41:330-339. Chaves TJ, Leite N, Milano GE, Milano GE, Souza RLR,
Chau-tard-Freire-Maia EA and Furtado-Alle L (2013) -116A and K BCHE gene variants associated with obesity and hyper-triglyceridemia in adolescents from Southern Brazil. Chem Biol Interact 203:341-343.
Cucuiani M, Nistor T, Hancu N, Obra IP, Muscure LV and Stotian I (2002) Serum cholinesterase activity correlates with serum insulin, C-peptide and free fatty acids levels in patients with type 2 diabetes. Rom J Intern Med 40:43-51.
Dietz A A, Rubinstein H M, Lubrano T and Hodges L K (1972) Improved method for the differentiation of cholinesterase variants. Am J Hum Genet 24:58-64.
Furtado-Alle L, Andrade FA, Nunes K, Mikami LR, Souza RLR and Chautard-Freire-Maia EA (2008) Association of vari-ants of the -116 site of the butyrylcholinesterase BCHE gene to enzyme activity and body mass index. Chem Biol Interact 175:115-118.
Iwasaki M, Takada Y, Hayashi M, Minamiguchi S, Haga H, Maetani Y, Fujii K, Kiuchi T and Tanaka K (2004) Nonin-vasive evaluation of graft steatosis in living donor liver transplantation.Transplantation 78:1501-1505.
Kálmán J, Juhász A, Rakonczay Z, Abrahám G, Zana M, Boda K, Farkas T, Penke B and Janka Z (2004) Increased serum butyrylcholinesterase activity in type IIb hyperlipidaemic patients. Life Sci 75:1195-1204.
Lahiri DK and Nurnberger Jr JL (1991) A rapid non-enzymatic method for the preparation of HMW DNA from blood for RFLP studies. Nucleic Acids Res 19:5444.
Li B, Duysen EG and Lockridge O (2008) The butyrylcholi-nesterase knockout mouse is obese on a high-fat diet. Chem Biol Interact 175:88-91.
Lima JK, Leite N, Turek LV, Souza RLR, Timossi L da S, Osiecki ACV, Osiecki R and Furtado-Alle L (2013) 1914G variant ofBCHEgene associated with enzyme activity, obesity and triglyceride levels. Gene 532:24-26.
Locke AE (2015) Genetic studies of body mass index yield new insights for obesity biology. Nature 518:197-206.
Milano GE, Leite N, Chaves TJ, Souza RLR and Furtado-Alle L (2013) Atividade da butirilcolinesterase e fatores de risco cardiovascular em adolescentes obesos submetidos a um programa de exercícios físicos. Arq Bras Endocrinol Metab 57:533-537.
Ordovas JM (2008) Genotype-phenotype associations: Modula-tion by diet and obesity. Obesity 16:40-46.
Randell EW, Mathews MS, Zhang H, Seraj JS, and Sun G (2005) Relationship between serum butyrylcholinesterase and the metabolic syndrome. Clin Biochem 38:799-805.
Scacchi R, Ruggieri M and Corbo RM (2011) Variation of the butyrylcholinesterase (BChE) and acetylcholinesterase (AChE) genes in coronary artery disease. Clin Chim Acta 412:1341-1344.
Silva IM, Leite N, Boberg D, Chaves TJ, Eisfeld GM, Eisfeld GM, Bono GF, Souza RL and Furtado-Alle L (2012) Effects of physical exercise on butyrylcholinesterase in obese adoles-cents. Genet Mol Biol 35:741-742.
Tureck LV, Leite N, Rodrigues Souza RL, Lima JK, Milano GE, Timossi LdaS, Osiecki AC, Osiecki R and Furtado-Alle L (2014) Gender-dependent association of HSD11B1 single nucleotide polymorphisms with glucose and HDL-C levels. Genet Mol Biol 37:490-495.
Valle AM, Radic Z, Rana BK, Mahboubi V, Wessel J, Shih PA, Rao F, O’Connor DT and Taylor P (2011) Naturally occur-ring variations in the human cholinesterase genes: Herita-bility and association with cardiovascular and metabolic traits. J Pharmacol Exp Ther 33:125-133.
Wescoe WC, Hunt CH, Riker FE and Litt IC (1947) Regeneration rates of serum cholinesterase in normal individuals and in patients with liver damage. Am J Physiol 149:549-551.
Supplementary Material
Table S3 - Anthropometric and biochemical variables (mean ± standard error) in obese and non-obese women stratified by usual homozygous and less frequent alleles carriers for -116G > A and 1914A > G SNPs.
Table S4 - Anthropometric and biochemical variables (mean ± standard error) in obese and non-obese women
stratified by usual homozygous and less frequent alleles carriers for -116G > A and 1615GA SNPs.
Associate Editor: Mara H. Hutz
License information: This is an open-access article distributed under the terms of the Creative Commons Attribution License (type CC-BY), which permits unrestricted use, distribution and reproduction in any medium, provided the original article is properly cited.