Cyclical Dynamics of Unemployment:
Portugal versus the Euro Area
By Leonida Correia
Daniela Carvalho
†Since Portugal joined the European Monetary Union, its unemployment rate has increased continuously. In the euro area, some other countries have also been experiencing high levels of unemployment. In this work, we analyse and characterize the dynamics of Portuguese unemployment in the recent past in an attempt to understand which groups have been most affected and how austerity measures have impacted this problem. Also, we investigate the relationship between the cyclical behaviour of the unemployment rate and business cycles since the 1970s, emphasizing a comparison between Portugal and the first eleven countries, other than Portugal, that have adopted the euro. The results show countercyclical behaviour in most countries, with great differences in the degree of association between the cycles of the two variables, and also suggest that the introduction of the euro induced stronger correlation for the majority of the euro area countries. Finally, we present some policy considerations raised by our results.
Keywords: Business cycles, Euro area, Portugal, Unemployment.
Introduction
Over the last few decades, most European countries experienced high and persistent unemployment rates. The recent global economic and financial crisis, and the sovereign debt crisis in the euro area that succeeded it, has worsened the problem of unemployment, which climbed to unprecedented levels in some countries. This was the case for Portugal, which, historically, recorded low rates of unemployment until the 2000s. Since 1999, when Portugal joined the euro area, the unemployment rate has increased from 4.4% to 16.4% in 2013, becoming one of the most problematic obstacles to development of the Portuguese economy.
To explain the rise and persistence of unemployment in the European Union (EU) since the 1970s, the literature has pointed mainly to two causes: The first refers to existing rigidities in the labour market (e.g. employment protection legislation and strong union power) and the second involves an
In an influential article on European unemployment, Blanchard (2005) states that the two oil shocks of the 1970s and a decline in growth of total factor productivity were the basic causes of the rise in European unemployment. In that decade, low, and sometimes even negative, interest rates initially managed to quell the impact of these shocks. With these events, one might have expected a slowdown in growth in real wages. That did not happen due to a period of strong labour unrest involving several general strikes in several European countries in which unions and workers requested more generous wages. The resulting agreements increased wage rigidity. Alongside this wage growth, governments have maintained a generous social welfare system in an attempt to minimize the effects of adverse shocks.
The demand for better wages and the generosity of the welfare state has continued for some time, a contributing factor being increases in unemployment during the 1980s. Governments responded to adverse shocks with accommodating monetary policy, leading to a huge increase in the inflation rate. The governments and central banks of several European countries, with the aim of forming a monetary union, then implemented a restrictive monetary policy. The objective of reducing inflation was achieved, but at the cost of a considerable increase in the rate of unemployment, of a long-term nature in most European countries.1
It should be noted that, while in Europe the tendency has been toward an increase in unemployment, there were countries that were able to lower unemployment. That was the case for the United Kingdom (UK) and the Netherlands. In the UK, the government of Margaret Thatcher managed to weaken the power of unions through legislation and implement a reduction in social assistance and unemployment benefits. In the Netherlands, trade unions and employers cooperated and agreed to wage moderation at the beginning of 1980s. The government cut taxes and established more favourable taxation of part-time employment (Burda and Wyplosz 2011). It is also noteworthy that there are European countries with developed social welfare states where long-term unemployment has remained low. Thus, it can be concluded that the cause of the discrepancies found in the levels of unemployment in European countries is not necessarily differences in their social security systems.
In the 1990s emerged a broad consensus that the institutions of the labour market were mainly responsible for the continuous and persistent increase in unemployment. Several studies (Blanchard and Wolfers 2000, Blanchard and Portugal 2001, Blanchard 2005, Fedmann 2009) showed that differences in unemployment were caused by differences defined in terms of the rigidity/flexibility of the labour market. Specifically, more rigid labour regulation tends to increase unemployment. Consequently, since the nineties, some policy makers have begun to introduce both reforms in the institutions of the labour market (particularly in employment protection systems and
1
Blanchard (2005) argues that if the monetary authorities had initially adopted a more neutral policy, the increase in unemployment would have been higher initially, but short-lived because, had it been done in this way, the effects of the initial shock would not have been lasting.
unemployment benefits) to increase their flexibility and active policy programs to achieve a reduction in unemployment.
These reforms have been based mainly on the adoption of fixed-term contracts for new employees that are not extended to all workers. This has led to a segmentation in the European labour market in which individuals with open-ended term (permanent) contracts benefit from higher employment protection than do those with short-term (temporary) contracts, which are easier to dismiss and have lower social benefits (Centeno and Novo 2012). This employment protection gap resulted in a two-tier system that restrains growth and economic development because it is damaging to investment in education and technology. This, in turn, happens because countries lose their human capital to other countries that offer better conditions, thereby encouraging the emigration of workers looking for a return on their investment in education (Goldin and Katz 2008).
The high and persistent European unemployment rate since the 1970s has been painful in several ways, especially in its strong negative impact on the welfare of individuals. Since the beginning of the century, the unemployment situation has worsened, particularly in some countries in peripheral Southern Europe, which experienced weaker economic growth and has felt the effects of the economic recession more strongly. The situation is particularly difficult for those countries in the euro area, such as Portugal, which, besides the economic crisis, has suffered a sovereign debt crisis and has had to adopt austerity measures to combat high levels of budget deficits and public debt.
The main objective of this paper is to analyse the cyclical dynamics of unemployment in the first twelve euro area countries during the period 1970-2013, comparing the periods before and after the inception of the European Monetary Union (EMU), with emphasis on the years of the recent crisis. To achieve this goal, in addition to the introduction and conclusion, the paper includes a presentation of some facts about the temporal evolution of unemployment in the euro area, with a detailed analysis of the Portuguese case. Afterwards, contains a study of the cyclical volatility of the unemployment rate and its co-movements with the business cycle.
Unemployment Rate Developments: Some Facts
In this section, we look at the evolution of unemployment in the euro area during the period 1970-2013. We analyse more deeply the situation of Portugal, trying to understand which groups have been most affected by the
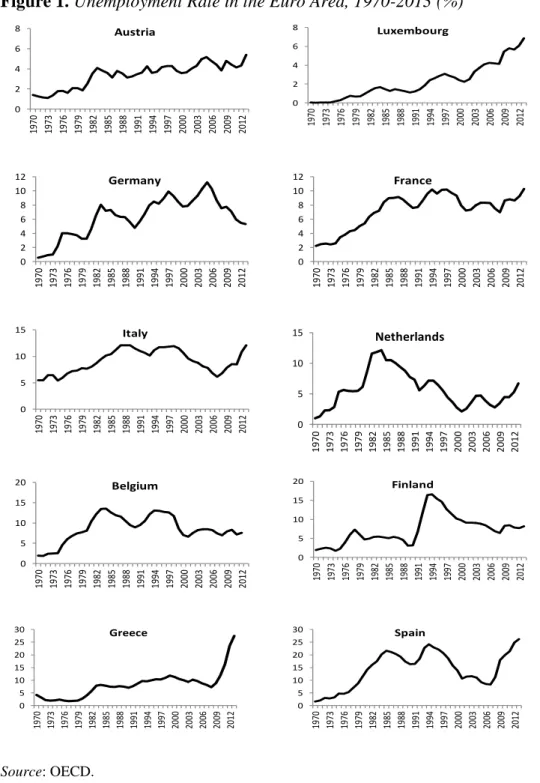
Germany (DEU), Greece (GRC), Ireland (IRL), Italy (ITA), Luxembourg (LUX), the Netherlands (NLD), Portugal (PRT) and Spain (ESP). Figure 1 shows the evolution of the unemployment rate in these countries during the 1970-2013 period.1
Figure 1. Unemployment Rate in the Euro Area, 1970-2013 (%)
0 2 4 6 8 1970 1973 1976 1979 1982 1985 1988 1991 1994 1997 2000 2003 2006 2009 2012 Austria 0 2 4 6 8 1970 1973 1976 1979 1982 1985 1988 1991 1994 1997 2000 2003 2006 2009 2012 Luxembourg 0 2 4 6 8 10 12 1970 1973 1976 1979 1982 1985 1988 1991 1994 1997 2000 2003 2006 2009 2012 Germany 0 2 4 6 8 10 12 1970 1973 1976 1979 1982 1985 1988 1991 1994 1997 2000 2003 2006 2009 2012 France 0 5 10 15 1970 1973 1976 1979 1982 1985 1988 1991 1994 1997 2000 2003 2006 2009 2012 Italy 0 5 10 15 1970 1973 1976 1979 1982 1985 1988 1991 1994 1997 2000 2003 2006 2009 2012 Netherlands 0 5 10 15 20 1970 1973 1976 1979 1982 1985 1988 1991 1994 1997 2000 2003 2006 2009 2012 Belgium 0 5 10 15 20 1970 1973 1976 1979 1982 1985 1988 1991 1994 1997 2000 2003 2006 2009 2012 Finland 0 5 10 15 20 25 30 1970 1973 1976 1979 1982 1985 1988 1991 1994 1997 2000 2003 2006 2009 2012 Greece 0 5 10 15 20 25 30 1970 1973 1976 1979 1982 1985 1988 1991 1994 1997 2000 2003 2006 2009 2012 Spain Source: OECD. 1
Table A.1 in the appendix provides descriptive statistics for the unemployment rates of these countries. We have not considered the remaining countries of the EMU (Cyprus, Estonia, Latvia, Lithuania, Malta, Slovakia and Slovenia) because some data are not available.
The graphs show that there are significant discrepancies in the evolution of the unemployment rate across the euro area countries. Austria and Luxembourg exhibit the lowest figures, with average rates around 3.4% and 2.2%, respectively. In contrast, Spain stands out in a negative way with the highest average unemployment rate (14.2%).
Also, it is obvious that there are substantial differences in the amplitude of changes over time. Austria and Luxembourg exhibit lower dispersion and the lowest levels of unemployment. Once again, Spain is the country that stands out, with a minimum value of 1.5% in 1970, and reaching a maximum value of 26.2% in 2013. This wide range of values is also reflected in a higher standard deviation (7.1%). Greece and Ireland have 5.2% and 4.4% of dispersion, respectively. It should be noted that Greece had historically low unemployment rates, rarely exceeding two digits. This country was particularly affected by the economic and sovereign debt crises, during which the unemployment rate rose sharply, reaching 27.5% in 2013, the highest rate of any country analysed.
The case of Spain should be highlighted. In the early years, Spain had a low unemployment rate, but, throughout the 1980s and into the mid-1990s, the Spanish rate increased continuously. It then decreased until the crisis, when it exploded again. In addition to being exceptionally high, unemployment in Spain has also turned out to be abnormally persistent, as many econometric studies have highlighted (Garcia-Cintado et al. 2014).
Analysing the Portuguese case, it appears that the unemployment rate began to increase in the mid-1970s, reflecting mainly the political changes that occurred in the country after the 1974 revolution that brought democracy to the country, but also some economic instability and, subsequently, a return of people from the former colonies. Until the mid-1980s, the unemployment rate increased gradually but began to decrease to relatively low levels during the economic boom of the nineties until the end of the century. Since 2000, one can observe a continuous rise in the unemployment rate, which reached a record of 16.4% in 2013!
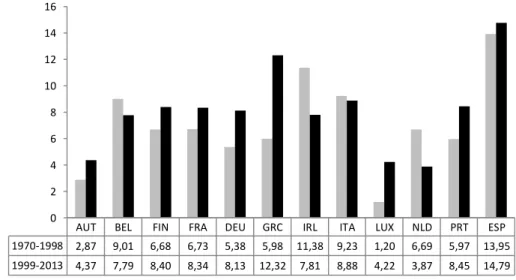
Comparing the periods before and after inception of the EMU (Figure 2) it is evident that there has been an increase in the average unemployment rate for the majority of the countries. The exceptions are Italy, where the average remained unchanged at around 9%, and the Netherlands and Ireland, where unemployment decreased (by 2.8 p.p. and 3.6 p.p., respectively).
Figure 2. Mean of the Unemployment Rate, Before and After EMU (%)
AUT BEL FIN FRA DEU GRC IRL ITA LUX NLD PRT ESP
1970-1998 2,87 9,01 6,68 6,73 5,38 5,98 11,38 9,23 1,20 6,69 5,97 13,95 1999-2013 4,37 7,79 8,40 8,34 8,13 12,32 7,81 8,88 4,22 3,87 8,45 14,79 0 2 4 6 8 10 12 14 16 1970-1998 1999-2013
Source: Authorsʼ calculations based on OECD data.
The Netherlands is a case of success in terms of reductions in unemployment. In the eighties, labour institutions and the Dutch government worked together: Employers and trade unions agreed to wage moderation, the government cut taxes, and other measures were applied (Burda and Wyplosz 2011). After the implementation of new labour market rules, the Dutch unemployment rate decreased substantially. In the EMU period, the rate of unemployment averaged 3.9%, the lowest across the twelve euro area countries.
Austria and Luxembourg also stand out because they had lower average unemployment rates in both periods, although these have increased since those countries joined the EMU (by 1.5 p.p. and 3 p.p., respectively). In contrast, Spain and Greece showed very high average unemployment rates, in the double-digits in the second sub-period. Moreover, Greece more than doubled its unemployment rate in the second sub-period, which is undoubtedly a worrying reality.
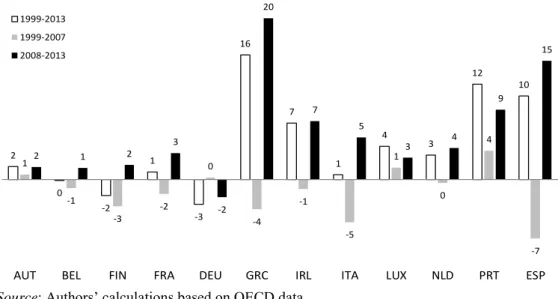
Looking at country-specific variations in the unemployment rate in the years of the economic and sovereign debt crisis (Figure 3), it is clear that the largest increases are for Greece (20 p.p.), Spain (15 p.p.), Portugal (9 p.p.) and Ireland (7 p.p.). These countries were particularly sensitive to the crisis and were under pressure to implement subsequent fiscal consolidation measures imposed by the International Monetary Fund, European Commission and European Central Bank (Troika) in the context of Economic and Financial Assistance Programmes (EFAP). Greece, Ireland and Portugal announced the largest packages, all above 10% of GDP, whereas Spain adopted a fiscal consolidation plan with a cumulative impact between 3% and 5% of GDP (OECD, 2015).
Figure 3. Variation in the Unemployment Rate, After EMU, Before and During the Crisis (p.p.) 2 0 -2 1 -3 16 7 1 4 3 12 10 1 -1 -3 -2 0 -4 -1 -5 1 0 4 -7 2 1 2 3 -2 20 7 5 3 4 9 15
AUT BEL FIN FRA DEU GRC IRL ITA LUX NLD PRT ESP
1999-2013 1999-2007 2008-2013
Source: Authorsʼ calculations based on OECD data.
Characterization of Unemployment in Portugal
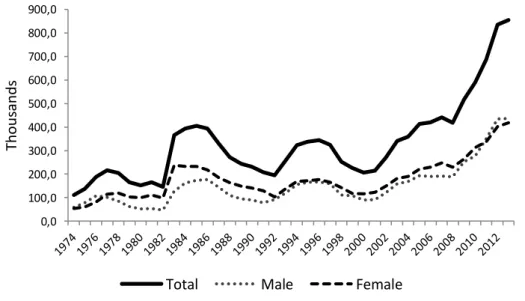
As mentioned earlier, unemployment in Portugal was not a big problem until the end of the twentieth century (Figure 4). The flexibility of real wages in Portugal has been pointed out in several studies as the main reason explaining the low and countercyclical unemployment rates of the 1980s and 1990s, as well as their low persistence when compared with several other European countries (Barbosa et al. 1998, Blanchard and Jimeno 1995, Bover et al. 1998, Luz and Pinheiro 1994). In these decades, this was the only mechanism of adjustment used by Portugal, which had great difficulties related to human resource mobility within the European region. However, at a microeconomic level, the Portuguese labour market did not have the same flexibility. Several studies have characterized Portugal as having low labour mobility that made its labour market one of (if not the) least dynamic in the OECD (Blanchard and Jimeno 1995, Portugal 1999). It had some of the more protective and restrictive employment legislation in Europe and the OECD (Blanchard and Portugal 2001).
Figure 4. Unemployment Total and by Sex, Thousands, 1974-2013
0,0 100,0 200,0 300,0 400,0 500,0 600,0 700,0 800,0 900,0 Thous ands
Total Male Female
Source: National Institute of Statistics (INE) and the Database of Contemporary Portugal
(PORDATA)1.
Since the beginning of this century, conditions have deteriorated substantially in the Portuguese labour market, with unemployment displaying a growth trend. With the inception of the EMU in 1999, Portugal has become more vulnerable because its economy has competitiveness problems and has lost the control of monetary policy that had enabled it to devalue its currency when needed. After that, there was the bankruptcy of many companies, the occurrence of low growth rates, and two recessions. All these factors contributed to the destruction/low creation of jobs and the increase in the level of unemployment, as well as its duration.
The problem worsened in the years of the recent crisis, when unemployment has appeared to be very sensitive to the slowing of economic activity and to the sovereign debt crisis, with the number of persons unemployed having more than doubled, from 418,000 in 2008 to 855,000 persons in 2013.2
In general, the unemployment always affected more females than males, with only a slight difference between 2011 and 2013.
1
www.ine.pt & www.pordata.pt.
2 As is well known, the calculation of the official unemployment rate does not include
unemployed individuals who are on the fringes of unemployment, namely underemployed persons, i.e. those working in part-time jobs because they cannot get full time jobs, and discouraged workers, i.e., persons who are not seeking employment because they believe that there is no work available, but who nevertheless would like to have work. According the figures presented in IMF (2015), if these two segments (involuntary part-time work and discouraged) were to be considered, the Portuguese unemployment rate would be increased at around 10% in 2013! Also, "the large outward migration flows of workers since 2011 could be added to labour market slack as well, as many migrants would likely return to Portugal if jobs became available" (IMF 2015: 22).
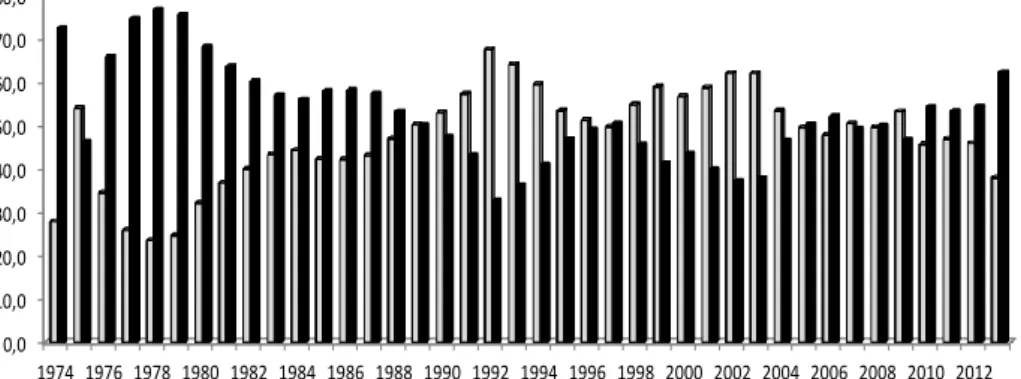
Figure 5 illustrates another feature of the Portuguese labour market: the sharp increase of long-term unemployment -measured by the fraction of those unemployed for one year or more- after 2002 and, particularly, during the Great Recession. The fraction of unemployed people seeking employment for twelve months or more rose sharply and reached 62% in 2013 (and the fraction of unemployment lasting more than two years reached 38%!). This number is the highest recorded since the early nineties. It represents a serious problem for the Portuguese economy because long term unemployment tends to lead to a sharp devaluation of human capital, with adverse effects on economic growth. Moreover, long term unemployment "involves highly relevant personal and social costs and induces the depreciation of professional skills and poverty and social exclusion, which reduce society’s capacity to undertake structural transformations and adopt correct economic policies" (Bank of Portugal 2014: 21).
Figure 5. Duration of Unemployment, 1974-2013 (%)
0,0 10,0 20,0 30,0 40,0 50,0 60,0 70,0 80,0 1974 1976 1978 1980 1982 1984 1986 1988 1990 1992 1994 1996 1998 2000 2002 2004 2006 2008 2010 2012 < 1 year ≥ 1 year
Source: National Institute of Statistics (INE) and the Database of Contemporary Portugal
(PORDATA)1.
With regard to educational level (Figure 6), in the period 1992-2013, the largest group of unemployed individuals had a basic education (around 70%, on average) and the smallest group had no education (around 4%, on average). Unemployment among persons with secondary and upper secondary education displayed a gradual growth trend, more accentuated in the years of the crisis. The fraction of the unemployed with higher educational levels was relatively low until the 1990’s (around 4.5% of the total, on average), but since then has
Figure 6. Unemployment by Educational Level, 1992-2013 (% of Total)
0.0 10.0 20.0 30.0 40.0 50.0 60.0 70.0 80.0 90.0
None Primary Secondary and upper secondary Higher
Source: National Institute of Statistics (INE) and the Database of Contemporary Portugal
(PORDATA)1.
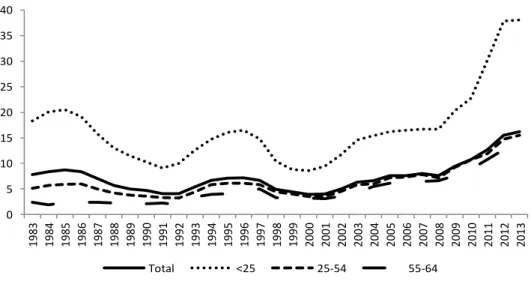
Youth were the most affected by unemployment in the 1983-2013 period: The unemployment rate for 15-24 year-olds increased from 18% in 1983 to a peak of 38% in 2013 (Figure 7). The worsening of unemployment during the years of the crisis has been particularly felt by youth, with an exponential increase in their unemployment rate, which more than doubled in the 2008-2013 period.
Figure 7. Unemployment Rate by Age, 1983-2013 (%)
0 5 10 15 20 25 30 35 40 1983 1984 1985 1986 1987 1988 1989 1990 1991 1992 1993 1994 1995 1996 1997 1998 1999 2000 2001 2002 2003 2004 2005 2006 2007 2008 2009 2010 2011 2012 2013 Total <25 25-54 55-64
Source: National Institute of Statistics (INE) and the Database of Contemporary Portugal
(PORDATA)2.
1 www.ine.pt & www.pordata.pt. 2 www.ine.pt & www.pordata.pt.
The sharp growth of the unemployment rate after the 2000’s was also felt by the other age groups, but they exhibited lower unemployment rates. The group of workers between 25 and 54 years of age exhibited a rate of unemployment closer to that of the total labour force, whereas the rate of unemployment among workers between 55 and 64 years of age was the lowest. This can be explained by the long-term (permanent) employment pattern in the Portuguese economy in the first decades after the establishment of the democratic regime.
However, more recently, new and more flexible contractual arrangements, including temporary contracts, have been introduced to fight the rise in unemployment.1 So, in addition to the increase in long-term unemployment,
one of the most important developments in recent years has been the intensification of fixed-term contracts. Portugal followed the other European countries and, with the partial reforms implemented to create a more flexible labour market, also created a dual labour market, with different contracts and protections in employment and unemployment for different groups of workers. The high level of segmentation in the Portuguese labour market is reflected in the growing incidence of fixed-term contracts (in 2013, the fixed-term contracts are 21.5% of total employment), which mostly apply to youth and less experienced workers and, on the other tier, permanent jobs for the more skilled and experienced workers (Centeno and Novo 2012).
Cyclical Properties of Unemployment
In this section, we investigate the cyclical properties of the unemployment rate among the first twelve countries that formed the euro area over the period 1970-2013. For that purpose, we analyse its volatility over the business cycle and its co-movements with the cycle of GDP.
Data and Methods
The variables considered are annual time series of gross domestic product (GDP) at 2005 constant prices, in millions of euros, and the unemployment rate (UNR) expressed as a percent of the civilian labour force, for the period 1970-2013.2 The main source of data used in this section is the OECD database (http://data.oecd.org).
To obtain the cyclical components of the variables, we used both the Hodrick-Prescott (HP) filter (Hodrick and Prescott 1997) and the Baxter-King
band-pass (BK) filter (Baxter and King 1999).1 The results obtained are
qualitatively similar. For this reason, and because the BK filter is preferable from a theoretical point of view (Stock and Watson, 1998), for the sake of brevity, in the following analysis the focus will be only on the outputs generated using the BK filter. In particular, we have configured the BK filter to extract fluctuations lasting between 1.5 and 8 years.2
Visual inspection of the graphs with the cyclical components of GDP and of the unemployment rate (Figure A.1 in the appendix) reveals the inverse relationship between the two variables over the period 1970-2013. The oscillations of GDP around the trend are larger than those of the unemployment rates, which exhibit smoother fluctuations. These fluctuations differ substantially over time and among countries, indicating the diversity of situations in the euro area.
After filtering the series, we calculated their standard deviations so as to measure the evolution of the cyclical volatility of the unemployment rates and GDP data, as well as the Spearman correlation coefficients between the cycles of the two variables. For each country under study, we analysed the coefficients of contemporary correlation as well as the maximum correlation. We considered a window encompassing two years of leads and lags and, from among those five correlations, we chose the highest figure. In other words, we defined corr(xt,yt+i) as the correlation between the business cycle xt and the
cycle of the unemployment rate yt+i, where the lag i was an integer and -2i2.
If the maximum correlation is obtained for i=0, the cycles are contemporaneous; a positive (negative) value for i means that the cycle in the unemployment rate lags (leads) that in the business cycle by i quarters.
We analysed the whole period (1970-2013) and, in order to perform a more detailed analysis of the impact of the creation of the EMU, we computed the statistics for the period before (1970-1998) and after the inception of the EMU (1999-2013). Also, to get an indication of the impact of the recent crisis, we decided to calculate the correlations for the 1999-2007 period (before the crisis) and to compare that with the 1999-2013 period.3
Empirical Results
Volatility
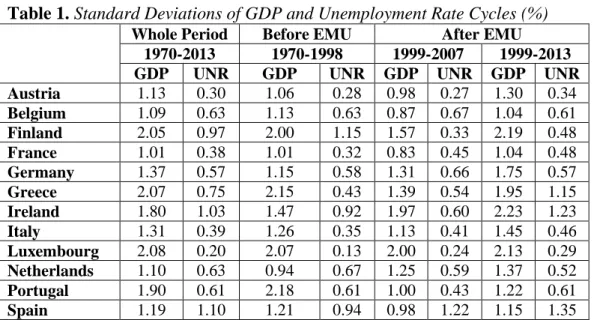
The analysis of the volatility of the cyclical components of GDP and the unemployment rate (Table 1) allows us to conclude that, in line with the literature, the unemployment rate tends to be less volatile than GDP for almost all countries. The exception is Spain in the period after it joined the EMU.
1
The literature suggests several techniques for detrending, of which the HP and BK filters are currently the most widely used. See Canova (2007) for a useful survey and discussion.
2 For the HP filter we set =6.25, which is a customary value among business cycle researchers
using annual data (see, for example, Ravn and Uhlig 2002). The results are available from the authors upon request.
3 The number of observations after 2008 (only six observations) is not enough to calculate the
Another central feature of the data is that, besides their heterogeneity across countries, the cycles in the unemployment rate exhibit low dispersion and relative stability over time. Luxembourg and Austria have the smoothest fluctuations in the cycles in their unemployment rates, in contrast with the large fluctuations in Spain and Ireland. There is a noteworthy, significant reduction for Finland and a large increase for Greece in the volatility of unemployment after inception of the EMU, with particular prominence in the period that includes the recent crisis (1999-2013).
Table 1. Standard Deviations of GDP and Unemployment Rate Cycles (%) Whole Period Before EMU After EMU
1970-2013 1970-1998 1999-2007 1999-2013 GDP UNR GDP UNR GDP UNR GDP UNR Austria 1.13 0.30 1.06 0.28 0.98 0.27 1.30 0.34 Belgium 1.09 0.63 1.13 0.63 0.87 0.67 1.04 0.61 Finland 2.05 0.97 2.00 1.15 1.57 0.33 2.19 0.48 France 1.01 0.38 1.01 0.32 0.83 0.45 1.04 0.48 Germany 1.37 0.57 1.15 0.58 1.31 0.66 1.75 0.57 Greece 2.07 0.75 2.15 0.43 1.39 0.54 1.95 1.15 Ireland 1.80 1.03 1.47 0.92 1.97 0.60 2.23 1.23 Italy 1.31 0.39 1.26 0.35 1.13 0.41 1.45 0.46 Luxembourg 2.08 0.20 2.07 0.13 2.00 0.24 2.13 0.29 Netherlands 1.10 0.63 0.94 0.67 1.25 0.59 1.37 0.52 Portugal 1.90 0.61 2.18 0.61 1.00 0.43 1.22 0.61 Spain 1.19 1.10 1.21 0.94 0.98 1.22 1.15 1.35
Source: Author’s calculations.
In the case of the GDP cycle, for the whole period, Finland, Greece and Luxembourg are the countries that have the highest volatility, contrasting with the lowest figures reported, for Austria, Belgium and France. For most of the euro area countries there is no apparent major change between the periods before and after inception of the EMU, with the exception of Ireland, which shows the largest increase, and Portugal, which displays the greatest reduction in the standard deviation. However, it should be noted that, comparing the period before the crisis (until 2007) to the whole period after inception of the EMU, there is an increase in the volatility of GDP cycles for all countries, especially in the cases of Finland and Greece.
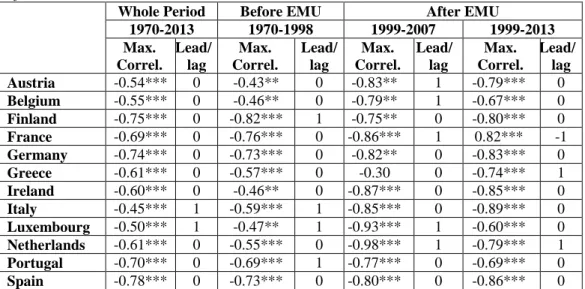
Table 2 presents the coefficients of correlation between cyclical unemployment and GDP for the euro area countries over the whole period, before, and after the implementation of the euro. Overall, the results show
period before the crisis, the figures are higher (in absolute value) and more homogeneous than in the period before inception of the EMU, suggesting that the introduction of the euro induced greater correlation for almost the entire euro area. The exceptions are Finland and Greece, where there were decreases in the absolute values of the cyclical correlations. This is especially true for Greece, where the coefficient of correlation is not statistically significant in the 1999-2007 period, indicating that there may be no systematic relationship between Greek unemployment and the business cycle.
Table 2. Correlation Coefficients: Whole Period, Before, and After Inception of the EMU
Whole Period Before EMU After EMU
1970-2013 1970-1998 1999-2007 1999-2013 Max. Correl. Lead/ lag Max. Correl. Lead/ lag Max. Correl. Lead/ lag Max. Correl. Lead/ lag Austria -0.54*** 0 -0.43** 0 -0.83** 1 -0.79*** 0 Belgium -0.55*** 0 -0.46** 0 -0.79** 1 -0.67*** 0 Finland -0.75*** 0 -0.82*** 1 -0.75** 0 -0.80*** 0 France -0.69*** 0 -0.76*** 0 -0.86*** 1 0.82*** -1 Germany -0.74*** 0 -0.73*** 0 -0.82** 0 -0.83*** 0 Greece -0.61*** 0 -0.57*** 0 -0.30 0 -0.74*** 1 Ireland -0.60*** 0 -0.46** 0 -0.87*** 0 -0.85*** 0 Italy -0.45*** 1 -0.59*** 1 -0.85*** 0 -0.89*** 0 Luxembourg -0.50*** 1 -0.47** 1 -0.93*** 1 -0.60*** 0 Netherlands -0.61*** 0 -0.55*** 0 -0.98*** 1 -0.79*** 1 Portugal -0.70*** 0 -0.69*** 1 -0.77*** 0 -0.69*** 0 Spain -0.78*** 0 -0.73*** 0 -0.80*** 0 -0.86*** 0
Note: *** indicates statistical significance at the 1% level. Source: Authors’ calculations.
Finally, the comparison between the period after inception of the EMU and before the crisis (1999-2007) with the period 1999-2013 only reveals considerable changes for France (which, strangely, presents a positive value when and a one-year lead), Greece (an increase), and Luxembourg (a decrease), suggesting that the crisis may have specifically affected the cyclical behaviour of unemployment for these countries.
Concluding Remarks
Throughout the period analysed (1970-2013), there were significant discrepancies in the evolution of the unemployment rate across the first twelve euro area countries. Since the inception of the EMU, there has been an increase in the rate of unemployment for most of these countries, with particular intensity in the years of the recent crisis. The effects of the economic and sovereign debt crisis are stronger in the cases of Greece, Spain, Portugal and Ireland, which are under pressure related to subsequent fiscal consolidation measures administered in the context of the EFAP by Troika and designed to fight high levels of budget deficits and public debt.
In the particular case of Portugal, unemployment was not a big problem until the end of the twentieth century. However, since then conditions have deteriorated substantially, and unemployment has exhibited a growth trend, sharper during the years of the recent crisis. A rise in long-term unemployment and in the use of fixed-term contracts characterizes the recent evolution of the Portuguese labour market. Our figures also show that unemployment has particularly affected women, youth and the less qualified.
The analysis of volatility of the cyclical components of GDP and the unemployment rate reveals that, besides their heterogeneity across countries, the unemployment rate tends to be less volatile than GDP for most euro area countries. Also, there was no substantial change in the dispersion in the cycles of the unemployment rate and GDP between the periods before and after inception of the EMU, the exceptions being a significant reduction in the volatility of unemployment for Finland, a great increase for Greece in the period after inception of the EMU and, in the case of the business cycle, a large increase in the standard deviation for Ireland and a large reduction for Portugal. The correlations between business cycles and unemployment rate cycles for the whole sample period indicate countercyclical and synchronized behaviour in most of the euro area countries, with differences in the degree of association between the cycles of the two variables. The results also suggest that the introduction of the euro induced stronger (negative) correlation for the majority of the euro area countries (Finland and Greece are the exceptions.)
The evidence of substantial heterogeneity among euro area members in the degree of association between the cycles of GDP and the unemployment rate over time is meaningful in the present context of a common currency and a single monetary policy because the effects of those policies vary across countries. Additionally, as we have seen, the impact of the crisis accentuates the differences among euro area countries. The increase in unemployment was not homogeneous, with some member states being more resilient to the crisis than others. Portugal was particularly affected and has enlarged its rate of unemployment.
The more recent numbers from EUROSTAT indicate that, apparently, we are finally seeing some positive, but fragile, signals that the recovery is coming. In 2014, the unemployment rate decreased for most euro area countries. In this year, the Portuguese unemployment rate reached about 14%, but it is still too high, and new job creation is too low.
In the future, it will be important to extract valuable lessons from the past and, in particular, from the crisis years, and to restore real convergence in the euro area. The importance of the problem of unemployment to the agenda of
Acknowledgements
This work is supported by national funds provided by the FCT - Portuguese Foundation for Science and Technology, through its project UID/SOC/04011/2013.
References
Bank of Portugal (2014) Annual Report: The Portuguese Economy. Bank of Portugal, Lisbon.
Bank of Portugal (2015) The Portuguese labour market and the Great Recession. Economic Bulletin (May).
Barbosa A, Barreto A, Leite A, Rosa M, Abreu M, Saint Aubyn M, Alves N, Gaspar V, Gouveia M (1998) O Impacto do Euro na Economia Portuguesa [The Impact of the Euro on the Portuguese Economy]. Lisboa: Ministério das Finanças. Baxter M, King R (1999) Measuring business cycles: approximate band-pass filters
for economic time series. The Review of Economics and Statistics 81: 575-593. Blanchard O (2005) European Unemployment: The Evolution of Facts and Ideas.
NBER 11750.
Blanchard O, Jimeno J (1995) Structural unemployment: Spain versus Portugal. American Economic Review 85(2): 213-218.
Blanchard O, Portugal P (2001) What hides behind an unemployment rate: comparing Portuguese and US labor markets. American Economic Review 91(1): 187-207. Blanchard O, Wolfers J (2000) Shocks and institutions and the rise of European
unemployment: the aggregate evidence. Economic Journal 110(1): 1-33.
Bover O, Garcia-Perea P, Portugal P (1998) A comparative study of the Portuguese and Spanish labour markets. Working Paper 9807. Banco de Espana.
Burda M, Wyplosz C (2011) Macroeconomics: A European Text (5th Edn.) Verlag Dashöfer: Oxford University Press.
Canova F (2007) Methods for Applied Macroeconomic Research. Princeton University Press.
Centeno M, Novo A (2012) Excess worker turnover and fixed-term contracts: causal evidence in a two-tier system. Labour Economics 19(3): 320-328.
Feldmann H (2009) The unemployment effects of labor regulation around the world. Journal of Comparative Economics 37: 76-90.
Garcia-Cintado A, Romero-Ávila D, Usabiaga C (2014) Spanish regional unemployment: disentangling the sources of hysteresis. New York: Springer Briefs in Economics.
Goldin C, Katz L (2008) The Race Between Education and Technology. Harvard University Press.
Hodrick R, Prescott E (1997) Postwar US business cycles: an empirical investigation. Journal of Money, Credit and Banking 29: 1-16.
IMF (2015) Portugal: First Post-Program Monitoring Discussions. Staff Report, Press Release, and Statement by Executive Director. Country Report No. 15/21. Luz S, Pinheiro M (1994) Wage Rigidity and Job Mismatch in Europe: Some
Evidence. Working Papers 2-94. Banco de Portugal.
OECD (2015) In It Together: Why Less Inequality Benefits All. OECD Publishing. Paris.
Portugal P (1999) Employment volatility, employment protection and unemployment. Economic Bulletin and Financial Stability Report Articles. Bank of Portugal. Ravn MO, Uhlig H (2002) On adjusting the Hodrick-Prescott filter for the frequency
of observations. The Review of Economics and Statistics 84(2): 371-380.
Stock J, Watson M (1998) Business Cycle Fluctuations in US Macroeconomics Time Series. NBER 6528.
